Sample Category Title
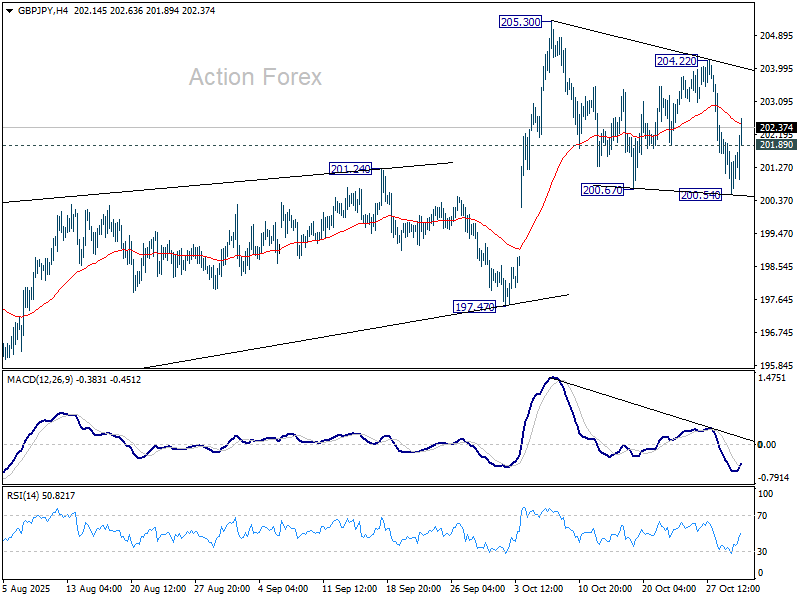
GBP/JPY Daily Outlook
Daily Pivots: (S1) 200.71; (P) 201.38; (R1) 202.20; More...
Intraday bias in GBP/JPY is turned neutral first with current recovery. Price actions from 205.30 so far suggests that it's merely a consolidation pattern, and larger rally is not complete. On the upside, break of 204.22 will affirm near term bullishness and target 205.30 high next. Nevertheless, below 200.54 will extend the fall from 205.30 towards 197.47 key structural support.
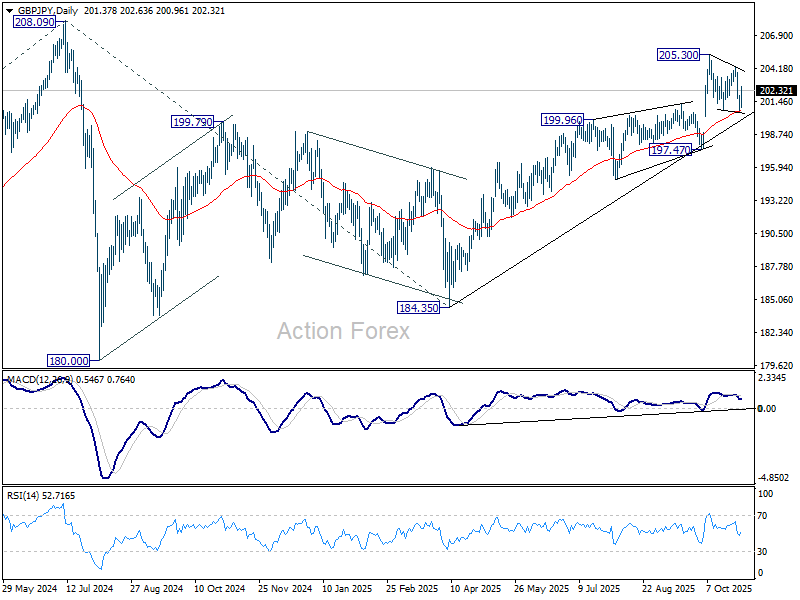
In the bigger picture, price actions from 208.09 (2024 high) are seen as a corrective pattern which might have completed at 184.35. Firm break of 208.09 high will resume the up trend from 123.94 (2020 low). Next target is 61.8% projection of 148.93 to 208.09 from 184.35 at 220.90. However, decisive break of 197.47 support will dampen this view and extend the corrective pattern with another fall.
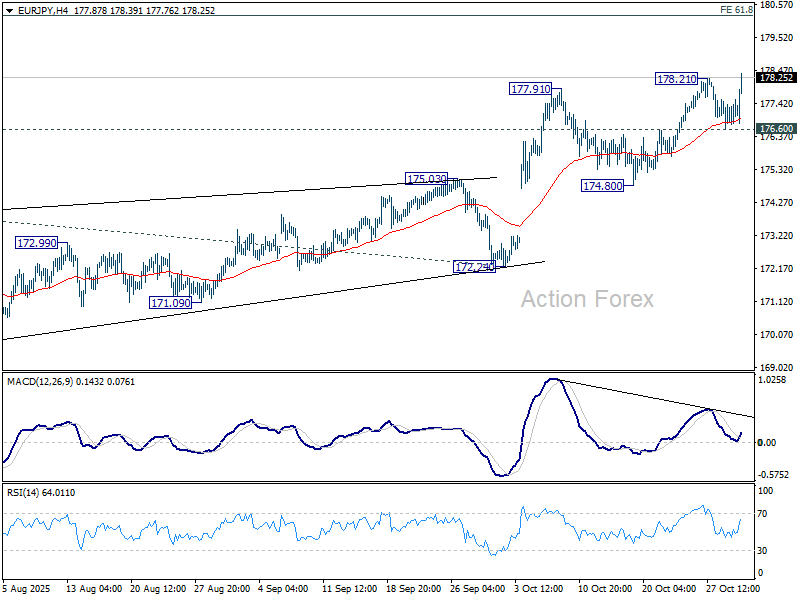
EUR/JPY Daily Outlook
Daily Pivots: (S1) 176.67; (P) 177.14; (R1) 177.64; More...
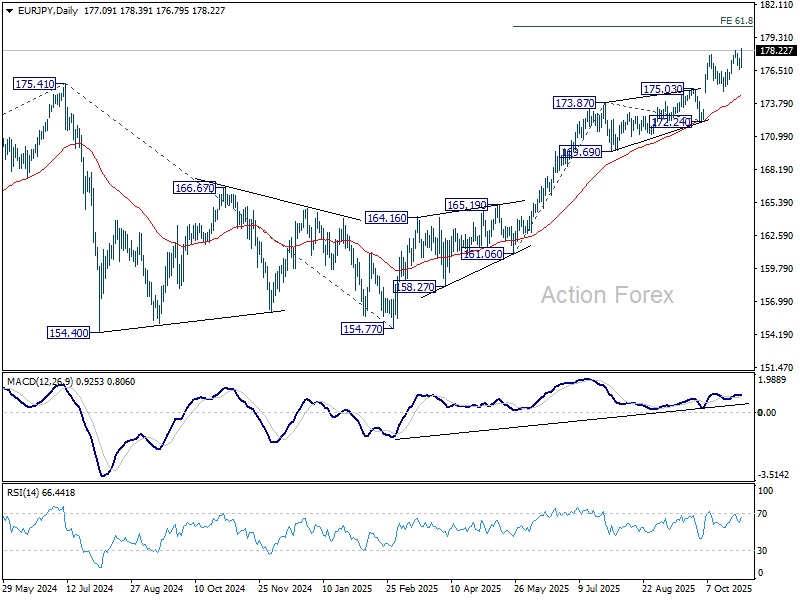
EUR/JPY's rally resumed after brief consolidations and intraday bias is back on the upside. Current up trend should target 61.8% projection of 161.06 to 173.87 from 172.24 at 180.15 next. On the downside, below 176.60 will turn bias neutral again. But overall outlook will remain bullish as long as 174.80 support holds, in case of retreat.
In the bigger picture, up trend from 114.42 (2020 low) is in progress and should target 61.8% projection of 124.37 to 175.41 from 154.77 at 186.31. Firm break of 172.24 support will suggests that it has turned into consolidations again. But still, outlook will continue to stay bullish as long as 55 W EMA (now at 167.87) holds, even in case of deep pullback.
EUR/GBP Daily Outlook
Daily Pivots: (S1) 0.8773; (P) 0.8796; (R1) 0.8814; More…
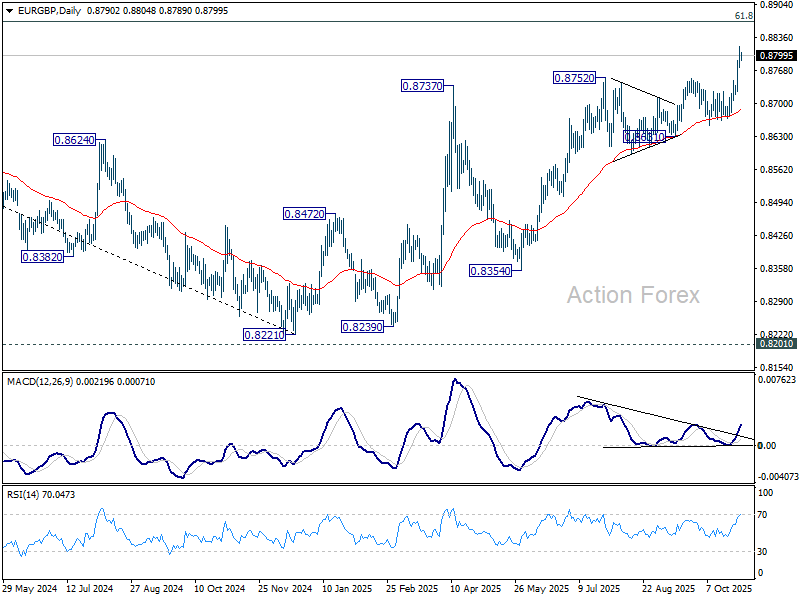
Intraday bias in EUR/GBP remains on the upside for 0.8867 fibonacci level. Decisive break there will carry larger bullish implications. On the downside, below 0.8718 minor support will turn intraday bias neutral again first. But near term outlook will now stay bullish as long as 0.8654 support holds, in case of retreat.
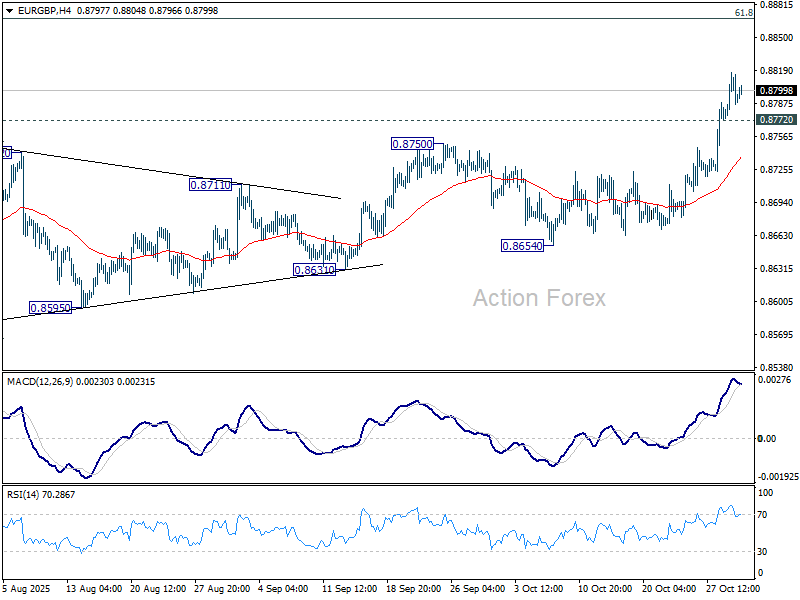
In the bigger picture, rise from 0.8221 medium term bottom is seen as a corrective move. While further rally cannot be ruled out, upside should be limited by 61.8% retracement of 0.9267 to 0.8221 at 0.8867. Firm break of 0.8654 support will be the first sign that this corrective bounce has completed. However, decisive break of 0.8867 will suggest that EUR/GBP is already reversing whole decline from 0.9267 (2022 high).
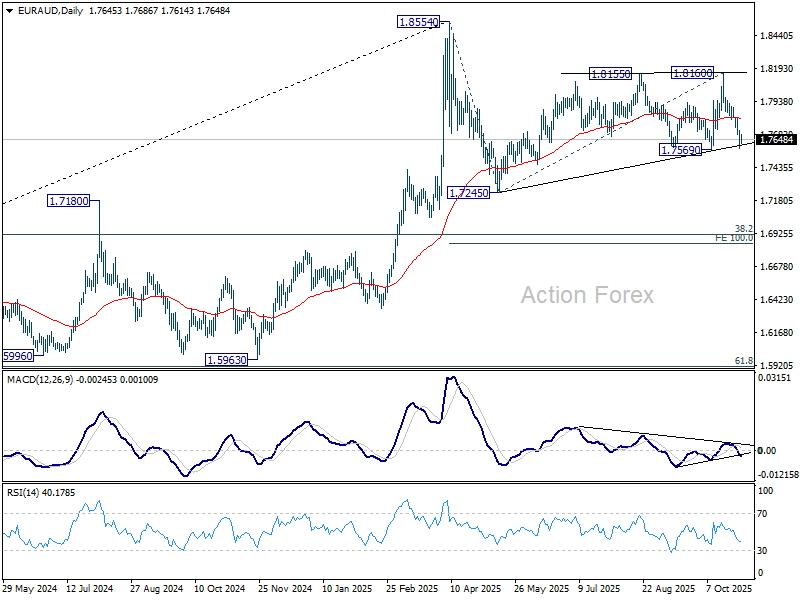
EUR/AUD Daily Outlook
Daily Pivots: (S1) 1.7575; (P) 1.7648; (R1) 1.7715; More...
Intraday bias in EUR/AUD remains on the downside at this point. Firm break of 1.7569 support will confirm that pattern from 1.8554 already in its third leg, and target 1.7245 next. On the upside, above 1.7717 minor resistance will turn intraday bias neutral and bring consolidations first, before staging another decline.
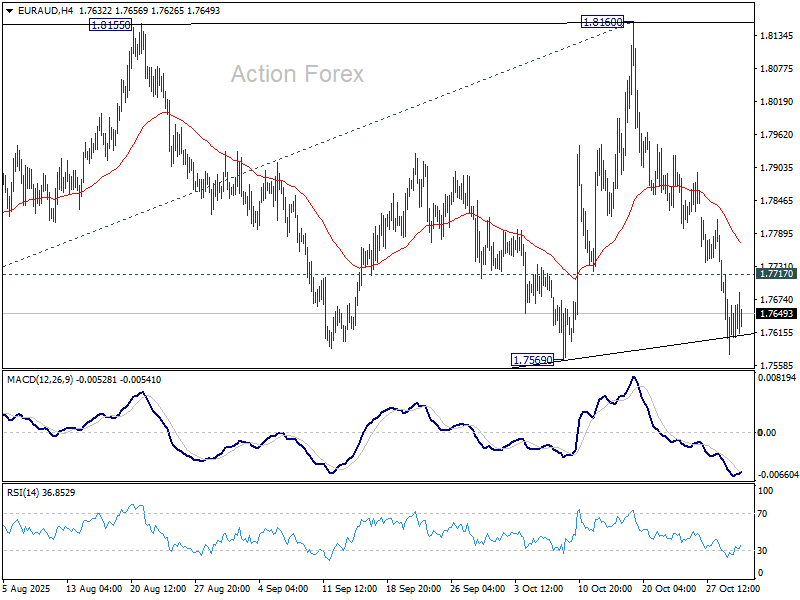
In the bigger picture, price actions from 1.8554 medium term top are seen as a corrective pattern. Sustained break of 55 W EMA will suggest that it's correcting the whole rally from 1.4281 (2022 low). In this case, deeper decline would be seen to 38.2% retracement of 1.4281 to 1.8554 at 1.6922. Nevertheless, strong rebound form 55 W EMA will likely bring resumption of the up trend sooner.
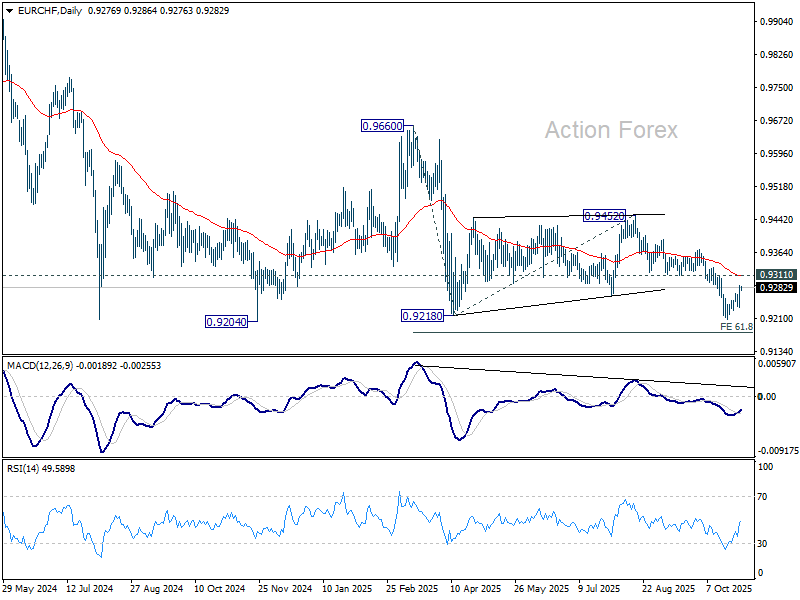
EUR/CHF Daily Outlook
Daily Pivots: (S1) 0.9250; (P) 0.9270; (R1) 0.9301; More....
Intraday bias in EUR/CHF remains neutral. While recovery from 0.9208 could extend, upside should be limited below 0.9311 support turned resistance. On the downside, below 0.9236 will bring retest of 0.9208 low first. Decisive break of 0.9204/8 will confirm larger down trend resumption. Next target is 61.8% projection of 0.9660 to 0.9218 from 0.9452 at 0.9179. However, sustained break of 0.9311 will bring stronger rebound back to 0.9452 resistance instead.
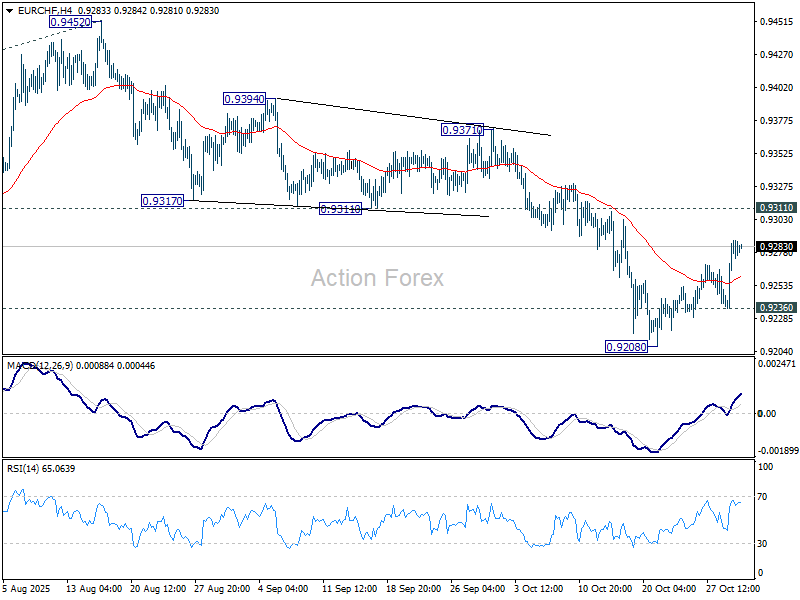
In the bigger picture, outlook remains bearish with EUR/CHF staying well inside long term falling channel after multiple rejection by 55 W EMA (now at 0.9385). Firm break of 0.9204 will resume the whole down trend from 1.2004 (2018 high). Next target is 61.8% projection of 1.1149 to 0.9407 from 0.9928 at 0.8851. Break of 0.9452 resistance is needed to be the first sign of medium term bottoming.
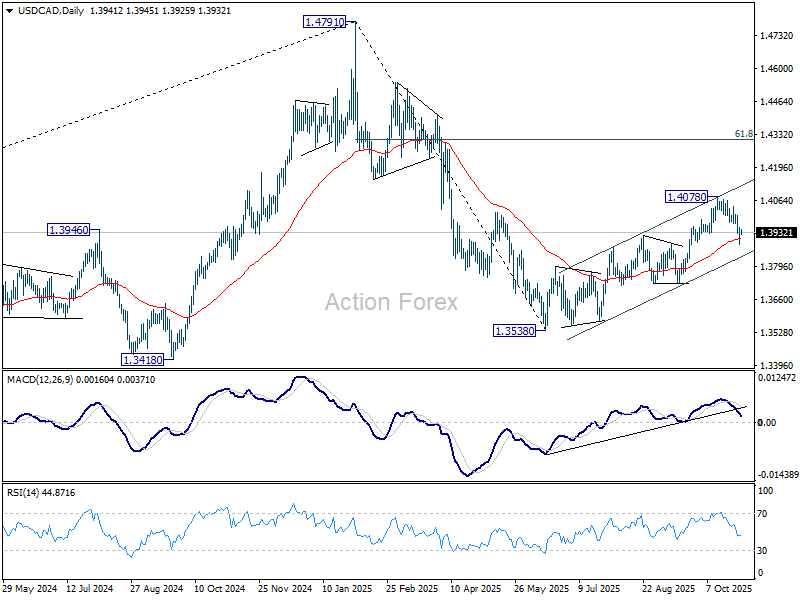
USD/CAD Daily Outlook
Daily Pivots: (S1) 1.3902; (P) 1.3928; (R1) 1.3969; More...
Intraday bias in USD/CAD remains on the downside for the moment. Fall from 1.4078 should extend to rising channel support (now at 1.3842). Sustained break there will be a sign of bearish reversal. That is, rebound from has completed at 1.4078, and further fall would be seen to 1.3725 support for confirmation. On the upside, though, above 1.3969 minor resistance will turn intraday bias neutral again first.
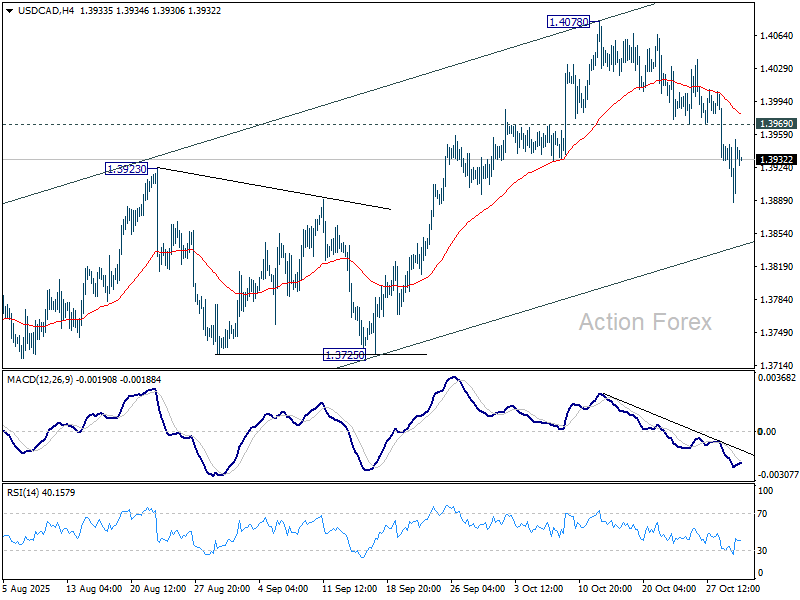
In the bigger picture, price actions from 1.4791 medium term top is likely just unfolding as a correction to up trend from 1.2005 (2021 low). Based on current momentum, rise from 1.3538 is the second leg, and a third leg should follow before up trend resumption. That is, range trading is set to extend for the medium term. For now, this will remain the favored case as long as 1.3725 support holds. However, firm break of 1.3725 will revive the case that fall from 1.4791 is indeed a larger scale correction.
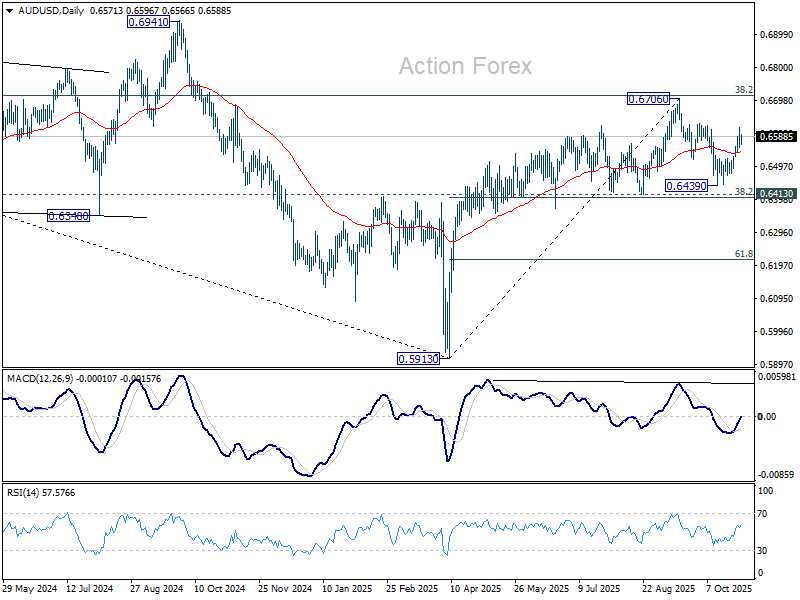
AUD/USD Daily Report
Daily Pivots: (S1) 0.6548; (P) 0.6583; (R1) 0.6609; More...
A temporary top is formed at 0.6616 in AUD/USD with current retreat and intraday bias is turned neutral. Outlook is unchanged that corrective fall from 0.6706 should have completed with three waves to 0.6439. Above 0.6616 will target a retest on 0.6706 high next. However, break of 0.6524 resistance turned support will dampen this view, and bring deeper fall back to 0.6439 support instead.
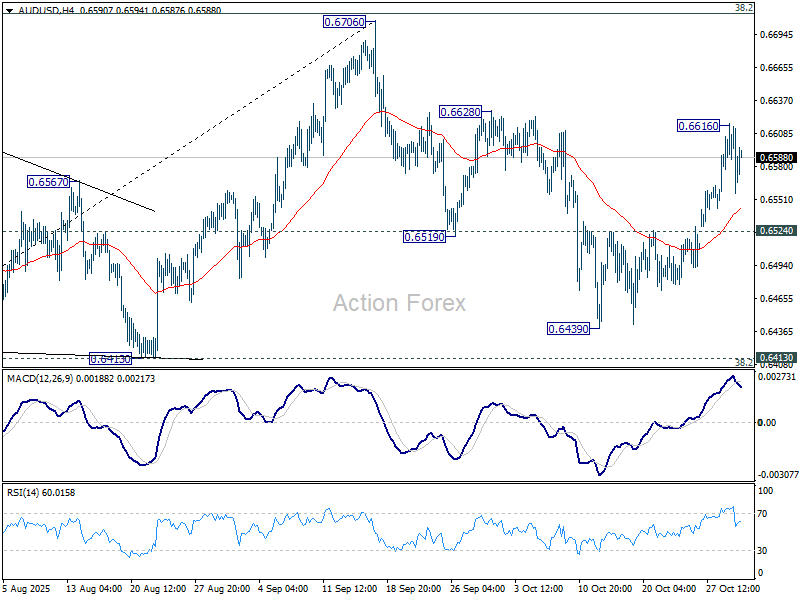
In the bigger picture, there is no clear sign that down trend from 0.8006 (2021 high) has completed. Rebound from 0.5913 is seen as a corrective move. Outlook will remain bearish as long as 38.2% retracement of 0.8006 to 0.5913 at 0.6713 holds. Nevertheless, considering bullish convergence condition in W MACD, sustained break of 0.6713 will be a strong sign of bullish trend reversal, and pave the way to 0.6941 structural resistance for confirmation.
EUR/USD Daily Outlook
Daily Pivots: (S1) 1.1564; (P) 1.1615; (R1) 1.1652; More…
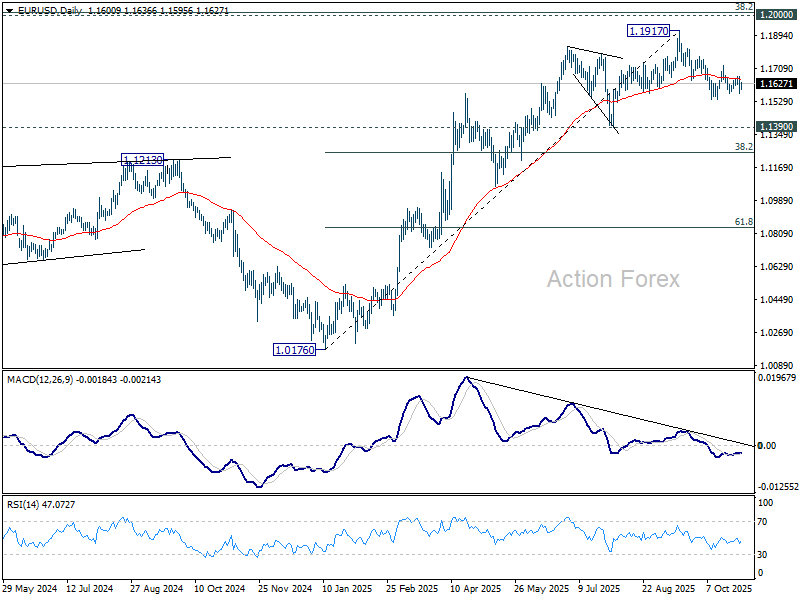
Intraday bias in EUR/USD remains neutral as sideway trading continues. On the downside, below 1.1540 will resume the fall from 1.1917 and target 1.1390 support, or even further to 38.2% retracement of 1.0176 to 1.1917 at 1.1252. On the upside, though, break of 1.1727 resistance will turn bias back to the upside for 1.1778, and then retest of 1.1917 high instead.
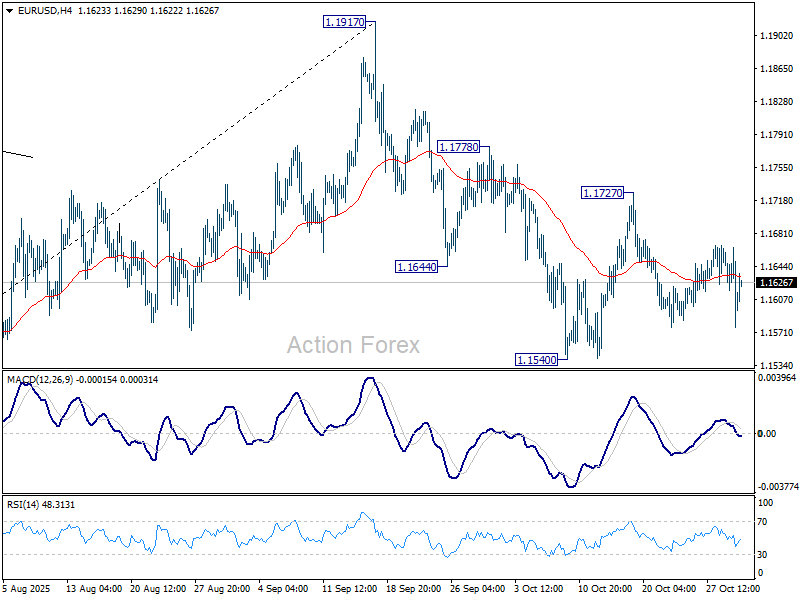
In the bigger picture, considering bearish divergence condition in D MACD, a medium term top is likely in place at 1.1917, just ahead of 1.2 key psychological level. As long as 55 W EMA (now at 1.1301) holds, the up trend from 0.9534 (2022 low) is still expected to continue. Decisive break of 1.2000 will carry larger bullish implications. However, sustained trading below 55 W EMA will argue that rise from 0.9534 has completed as a three wave corrective bounce, and keep outlook bearish.
GBP/USD Daily Outlook
Daily Pivots: (S1) 1.3130; (P) 1.3206; (R1) 1.3270; More...
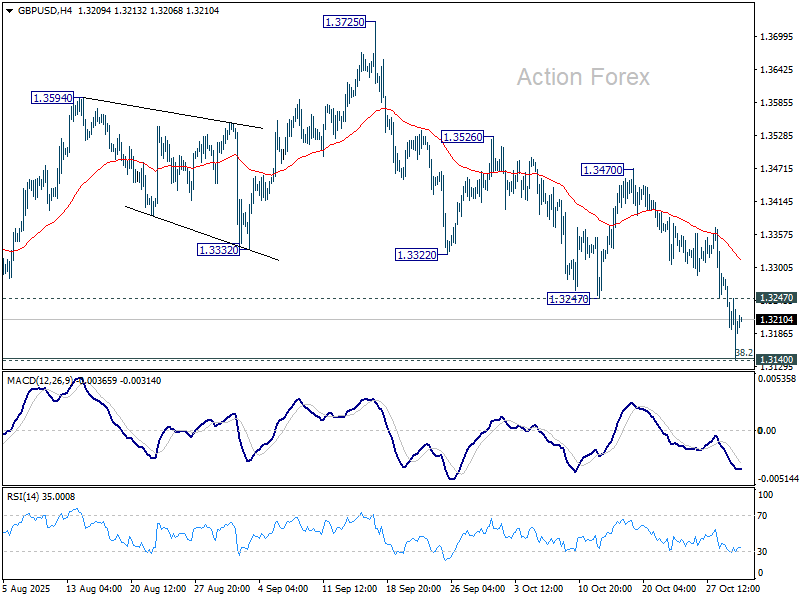
Immediate focus is now on 1.3140 cluster (38.2% retracement of 1.2099 to 1.3787 at 1.3142) as GBP/USD's fall extended. Strong support is expected there to contain downside to complete the corrective pattern from 1.3787. On the upside, above 1.3247 support turned resistance will turn intraday bias neutral first. However, decisive break of 1.3140/2 will complete a double top pattern (1.3787/3725) and turn near term outlook bearish.
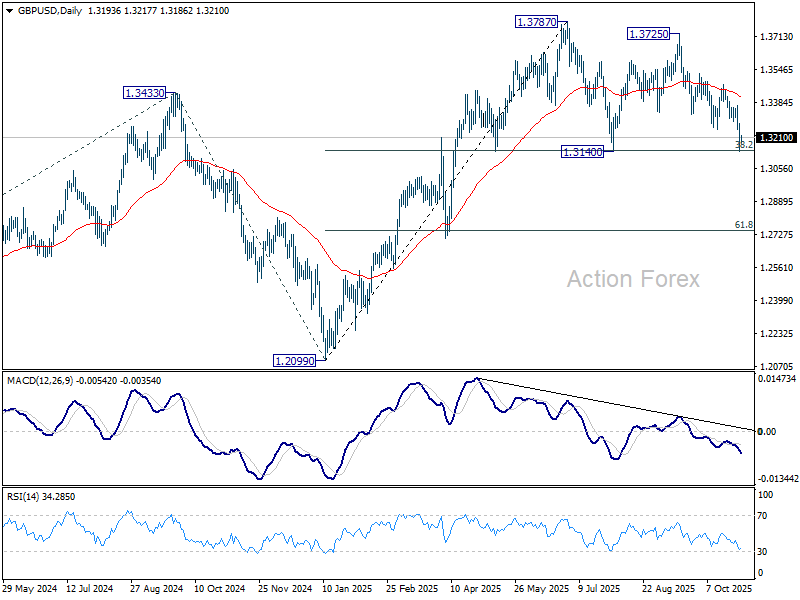
In the bigger picture, rise from 1.0351 (2022 low) is still seen as a corrective move. Further rally could be seen to 61.8% projection of 1.0351 to 1.3433 (2024 high) from 1.2099 (2025 low) at 1.4004. But strong resistance could emerge from 1.4248 (2021 high) to limit upside. Sustained break of 55 W EMA (now at 1.3191) will argue that a medium term top has already formed and bring deeper fall back to 1.2099.
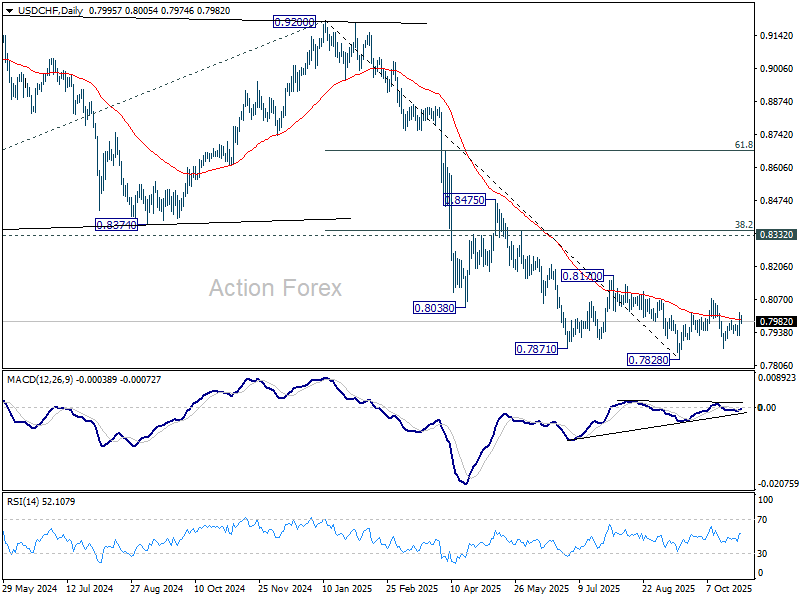
USD/CHF Daily Outlook
Daily Pivots: (S1) 0.7943; (P) 0.7981; (R1) 0.8037; More…
USD/CHF's rebound from 0.7872 resumed higher and the development suggests that corrective pattern from 0.7878 is extending with another rising leg. Intraday bias is back on the upside for 0.8075 resistance first. For now, risk will be mildly on the upside as long as 0.7924 support holds, in case of retreat.
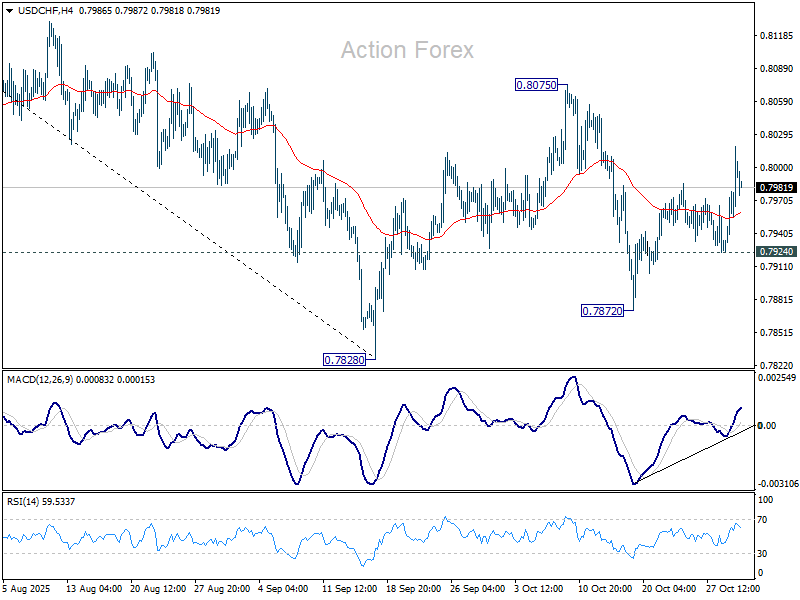
In the bigger picture, long term down trend from 1.0342 (2017 high) is still in progress. Next target is 100% projection of 1.0146 (2022 high) to 0.8332 from 0.9200 at 0.7382. In any case, outlook will stay bearish as long as 0.8332 support turned resistance holds (2023 low).