
Sample Category Title
USD/JPY Mid-Day Outlook
Daily Pivots: (S1) 152.73; (P) 153.59; (R1) 155.02; More...
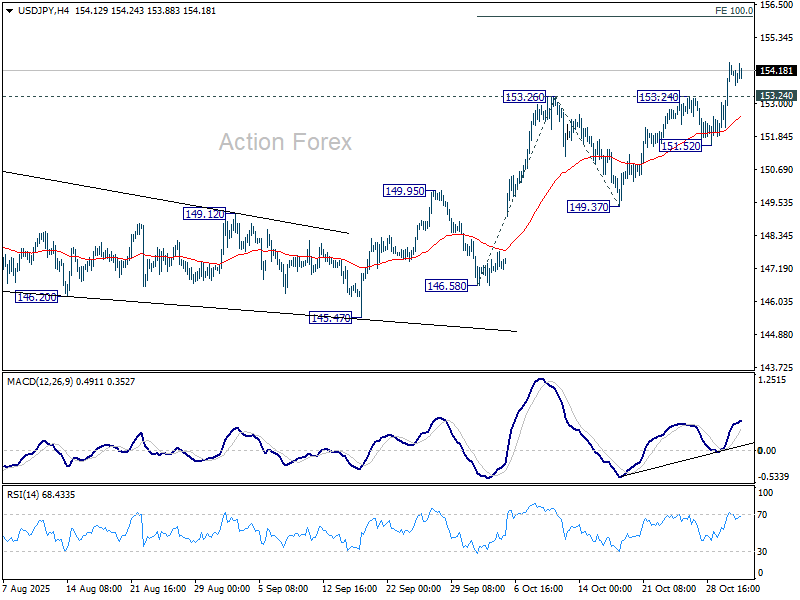
No change in USD/JPY's outlook and intraday bias stays on the upside. Current rally is part of the whole rise from 139.87 and should target 100% projection of 146.58 to 153.26 from 149.37 at 156.05. Firm break there will target 158.86 resistance next. On the downside, below 153.24 resistance turned support will turn intraday bias neutral first. But outlook will stay bullish as long as 151.52 support holds, in case of retreat.
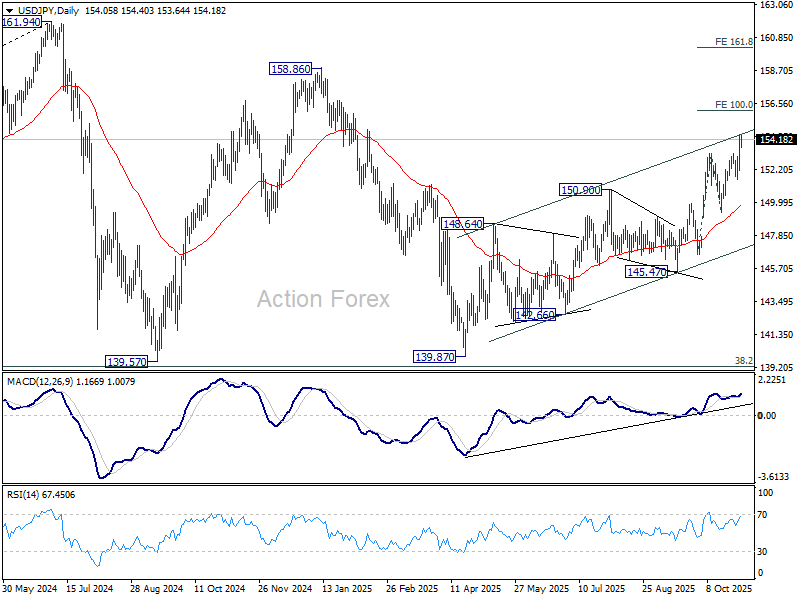
In the bigger picture, current development suggests that corrective pattern from 161.94 (2024 high) has completed with three waves at 139.87. Larger up trend from 102.58 (2021 low) could be ready to resume through 161.94 high. On the downside, break of 145.47 support will dampen this bullish view and extend the corrective pattern with another falling leg.
USD/CHF Mid-Day Outlook
Daily Pivots: (S1) 0.7984; (P) 0.8011; (R1) 0.8045; More…
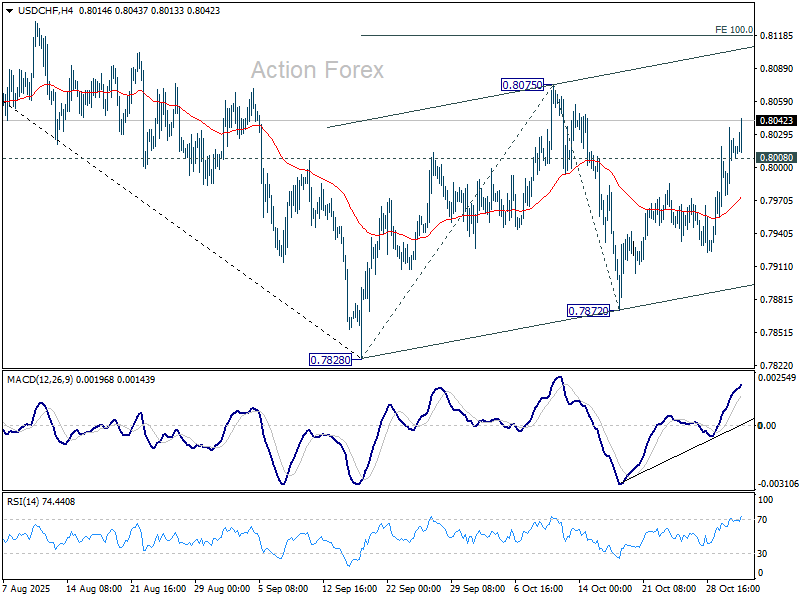
No change in USD/CHF's outlook and intraday bias remains on the upside. Corrective pattern from 0.7878 is in its third leg. Further rise should be seen to 0.8075 resistance. Firm break there will target 100% projection of 0.7828 to 0.8075 from 0.7872 at 0.8119. On the downside, below 0.8008 minor support will turn intraday bias neutral first.
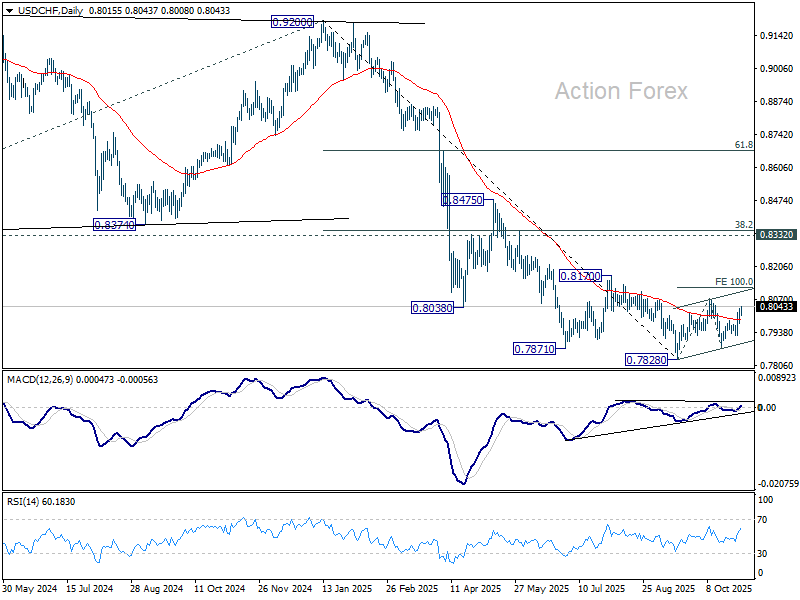
In the bigger picture, long term down trend from 1.0342 (2017 high) is still in progress. Next target is 100% projection of 1.0146 (2022 high) to 0.8332 from 0.9200 at 0.7382. In any case, outlook will stay bearish as long as 0.8332 support turned resistance holds (2023 low).
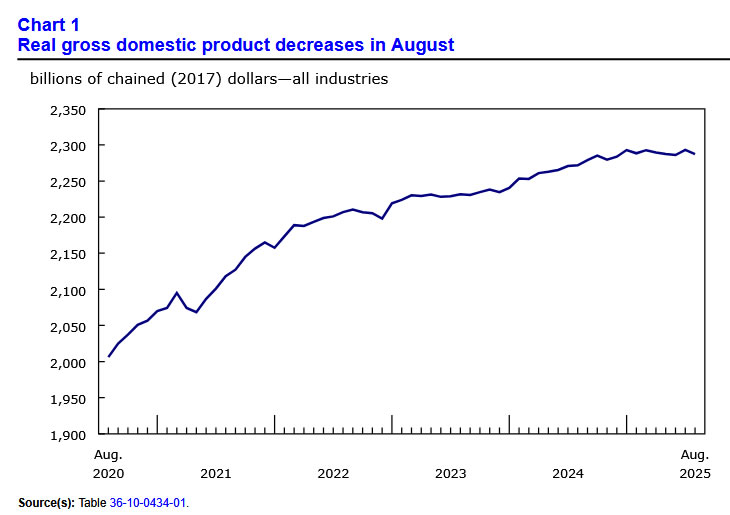
Canada’s Economy Cooled in August
Canadian GDP contracted by 0.3% m/m in August, against consensus expectations of no growth.
Compositionally, 12 of 20 industries registered a decline on the month. Goods industries (-0.6% m/m) reversed out last month's hefty gain, while the services sector nudged down by -0.1% m/m.
On the goods side, the mining, oil & gas sector lost some steam (-0.7% m/m) after a three-month string of gains. A -0.5% m/m contraction in the manufacturing sector also contributed to the broad-based slowdown in goods sectors.
On the services side, the airline strike activity pushed air transportation lower by 4.6% m/m in August. Meanwhile, wholesale trade declined by 1.2% m/m in August, dragged down by activity in the motor vehicles and parts wholesales subcategory. Retail trade, up 0.9% m/m, offset some of the drag.
Advanced guidance calls for a slight uptick in September GDP (0.1% m/m). Increases in the finance and insurance, energy, and manufacturing sectors are expected to be partially offset by activity in wholesale and retail trade.
Key Implications
Tariff-impacted industries remain under pressure from trade-related challenges. While consumption and domestic demand have shown some stability, third-quarter GDP growth is tracking a paltry 0.4% annualized, consistent with our forecasts and the Bank of Canada's recent October MPR. Official expenditure-based GDP measurement faces heightened uncertainty as next month's trade data will be unavailable due to the U.S. government shutdown.
The BoC has acknowledged that trade-related impacts on inflation and economic growth are become more clear. We'd agree, though that doesn't lower the level of uncertainty in coming quarters as Canada and the U.S. continue to work on hammering out a trade deal. For now, the growth backdrop is expected to remain weak and gradually recover over the medium-term. As such, we maintain our view that the BoC has reached the end of their interest rate easing cycle after delivering a 25 bps cut this week.
GBP/USD Mid-Day Outlook
Daily Pivots: (S1) 1.3105; (P) 1.3162; (R1) 1.3207; More...
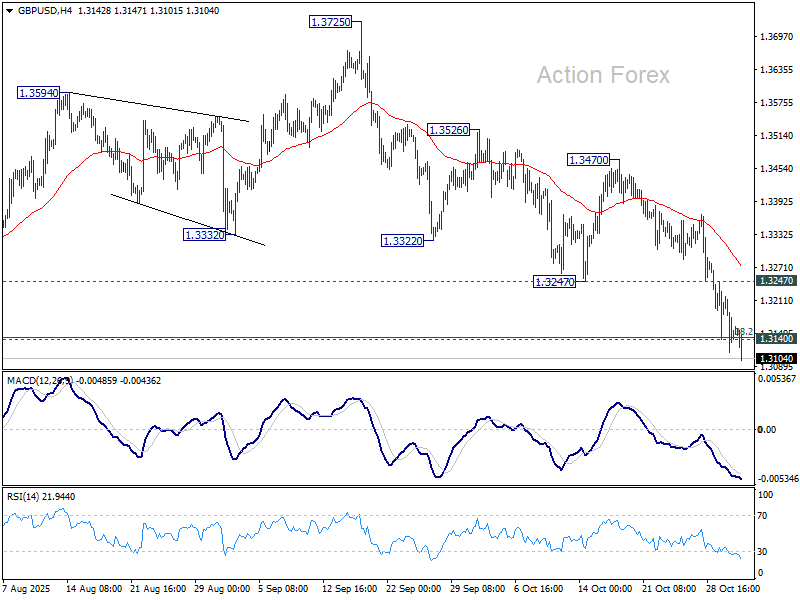
GBP/USD's decline continues today and the break of 1.3140 cluster (38.2% retracement of 1.2099 to 1.3787 at 1.3142) now suggests that a double top pattern (1.3787/3725) was already in place. Intraday bias stays on the downside for 61.8% retracement at 1.2744 next. On the upside break of 1.3247 support turned resistance is needed to indicate short term bottoming. Otherwise, risk will stay on the downside in case of recovery.
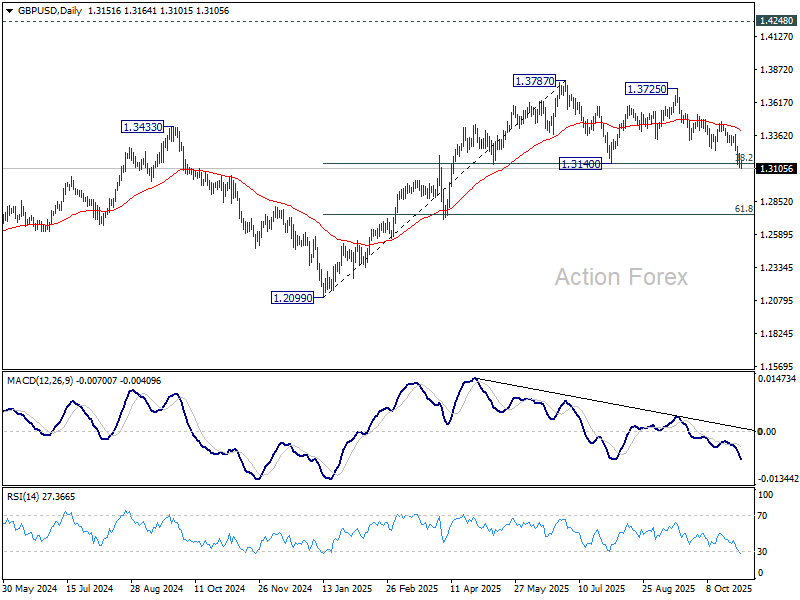
In the bigger picture, rise from 1.0351 (2022 low) is still seen as a corrective move. Sustained trading below 55 W EMA (now at 1.3191) will argue that a medium term top has already formed and bring deeper fall back to 1.2099. Firm break there will confirm bearish reversal. In case of another rise, strong resistance should emerge below 1.4248 (2021 high) to cap upside.
Dollar Extends Rally as Fed Hawks Push Back on Rate Cut
Dollar’s rally gained momentum as markets headed into the final U.S. session of both the week and the month, supported by a fresh round of hawkish remarks from Fed officials. After a few days dominated by post-FOMC positioning, the greenback found renewed strength as investors reconsidered the likelihood of another rate cut in December.
Kansas City Fed President Jeffrey Schmid, who dissented against this week’s 25-basis-point reduction, said the economy remained strong with inflation still “too high,” adding that monetary policy should continue to “lean against demand growth.” His comments were quickly echoed by Dallas Fed President Lorie Logan, who also argued that there was no need to cut rates this week given the economy’s resilience. Logan went further, suggesting that another cut in December would only be warranted if there were clear evidence of a faster decline in inflation or a sharp weakening in the labor market.
For now, futures markets still assign about a 60% probability of a 25-basis-point cut in December. However, if more Fed hawks step forward in the coming weeks, that pricing could slip closer to an even split, marking a notable shift from the 90% probability seen before Wednesday’s FOMC meeting.
In currency markets, Aussie remains the top performer of the week, but Dollar is closing in rapidly and could overtake by session’s end if buying persists. Loonie also ranks near the top, though its August GDP contraction has capped upside momentum. At the other end, Sterling continues to struggle, staying at the bottom alongside Swiss Franc and Yen, while Euro and Kiwi trade in the middle of the pack.
In Europe, at the time of writing, FTSE is down -0.31%. DAX is down -0.52%. CAC is down -0.44%. UK 10-year yield is down -0.013 at 4.419. Germany 10-year yield is down -0.01 at 2.638. Earlier in Asia, Nikkei rose 2.12%. Hong Kong HSI fell -1.43%. China Shanghai SSE fell -0.81%. Singapore Strait Times fell -0.20%. Japan 10-year JGB yield rose 0.012 to 1.659.
Fed’s Schmi: Cutting now won’t fix labor issues, may damage credibility
Kansas City Fed President Jeffrey Schmid offered a firm defense of his decision to oppose this week’s quarter-point rate cut, arguing that the U.S. economy remains resilient and inflation too high to justify further policy easing.
In a statement, Schmid said the labor market is “largely in balance”, the economy continues to show “momentum,” and policy remains “only modestly restrictive.” On that basis, he judged it appropriate to hold rates steady at this week’s meeting.
Schmid emphasized that monetary policy should continue to “lean against demand growth” to give supply room to expand and relieve price pressures.
The Kansas City Fed chief also highlighted the uneven effects of monetary policy on the Fed’s dual mandate. He noted that current labor market stresses are more structural, driven by technology and demographics, rather than cyclical weakness that rate cuts could effectively address. As such, he questioned the utility of further easing to support employment at this stage.
On the other hand, Schmid warned that even small rate reductions could have “longer-lasting effects on inflation” if markets begin to doubt the Fed’s commitment to its 2% target.
Canada GDP shrinks -0.3% mom in August, broad-based weakness offsets September rebound hopes
Canada’s economy contracted -0.3% mom in August, a much steeper decline than the expected flat reading, highlighting broad-based weakness across both goods and services sectors.
According to Statistics Canada, goods-producing industries fell -0.6%, marking the fifth contraction this year. Services-producing industries slipped -0.1%, the first decline in six months. The data reinforce concerns that Canada’s growth momentum remains fragile amid trade headwinds and domestic softness.
Looking ahead, advance estimates suggest GDP rose 0.1% mom in September, offering a modest sign of stabilization. Gains in finance, insurance, mining, oil and gas extraction, and manufacturing were partly offset by declines in wholesale and retail trade.
Eurozone CPI eases to 2.1%, but core holds firm at 2.4%
Eurozone inflation slowed slightly in October, though underlying price pressures remained sticky. According to the flash estimate, headline CPI edged down to 2.1% yoy from 2.2%, in line with expectations. Core inflation, which excludes energy, food, alcohol and tobacco, held steady at 2.4%, surprising on the upside compared with forecasts of 2.3%.
A closer look at the breakdown shows services inflation rose to 3.4% from 3.2%, confirming that the most persistent source of price pressure continues to come from the labor-intensive service sector. Meanwhile, food, alcohol and tobacco inflation eased to 2.5%, non-energy industrial goods slowed to 0.6%, and energy prices fell -1.0%, marking a deeper decline than September’s -0.4%.
Japan's Tokyo core CPI surges to 2.8%, BoJ hike timing still unclear
Japan’s Tokyo CPI figures for October showed broad-based acceleration in inflation, adding to pressure on the BoJ but stopping short of forcing an immediate policy move. Core CPI (excluding fresh food) climbed from 2.5% to 2.8% yoy, beating expectations of 2.6%. Core-core measure (excluding fresh food and energy) matched that rise, also hitting 2.8%, while headline inflation accelerated from 2.5% to 2.8%.
The increase was driven partly by a 38.4% surge in rice prices and the expiration of water-fee subsidies, which lifted utility costs. Food inflation, excluding fresh items, remained high at 6.7%, though slightly slower than September’s 6.9%. Meanwhile, services inflation was relatively steady at 1.6%, well below the 4.1% gain in goods prices. The mix suggests cost pressures are persistent but not yet translating into sustained demand-led inflation.
At its meeting yesterday, the BoJ left the policy rate unchanged at 0.50%. Governor Kazuo Ueda said the likelihood of the Bank’s baseline projection materializing had “heightened somewhat,” but reiterated that the BoJ wants to await “a bit more data” before considering another rate hike. He emphasized the need to observe whether firms continue to raise wages in response to higher U.S. tariffs before committing to further tightening. Overall, the latest inflation data and BoJ remarks reinforce expectations that the next rate hike remains a coin toss between December and January.
Japan's industrial production rises 2.2% mom in September, indecisive fluctuation continues
Japan’s industrial production rose 2.2% mom in September, beating expectations of 1.6% and marking the first increase in three months. However, the Ministry of Economy, Trade and Industry kept its assessment unchanged, describing output as “fluctuating indecisively,” highlighting that the recovery remains fragile.
According to METI’s survey, manufacturers expect production to grow 1.9% mom in October but shrink -0.9% in November, pointing to continued short-term volatility.
Gains in September were broad-based, with 13 of 15 industrial sectors expanding. Notably, production machinery output surged 6.2% mom, driven by strong shipments of semiconductor manufacturing equipment to China and Taiwan. In contrast, transport equipment (excluding motor vehicles) and steel and non-ferrous metals recorded modest declines.
Meanwhile, retail sales rose 0.5% yoy, missing expectations of 0.7%, reflecting soft consumer demand despite improving wage and price trends.
China NBS Manufacturing PMI falls to 49 in October, contraction deepens
China’s official manufacturing PMI fell from 49.8 to 49.0 in October, missing expectations of 49.7 and marking the lowest reading in six months. The sector has now been in contraction since April. The new orders index dropped to 48.8 from 49.7, while the production sub-index declined sharply to 49.7 from 51.9, pointing to a broad slowdown in both output and demand.
NBS chief statistician Huo Lihui attributed the weaker reading to “the early release of some demand before the National Day holiday” and a “more complex international environment” that continues to weigh on activity.
Outside the factory sector, Non-Manufacturing PMI edged up slightly to 50.1 from 50.0, though it also missed forecasts of 50.2. As a result, the Composite PMI, which combines manufacturing and services, slipped to 50.0 from 50.6.
GBP/USD Mid-Day Outlook
Daily Pivots: (S1) 1.3105; (P) 1.3162; (R1) 1.3207; More...
GBP/USD's decline continues today and the break of 1.3140 cluster (38.2% retracement of 1.2099 to 1.3787 at 1.3142) now suggests that a double top pattern (1.3787/3725) was already in place. Intraday bias stays on the downside for 61.8% retracement at 1.2744 next. On the upside break of 1.3247 support turned resistance is needed to indicate short term bottoming. Otherwise, risk will stay on the downside in case of recovery.
In the bigger picture, rise from 1.0351 (2022 low) is still seen as a corrective move. Sustained trading below 55 W EMA (now at 1.3191) will argue that a medium term top has already formed and bring deeper fall back to 1.2099. Firm break there will confirm bearish reversal. In case of another rise, strong resistance should emerge below 1.4248 (2021 high) to cap upside.
Fed’s Schmi: Cutting now won’t fix labor issues, may damage credibility
Kansas City Fed President Jeffrey Schmid offered a firm defense of his decision to oppose this week’s quarter-point rate cut, arguing that the U.S. economy remains resilient and inflation too high to justify further policy easing.
In a statement, Schmid said the labor market is “largely in balance”, the economy continues to show “momentum,” and policy remains “only modestly restrictive.” On that basis, he judged it appropriate to hold rates steady at this week’s meeting.
Schmid emphasized that monetary policy should continue to “lean against demand growth” to give supply room to expand and relieve price pressures.
The Kansas City Fed chief also highlighted the uneven effects of monetary policy on the Fed’s dual mandate. He noted that current labor market stresses are more structural, driven by technology and demographics, rather than cyclical weakness that rate cuts could effectively address. As such, he questioned the utility of further easing to support employment at this stage.
On the other hand, Schmid warned that even small rate reductions could have “longer-lasting effects on inflation” if markets begin to doubt the Fed’s commitment to its 2% target.
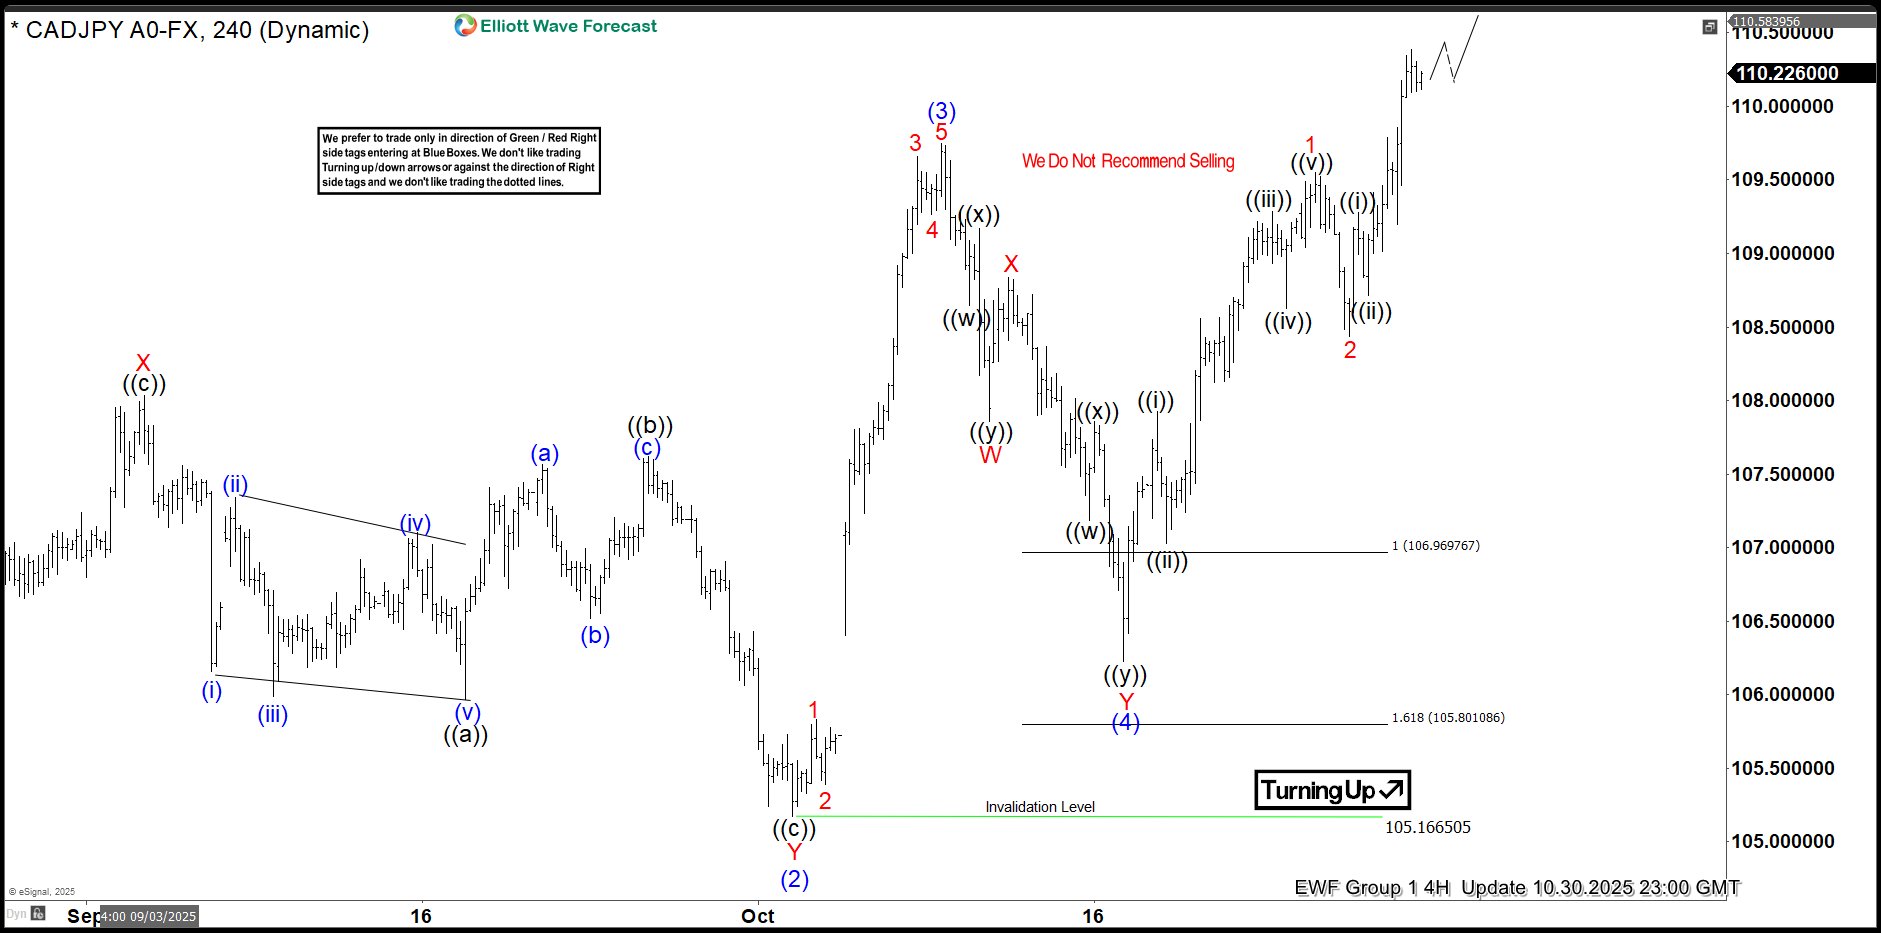
CADJPY Elliott Wave : Calling the Rally From the Extreme Zone
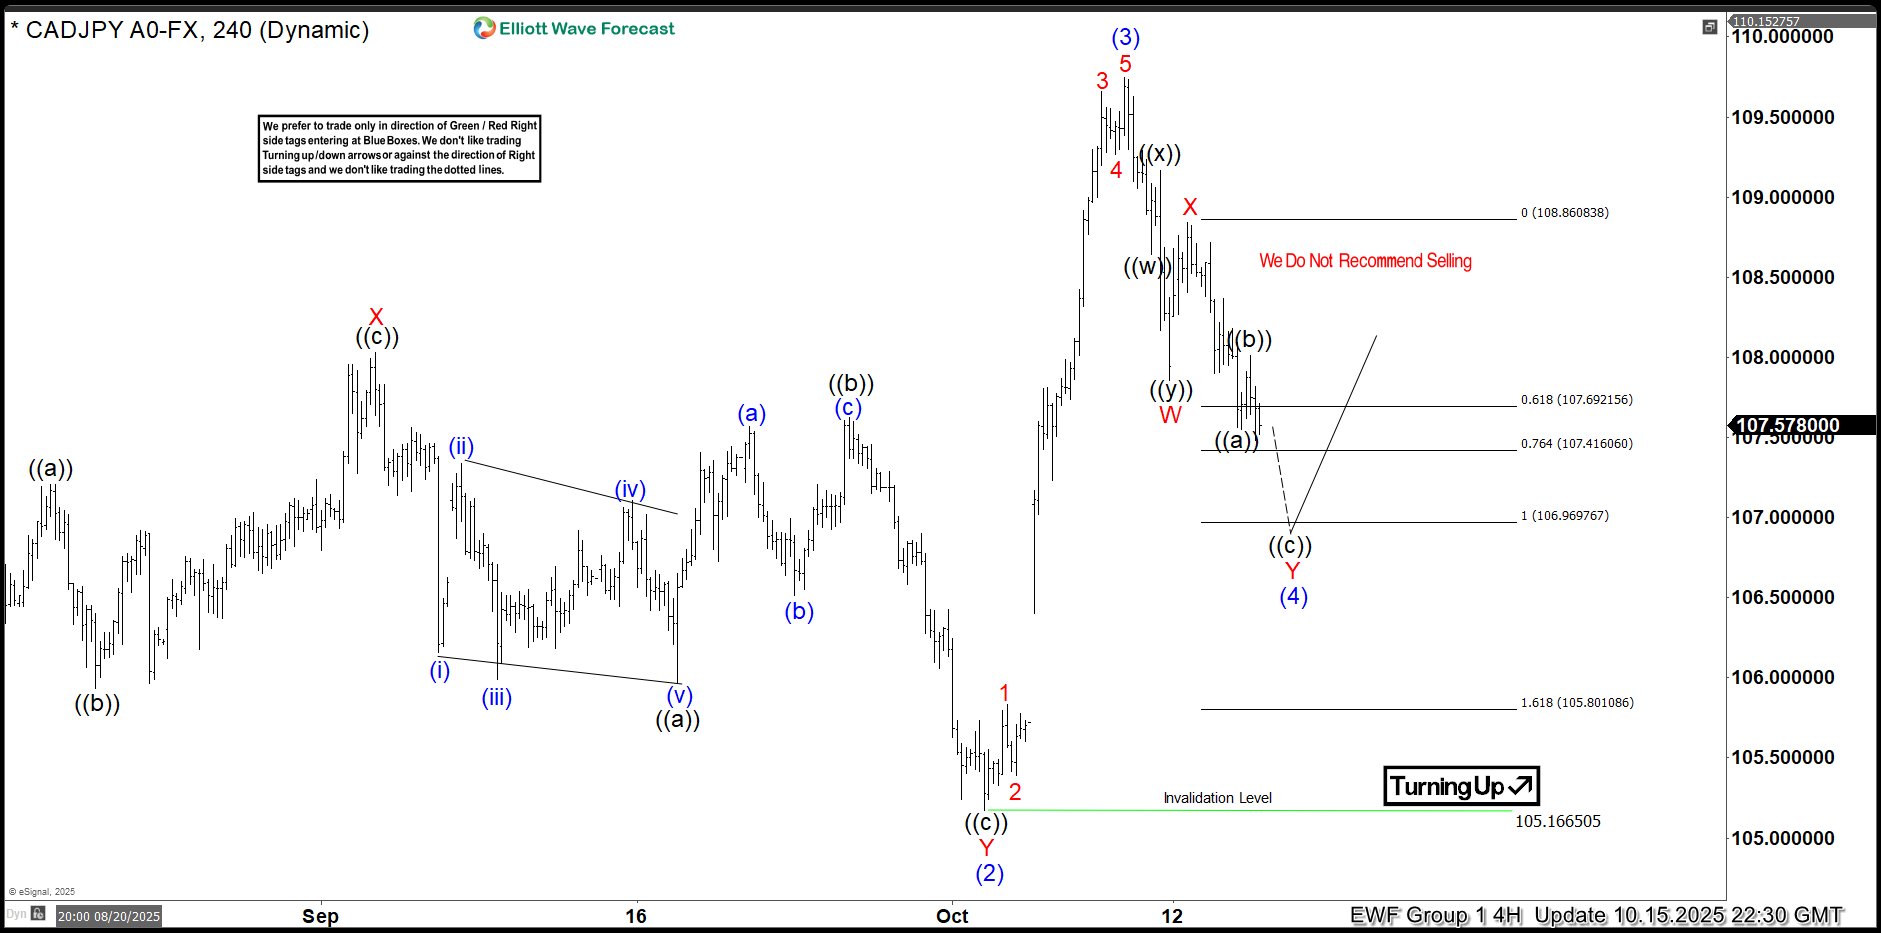
Hello fellow traders. In this technical article we’re going to take a look at the Elliott Wave charts charts of CADJPY Forex pair published in members area of the website. As our members know CADJPY is bullish against the 105.166 pivot and we prefer the long side. Recently the pair made a clear three-wave correction. The pull back completed as Elliott Wave Double Three pattern and made rally as expected. In this discussion, we’ll break down the Elliott Wave pattern and forecast.
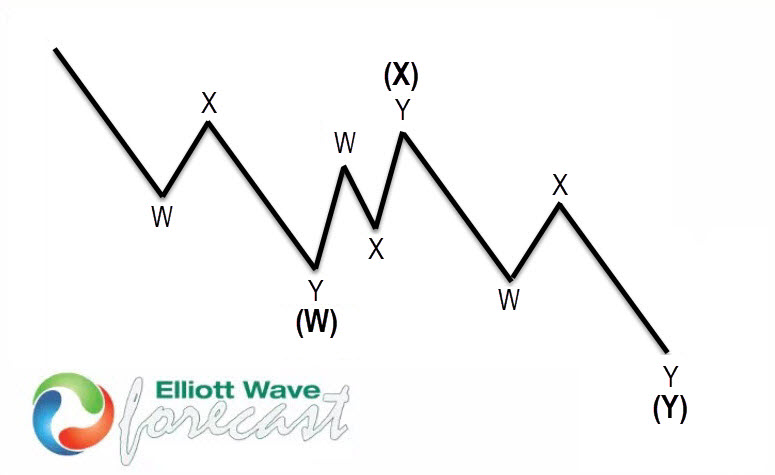
Elliott Wave Double Three Pattern
Double three is the common pattern in the market , also known as 7 swing structure. It’s a reliable pattern which is giving us good trading entries with clearly defined invalidation levels.
The picture below presents what Elliott Wave Double Three pattern looks like. It has (W),(X),(Y) labeling and 3,3,3 inner structure, which means all of these 3 legs are corrective sequences. Each (W) and (Y) are made of 3 swings , they’re having A,B,C structure in lower degree, or alternatively they can have W,X,Y labeling.
CADJPY Elliott Wave 4 Hour Chart 10.15.2025
CADJPY is forming a pullback against the 105.166 low. The correction remains incomplete at this time. The first leg shows a clear 3-wave structure ((w))–((x))–((y)) in black, followed by a 3-wave bounce in the red X leg. We expect to see another leg lower to complete the 3-wave pattern within the red Y leg as well. We advise against selling $CADJPY and instead favor the long side.
CADJPY Elliott Wave 4 Hour Chart 10.30.2025
CADJPY found buyers as expected. The forex pair has reacted strongly and eventually we got a break toward new highs. Now, intraday pull backs should ideally keep finding buyers as far as 106.195 pivot holds.
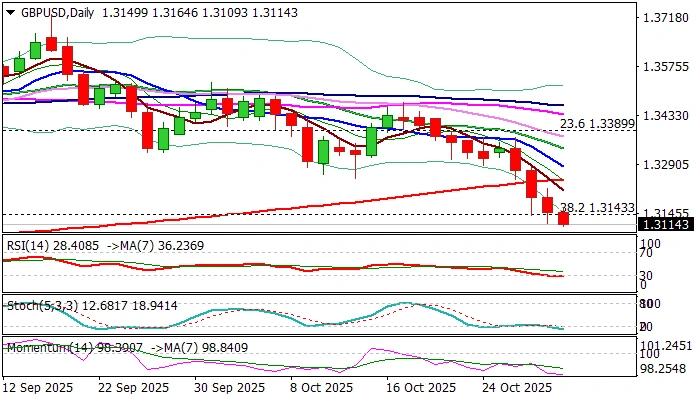
GBP/USD: Steep Decline Extends Through Key Support Zone
Cable extends steep fall into fourth straight day and probes through key supports at 1.3140 zone (Fibo 38.2% of 1.2099/1.3788 rally / former higher base, consisting of May 11 and July 27 lows), hitting the lowest levels since mid-April.
Stronger dollar after Fed’s hawkish cut and fresh signals that BOE rate cut next week cannot be ruled out (against wide expectations to stay on hold), keep sterling under increased pressure.
Daily MA’s turned to full bearish setup (latest formation of 5/200DMA death cross adds to negative signals), while bearish momentum remains strong, adding to negative fundamentals and weak near-term outlook.
The pair is on track for the second consecutive weekly loss (bears also accelerated this week) and about to end month in red (monthly loss of 2.4%) contributing to signals of reversal pattern developing on weekly and monthly chart (firm break of 1.3140 supports to complete bearish failure swing pattern).
Bears eye immediate targets at 1.3100 (round-figure) and 1.3078 (55WMA) the last significant obstacles en-route towards psychological 1.30 support.
Meanwhile, price adjustments on oversold studies should be anticipated.
Broken 200DMA (1.3246) reverted to solid resistance which should ideally cap upticks.
Res: 1.3140; 1.3213; 1.3246; 1.3282.
Sup: 1.3100; 1.3078; 1.3000; 1.2944.
Canada GDP shrinks -0.3% mom in August, broad-based weakness offsets September rebound hopes
Canada’s economy contracted -0.3% mom in August, a much steeper decline than the expected flat reading, highlighting broad-based weakness across both goods and services sectors.
According to Statistics Canada, goods-producing industries fell -0.6%, marking the fifth contraction this year. Services-producing industries slipped -0.1%, the first decline in six months. The data reinforce concerns that Canada’s growth momentum remains fragile amid trade headwinds and domestic softness.
Looking ahead, advance estimates suggest GDP rose 0.1% mom in September, offering a modest sign of stabilization. Gains in finance, insurance, mining, oil and gas extraction, and manufacturing were partly offset by declines in wholesale and retail trade.
Nasdaq 100: Short-Term Bullish Trend Remains Intact Despite a Less Dovish Powell
Key takeaways
- Nasdaq 100 uptrend intact: Despite a 1.5% pullback led by Meta on rising AI capex, the index remains supported above key short-term levels of 25,745–25,800.
- Treasury volatility supports equities: Compressed U.S. Treasury volatility, reflected in the MOVE Index, continues to reinforce risk-on sentiment and short-term equity momentum.
- Tech earnings drive futures rebound: Strong after-hours results from Apple and Amazon lifted Nasdaq futures, while technical signals, including an hourly RSI breakout, point to continued short-term upside.
The US stock market retreated for a second straight session on Thursday, 30 October 2025, led by the Nasdaq 100’s 1.5% drop after Meta’s sharp selloff (-11.3%) on rising AI-related capex.
In addition, Fed Chair Powell’s pushback against expectations of another near-term rate cut during his post-FOMC press conference drove the U.S. dollar to a three-month high and lifted longer-term US Treasury yields. The 10-year US Treasury jumped by 10 basis points (bps) from Tuesday, 28 October (before this week’s FOMC meeting) to 4.1% on Friday, 31 October at the time of writing
Despite the dip, major indices held key support levels, while US futures rebounded in after-hours trading and in today’s Asia session on strong Apple and Amazon Q3 earnings and guidance.
We will examine a key macro intermarket relationship and highlight several positive technical factors that reinforce the Nasdaq 100’s ongoing short-term uptrend.
The implied volatility of US Treasury yields remained compressed
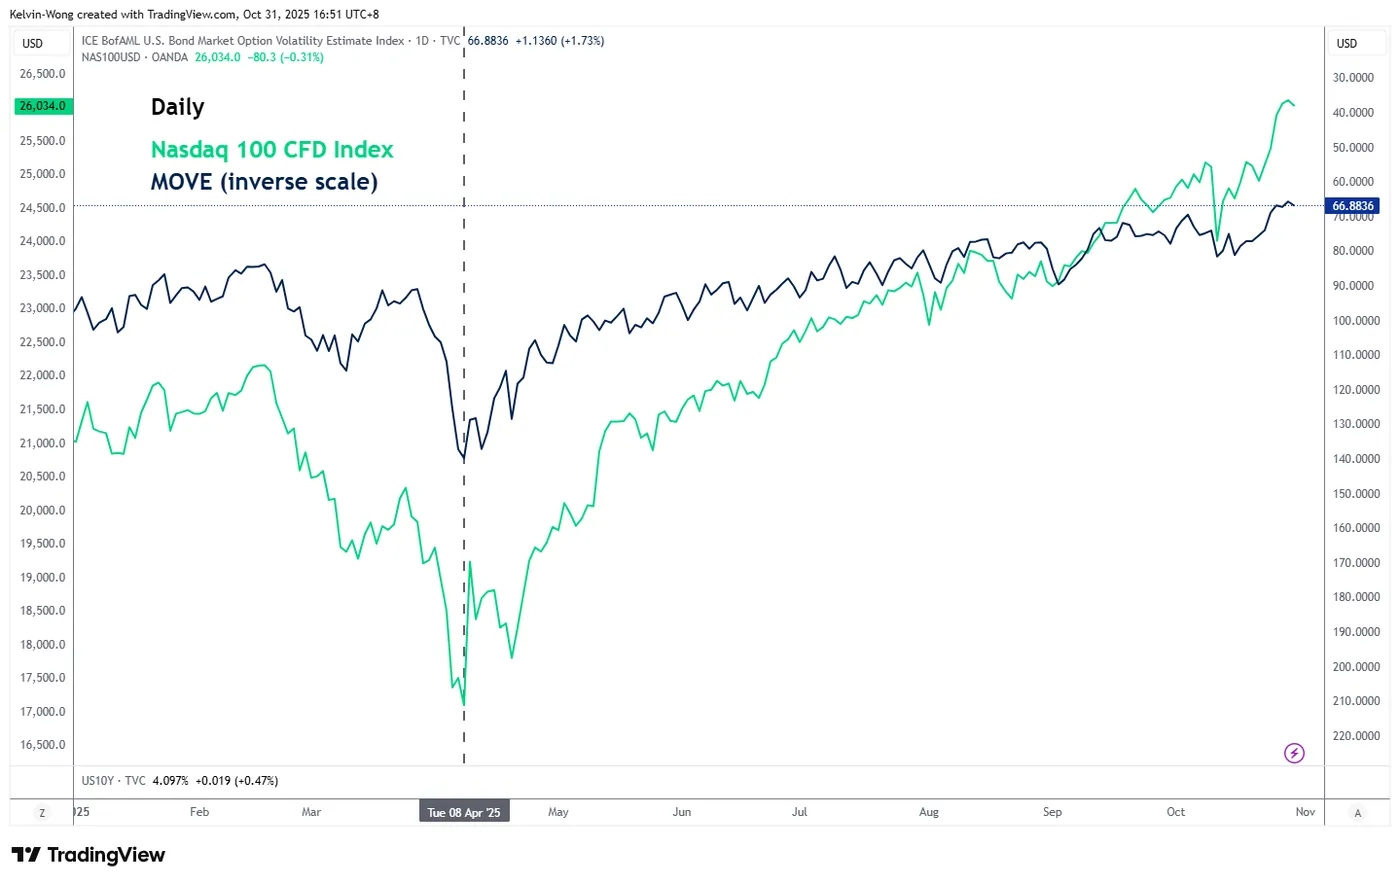
Fig. 1: MOVE Index & US Nasdaq 100 CFD Index medium-term trends as of 30 Oct 2025 (Source: TradingView)
The “Merrill Lynch Option Volatility Estimate”, the MOVE Index in short form, tracks the volatility of US Treasury yields implied by current prices of one-month OTC options.
Since the aftermath of the U.S. “Liberation Day” reciprocal tariffs on 8 April 2025, the inverse of the MOVE Index has tracked the Nasdaq 100 in near lockstep, highlighting how declining bond market volatility has supported risk-on sentiment and reinforced short-term equity momentum.
Therefore, it is the volatility of U.S. Treasury yields, rather than the absolute changes in their levels, that drives the dynamics of the US stock indices (see Fig. 1).
Interestingly, the MOVE Index closed at a lower level of 66.88 on Thursday, 30 October, down from 68.94 the previous Thursday, 23 October (inverse scale shown in Fig. 1).
Let’s now break down the latest technical analysis elements, short-term trajectory (1 to 3 days), and relevant short-term key levels to watch for the US Nasdaq 100 CFD Index (a proxy of the Nasdaq 100 futures).
Preferred trend bias (1-3 days) – Oscillating within a minor ascending channel
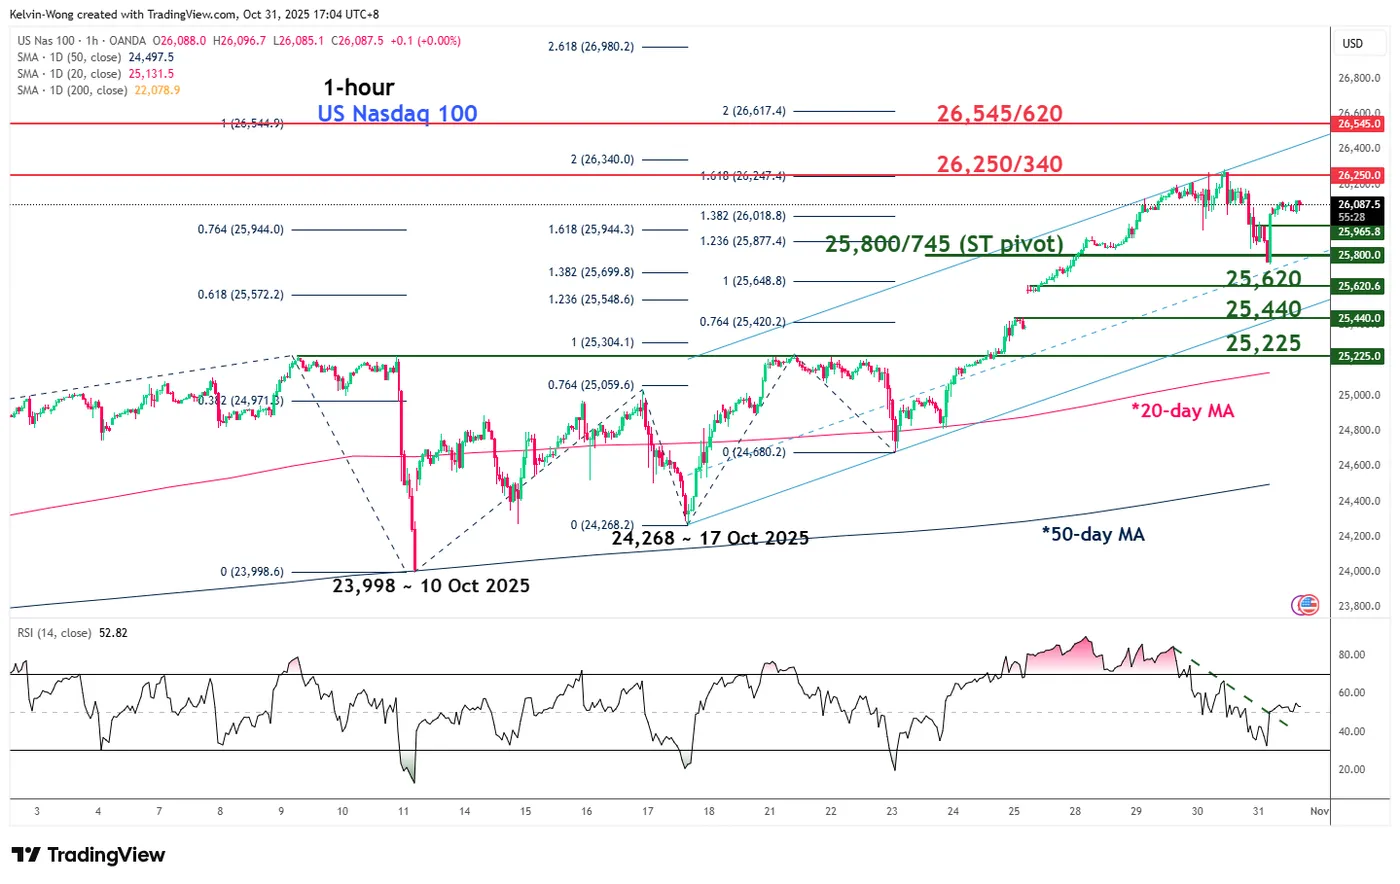
Fig. 2: US Nasdaq 100 CFD Index minor trend as of 31 Oct 2025 (Source: TradingView)
Watch the 25,800/25,745 key short-term pivotal support on the US Nasdaq 100 CFD Index to maintain its current minor/short-term uptrend phase in place since 10 October 2025 (see Fig. 2).
A clearance above the 26,340 near-term resistance sees the next resistance coming in at 26,545/26,620 (ascending channel top and Fibonacci extension cluster).
Key elements
- The 25,800/25,745 key short-term support confluences with the 23.6% Fibonacci retracement of the current impulsive up move sequence from 17 October 2025 low to 30 October 2025 current all-time high.
- The hourly RSI momentum indicator has staged a bullish breakout from its prior descending resistance and surpassed the 50 level. These observations suggest a potential resurgence of short-term bullish momentum for the US Nasdaq 100 CFD Index.
Alternative trend bias (1 to 3 days)
A break below the 25,745 key short-term support on the US Nasdaq 100 CFD Index negates the bullish tone for an extension of the minor corrective decline sequence to expose the next intermediate supports at 25,620 and 25,440 (minor ascending channel bottom and a gap up formed on Monday, 27 October 2025).