
Sample Category Title
Fed’s Goolsbee cautions against front-loaded cuts, undecided with December
Chicago Fed President Austan Goolsbee said he remains uneasy about the idea of front-loading rate cuts, citing persistent inflation pressures and an uncertain growth backdrop. Speaking with Yahoo Finance, Goolsbee admitted he is “not decided” going into the December meeting, emphasizing that inflation remains “above target for four and a half years and trending the wrong way.” .
Goolsbee added that the threshold for cutting rates is now higher than at prior meetings. While he acknowledged that interest rates should ultimately fall alongside inflation, he expects them to settle “a fair bit below current levels” only once inflation shows sustained progress toward 2%. His stance aligns with other centrist officials who are reluctant to accelerate rate cuts amid mixed economic signals.
On the labor market, Goolsbee described an unusual environment of “low hiring” and “low firing,” calling the hiring rate one of the economy’s weakest points. Despite slower job creation, he noted that broader employment indicators remain stable.
ISM Manufacturing Index Shows Eighth Consecutive Month of Contraction
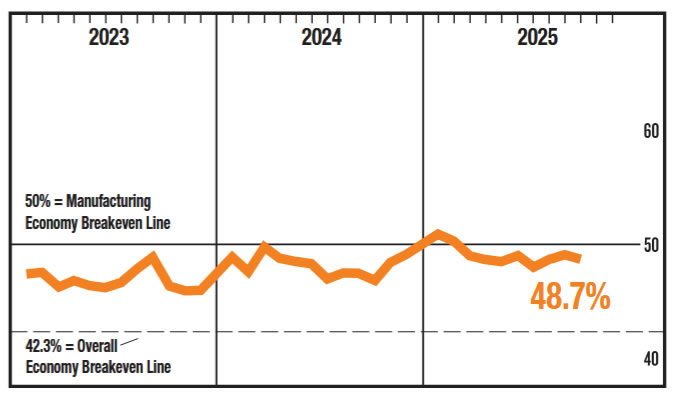
The ISM Manufacturing Index fell to 48.7 in October, reversing September's increase and returning to the level we saw in August.
Six of 18 industries reported growth last month, up from five in September. But it was smaller industries that reported growth this month, accounting for only 58% of manufacturing GDP compared to 70% last month.
Demand conditions improved in October. New orders, new export orders, backlog of orders, and customers inventories all improved, but remain in contractionary territory.
The production index declined to 48.2 in October after spiking up to 51.0 in September, close to the 47.8 it had registered in August, making its time in expansionary territory short-lived.
Price gains decelerated again in October, coming in at 58.0 vs. 61.9 in August. Prices are still increasing, but at a slower rate.
Key Implications
Although manufacturing activity contracted at a faster pace in October, there are some welcome signs in this report. All the demand indicators improved, albeit remaining very weak, and the price index remains elevated, but eased. On the supply side, while production and employment indexes both declined, the low reading on customers' inventories is usually a sign of future production increases, which could be positive for manufacturing output in future months if demand indicators continue to improve. The moderation in the price index adds to the case for the Federal Reserve to reduce interest rates again, and carries added importance given that it seems October CPI is unlikely to be released anytime soon due to the government shutdown.
Survey respondents continue to report substantial struggles with adjusting to tariffs, in addition to weak demand conditions. Some respondents identify added costs from tariffs, volatility in prices of their imports, and a lack of success in attempts to reshore production. Some respondents also noted that tariffs are driving up their prices, but it is either not possible to source their imported inputs domestically or it is still cost effective to import, leading to cost and price increases. These are all factors that make it difficult to increase capacity or expand.
Sunset Market Commentary
Markets
Last week’s ECB and even more Fed policy decisions helped to put a floor for EMU and US yields and this pattern still was the ‘by-default bias’ at the start of this week. Admittedly, the filtering-through of (mainly German) fiscal intentions to support growth develops at slower pace than hoped for. Even so, the 0.2% Q/Q EMU Q3 growth didn’t call for ECB support anytime soon and confirms the view that downside risks to growth have diminished. At the same time, inflation has landed close to the 2% target. In this context, Slovak ECB member Kazimir warned against ‘over-engineering‘ and fine-tuning the inflation dynamics to perfection. In doing so, the ECB at some point risks becoming a source of volatility rather than stability. German yields in technical trading today at 2-3 bps across the curve. Markets again see a <50% probability of a potential ‘fine-finetuning’ rate cut somewhere next year. Last week’s hawkish/no-consensus-driven Fed rate cut also still helps US yields cautiously higher from the support levels tested before the Fed decision. The 2-y yield (3.60%) left the 3.50% area. The 10-y yield (4.11%) again settles well north of 4%. US yields in a slight steepening move are rising further between 3 bps (2-y) and 3.2 bps (30-y). Some analyses also question whether heavy issuance for tech majors to finance AI related investments at some point by become a competitor for US Treasuries. At the moment of finishing this report, the US manufacturing ISM at 48.7 (from 49.1) printed slightly softer than expected (49.5). Subindices were mixed with prices also slightly softer than expected (58 from 61.9) but employment and new orders marginally better. The impact on markets remains limited for now. This weekend’s OPEC+ decision to continue with a small 137k b/d production hike in December before shifting to a pause in Q1 next year, had little impact on the oil price (and on broader markets, including inflation expectations). Brent oil even eases slightly today ($ 64.7 p/b). For equities the ‘by-default’ bias remains to hover near recent top levels even as momentum isn’t really that convincing anymore (EuroStoxx 50 +0.3%, Nasdaq +0.7%).
Section three of the ‘buy-default-continuation trade’ applies to the US dollar. An ‘a bit higher, probably for a bit longer’ US interest rate scenario, a lack of outright positive eco news from other major economies (Japan, EMU, China, Europe, the UK) and a feeling that the risk rally might have run the easiest part of its course still support the greenback. DXY (99.95) is only a whisker away from the 100 barrier with the early August top at 101.25. EUR/USD dropped below the 1.1542 October low, accelerating losses to 1.1515. After substantial losses last week, sterling started the week in more of a wait-and-see modus ahead of Thursday’s BoE policy decision. EUR/GBP (0.877) at least didn’t push any further on last week’s attempt to break the 0.88 barrier. We stay cautious on sterling. An unexpected BoE rate cut probably won’t help the UK currency. However, is the BoE holding rates unchanged as it sees it hands tied by too high inflation better news for sterling? In CE, the forint near EUR/HUF 386.7 touched the strongest level against the euro since end May last year.
News & Views
Swiss consumer prices fell by 0.3% m/m in October, more than the -0.1% expected and deepening from September’s -0.2%. Annual inflation missed the 0.3% consensus estimate as well by coming in at a mere 0.1%. The Federal Statistical Office singled out several factors to explain the price drop, including lower prices for hotels and international package holidays and for the hire of private means of transport. Clothing & footwear, housing maintenance and caretaking, by contrast, recorded a price increases. Core inflation unexpectedly slowed as well, from 0.7% to 0.5%. The Swiss franc weakened to its lowest level in around three weeks. EUR/CHF at 0.93 remains historically strong though. Bets for another rate cut by the Swiss National Bank are gradually building meanwhile. That would bring the policy rate back, currently 0%, into negative territory. It remains nothing but a tail risk so far. Swiss policymakers including SNB chair Schlegel have signaled a high bar for going negative again.
The Czech ANO party, which won the most votes in October’s election but fell short of a majority, has signed a coalition agreement today with the Motorists and the Freedom and Direct Democracy (SPD). The former is a Eurosceptic movement which campaigned against the EU’s climate goals and the latter is considered an anti-immigrant party, making the agreement a consolidation of the rightwing populist bloc. The stage is now set for ANO’s leader Babis to return as prime minister. A preliminary outline of the program manifesto included a cap to the retirement age at 65 and a pledge to stick to the koruna throughout their term.
US ISM manufacturing falls to 48.7, output and prices cool
U.S. manufacturing activity weakened further in October, with ISM Manufacturing PMI falling to 48.7 from 49.1, missing expectations of 49.4. The index signaled contraction for the eighth straight month as demand and output remained under pressure.
New orders improved slightly from 48.9 to 49.4 but stayed below the 50 threshold. Production dropped sharply from 51.0 to 48.2 — a clear sign that momentum across the industrial sector remains soft.
The employment component edged up to 46.0 from 45.3 but continued to signal job losses for a ninth consecutive month. Meanwhile, price pressures eased, with the prices-paid index falling from 61.9 to 58.0, suggesting that input costs are stabilizing even as demand remains sluggish.
According to ISM, the latest PMI reading corresponds to an annualized GDP growth rate of about 1.8%.
USD/JPY Mid-Day Outlook
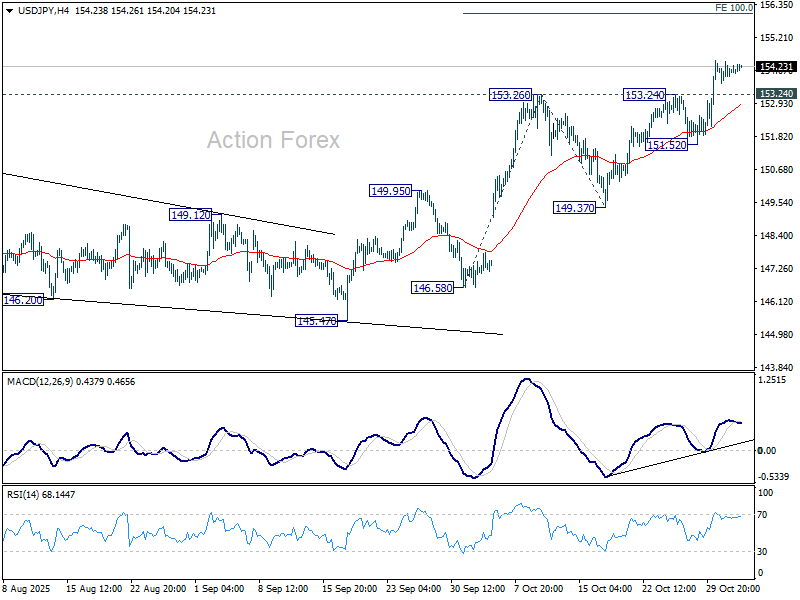
Daily Pivots: (S1) 153.64; (P) 154.03; (R1) 154.39; More...
No change in USD/JPY's outlook and intraday bias stays on the upside for upside for 100% projection of 146.58 to 153.26 from 149.37 at 156.05. Firm break there will extend the rally from 139.87 to 158.86 resistance next. On the downside, below 153.24 resistance turned support will turn intraday bias neutral first. But outlook will stay bullish as long as 151.52 support holds, in case of retreat.
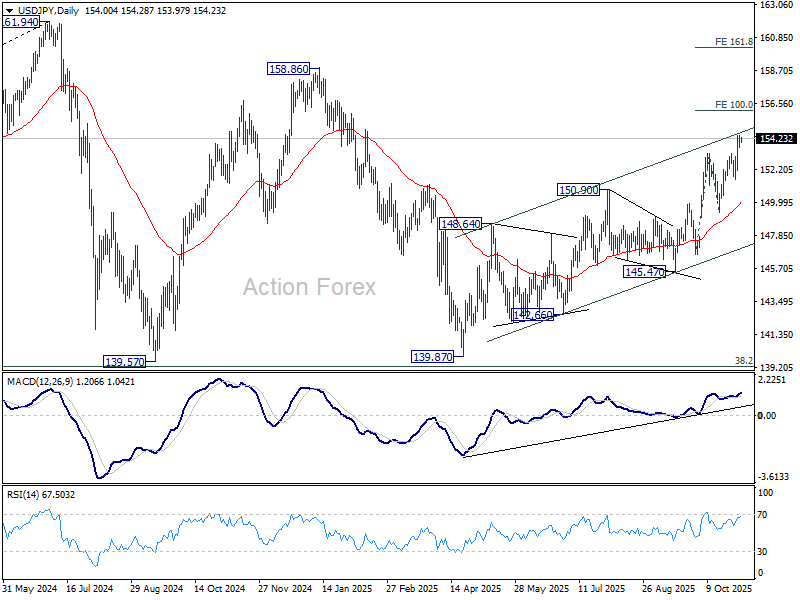
In the bigger picture, current development suggests that corrective pattern from 161.94 (2024 high) has completed with three waves at 139.87. Larger up trend from 102.58 (2021 low) could be ready to resume through 161.94 high. On the downside, break of 145.47 support will dampen this bullish view and extend the corrective pattern with another falling leg.
USD/CHF Mid-Day Outlook
Daily Pivots: (S1) 0.8019; (P) 0.8037; (R1) 0.8064; More…
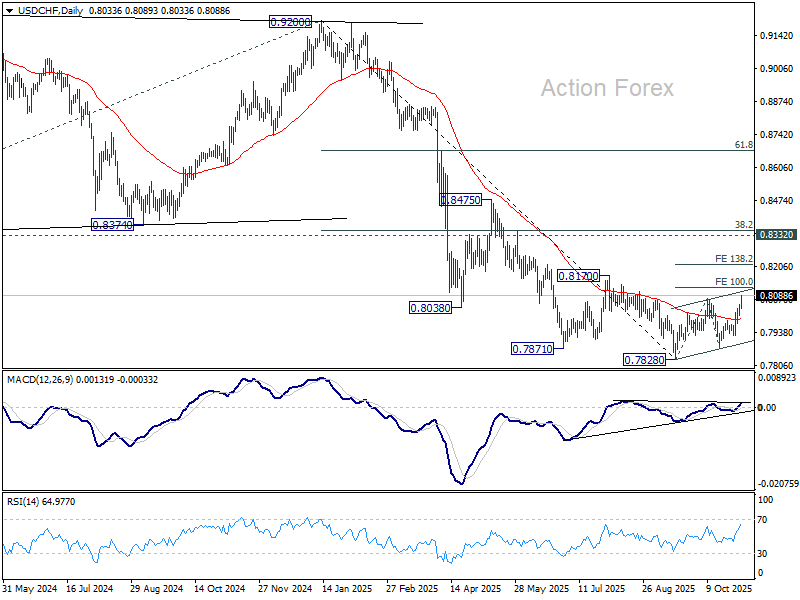
USD/CHF's rally continues today and intraday bias stays on the upside. Corrective pattern from 0.7828 is in the third leg. Next target is 100% projection of 0.7828 to 0.8075 from 0.7872 at 0.8119. Break there will target 138.2% projections at 0.8213. On the downside, below 0.8033 minor support will turn intraday bias neutral.
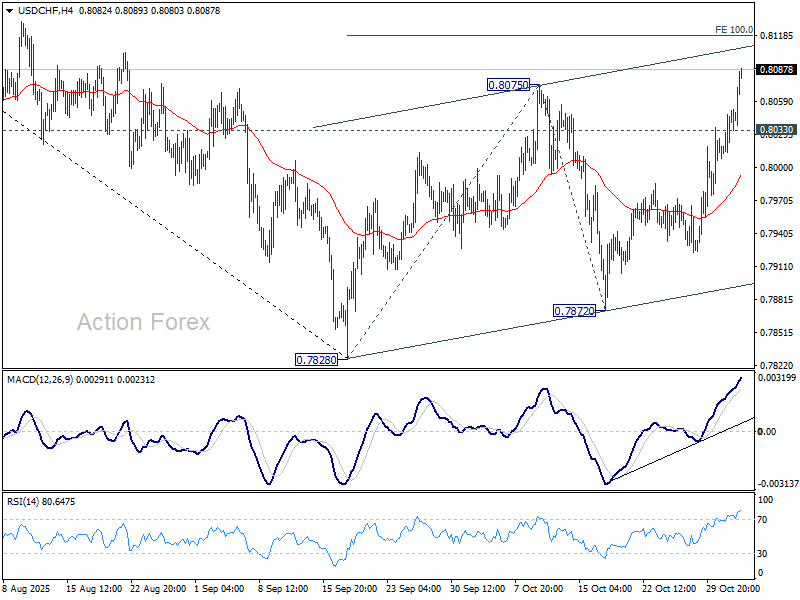
In the bigger picture, long term down trend from 1.0342 (2017 high) is still in progress. Next target is 100% projection of 1.0146 (2022 high) to 0.8332 from 0.9200 at 0.7382. In any case, outlook will stay bearish as long as 0.8332 support turned resistance holds (2023 low).
GBP/USD Mid-Day Outlook
Daily Pivots: (S1) 1.3106; (P) 1.3136; (R1) 1.3174; More...
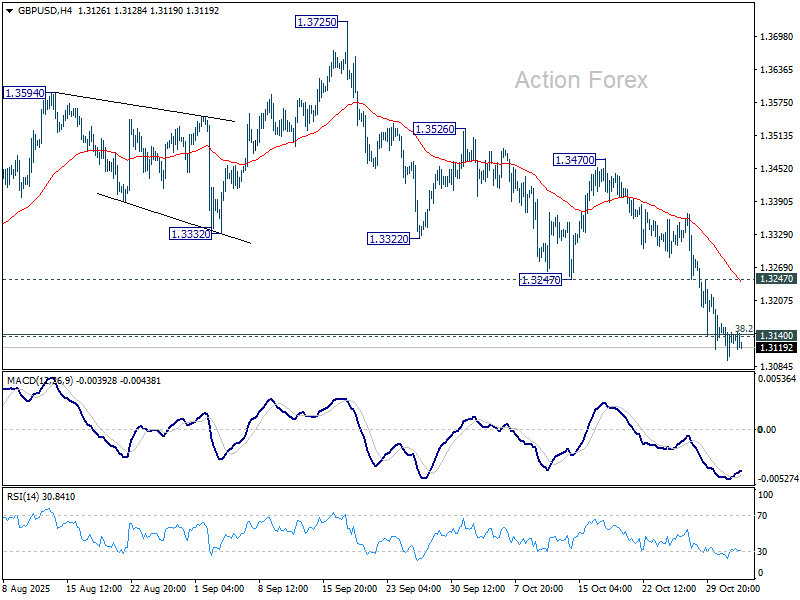
No change in GBP/USD's outlook and intraday bias stays on the downside. Sustained trading below 1.3140 support should confirm completion of double top pattern (1.3787, 1.3725). Further decline should then be seen to 61.8% retracement of 1.2099 to 1.3787 at 1.2744 next. On the upside break of 1.3247 support turned resistance is needed to indicate short term bottoming. Otherwise, risk will stay on the downside in case of recovery.
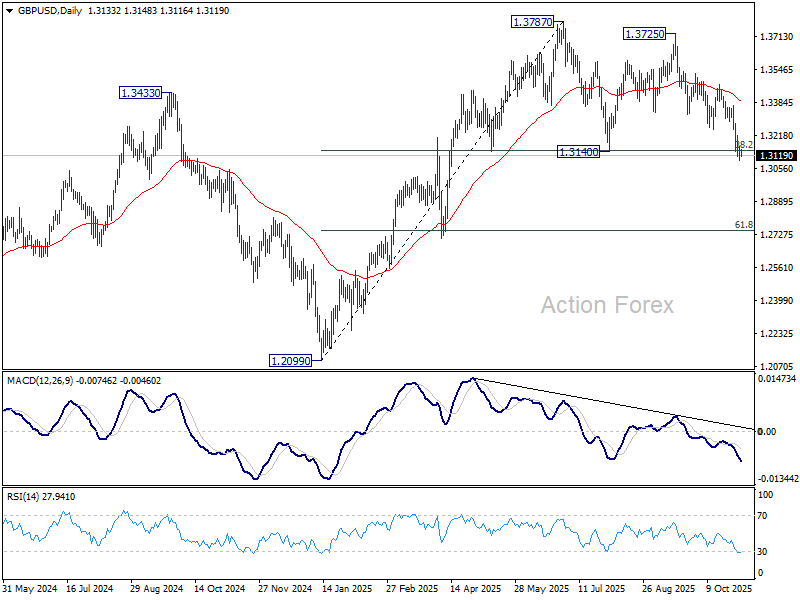
In the bigger picture, rise from 1.0351 (2022 low) is still seen as a corrective move. Sustained trading below 55 W EMA (now at 1.3185) will argue that a medium term top has already formed and bring deeper fall back to 1.2099. Firm break there will confirm bearish reversal. In case of another rise, strong resistance should emerge below 1.4248 (2021 high) to cap upside.
EUR/USD Mid-Day Outlook
Daily Pivots: (S1) 1.1513; (P) 1.1545; (R1) 1.1569; More…
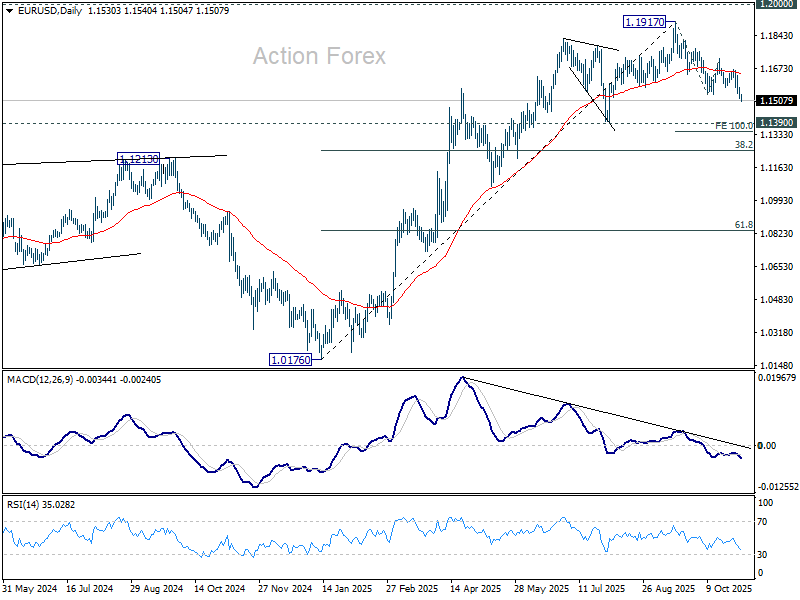
EUR/USD's fall from 1.1917 continues today and 4H MACD suggests that downside momentum remains firm. Intraday bias stays on the downside for 100% projection of 1.1917 to 1.1540 from 1.1727 at 1.1350. Decisive break there would prompt downside acceleration to 38.2% retracement of 1.0176 to 1.1917 at 1.1252. On the upside, above 1.1576 minor resistance will turn bias neutral and bring consolidations first, before staging another fall.
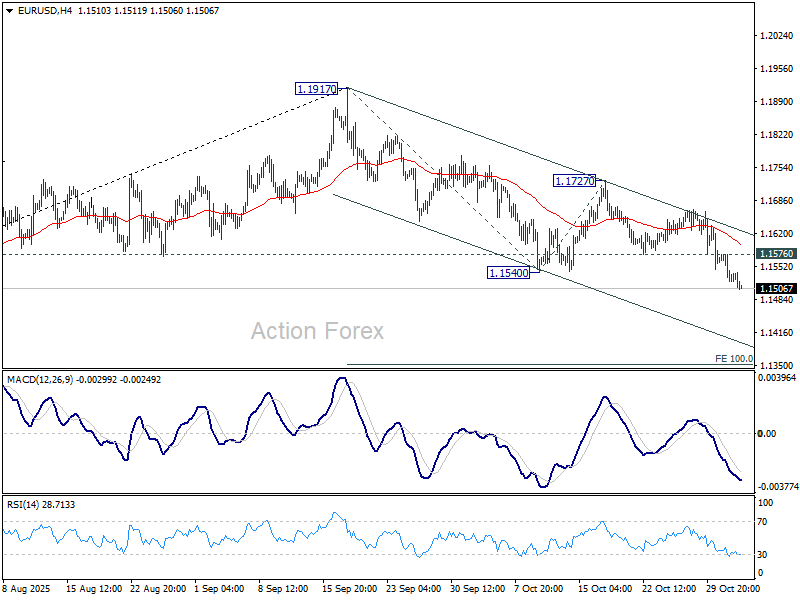
In the bigger picture, considering bearish divergence condition in D MACD, a medium term top is likely in place at 1.1917, just ahead of 1.2 key psychological level. As long as 55 W EMA (now at 1.1306) holds, the up trend from 0.9534 (2022 low) is still expected to continue. Decisive break of 1.2000 will carry larger bullish implications. However, sustained trading below 55 W EMA will argue that rise from 0.9534 has completed as a three wave corrective bounce, and keep outlook bearish.
Dollar Extends Gains as Markets Dismiss Dovish Fed Remarks, RBA in Focus Next
Dollar climbed across the board today, defying dovish rhetoric from Fed Governor Stephen Miran. The greenback's resilience suggests that Miran's influence on expectations is limited, with investors noting that he represents the dovish edge of a divided policy spectrum.
The broader committee remains split. Kansas City Fed President Jeffrey Schmid argued recently against imminent rate cuts, while Governor Christopher Waller has indicated more openness to easing. With such divergent signals, markets are reluctant to price in aggressive near-term action, instead waiting for the next set of meaningful data.
That makes this week’s private-sector reports — ISM Manufacturing and Services, along with ADP employment — particularly crucial. With the U.S. government still partially shut down and official data releases suspended, traders are relying on these indicators to gauge whether the economy retains its resilience or is slipping under the weight of high rates.
Also, with no consensus emerging, the Fed’s upcoming communications will be heavily scrutinized for any hint of a shift toward a clearer majority view.
In the next Asian session, attention is turning to the RBA’s policy decision. Aussie held firm as markets positioned for a hawkish hold following last week’s stronger-than-expected CPI. All of Australia’s Big Four banks now expect the RBA to remain on hold through year-end, with differing views on when cuts might resume.
ANZ and Westpac see February as a “plausible” but uncertain window, NAB projects a move in the June quarter, while Commonwealth Bank expects no further reductions in the foreseeable future. Bullock’s remarks will likely determine whether markets stick with these cautious timelines or push back expectations further.
In today’s currency markets, Dollar leads the pack, followed by Aussie and Sterling. The Swiss Franc lags behind, with Loonie and Euro also under pressure. Yen and Kiwi sit mid-field.
In Europe, at the time of writing, FTSE is down -0.03%. DAX is up 0.83%. CAC is down -0.09%. UK 10-year yield is up 0.021 at 4.429. Germany 10-year yield is up 0.025 at 2.660. Earlier in Asia, Japan was on holiday. Hong Kong HSI rose 0.97%. China Shanghai SSE rose 0.55%. Singapore Strait Times rose 0.35%.
Fed’s Miran warns policy too tight amid credit market stress
Fed Governor Stephen Miran cautioned that U.S. monetary policy may already be too restrictive, arguing that the neutral rate sits “quite a ways” below the current stance. Speaking with Bloomberg TV, Miran said his relatively sanguine view on inflation suggests there is “no reason for keeping policy as restrictive” .
Miran also highlighted emerging strains in credit markets as a warning sign that policy may have overshot. He noted that “a series of seemingly uncorrelated credit problems” surfacing across sectors indicates financial stress that was previously masked by strong headline data.
“The longer you keep policy restrictive, the more you run the risk that monetary policy itself causes a downturn,” Miran warned.
UK PMI manufacturing finalized at 49.7, Budget may deepen structural strain
UK manufacturing showed tentative signs of life in October, with the final S&P Global PMI rising to 49.7 from September’s 46.2. However, the improvement remains fragile as sluggish demand and stock adjustments drove much of the uptick rather than a sustained pickup in new orders.
Rob Dobson, Director at S&P Global Market Intelligence, said the October survey was encouraging but cautioned that the rebound “could prove short-lived.” Output growth largely stemmed from manufacturers working through backlogs and allowing inventories to build amid weak demand at home and abroad.
Dobson added that upcoming fiscal developments could complicate the outlook further. Many firms worry that the forthcoming Budget may aggravate structural challenges left by last year’s policy tightening, weighing on confidence even as activity improves. Business optimism rose to an eight-month high but remains below its long-run average.
Eurozone PMI manufacturing at 50.0, very delicate sprout of economic recovery
Eurozone manufacturing activity barely expanded in October, with the final HCOB PMI coming in at 50.0, up marginally from 49.8 in September. National readings showed uneven trends: Greece and Spain led with readings above 52, while Germany (49.6) and Italy (49.9) hovered just below the neutral mark. France and Austria remained in contraction, both at 48.8.
Cyrus de la Rubia, Chief Economist at Hamburg Commercial Bank, described the improvement as a “very delicate sprout of economic recovery.” Output has risen for eight consecutive months, but new orders remain stagnant, suggesting that growth lacks momentum. The survey also showed that overall demand across the Eurozone remains subdued, with factories struggling to generate fresh business despite tentative output gains.
The regional breakdown highlights persistent divergence. Germany’s factory sector remains fragile, France’s is in recession, and Italy’s shows only persistent weakness. Meanwhile, Spain’s moderate expansion stands out but offers limited offset. De la Rubia warned that France’s political tensions and renewed production slump are weighing on cross-border demand, acting as a drag on its trading partners and complicating hopes for a broader industrial rebound heading into year-end.
Swiss CPI slows to 0.1% yoy in October, broad decline in prices
Swiss inflation cooled further in October, with headline CPI slipping -0.3% mom — weaker than expectations of -0.1% mom. Annual inflation eased to just 0.1% yoy from 0.2% yoy, undershooting forecasts of 0.3% yoy. The data confirmed that price pressures remain virtually absent.
Core inflation also weakened notably, falling -0.2% mom and slowing to 0.5% yoy from 0.7% yoy. Both domestic and imported prices fell during the month, by -0.2% mom and -0.5% mom respectively, suggesting broad-based softness. The sharper decline in imported prices reflects the strong franc’s continued dampening effect on imported goods and energy costs, while domestic components also showed only marginal resilience.
China RatingDog PMI manufacturing falls to 50.6; export orders and prices decline
China’s manufacturing activity expanded at a slower pace in October, with the RatingDog PMI easing to 50.6 from 51.2, missing expectations of 50.9. The moderation reflects weaker demand momentum and growing headwinds from global trade tensions, which weighed on both output and new export orders.
According to RatingDog founder Yao Yu, both demand and production expansion softened. Export orders fell "sharply into contraction territory" as heightened trade uncertainty curbed overseas demand. Production growth also cooled, though sub-indices remained in expansion territory. Purchasing activity "slowed significantly", signaling greater caution among manufacturers heading into year-end.
Price pressures was a drag on profits, as raw material costs rose while finished goods prices fell. Exporters reduced selling prices for the first time since April to stay competitive amid fragile external demand. Still, the survey offered a bright spot: the employment index returned to expansion for the first time since March, reaching its highest level since August 2023.
EUR/USD Mid-Day Outlook
Daily Pivots: (S1) 1.1513; (P) 1.1545; (R1) 1.1569; More…
EUR/USD's fall from 1.1917 continues today and 4H MACD suggests that downside momentum remains firm. Intraday bias stays on the downside for 100% projection of 1.1917 to 1.1540 from 1.1727 at 1.1350. Decisive break there would prompt downside acceleration to 38.2% retracement of 1.0176 to 1.1917 at 1.1252. On the upside, above 1.1576 minor resistance will turn bias neutral and bring consolidations first, before staging another fall.
In the bigger picture, considering bearish divergence condition in D MACD, a medium term top is likely in place at 1.1917, just ahead of 1.2 key psychological level. As long as 55 W EMA (now at 1.1306) holds, the up trend from 0.9534 (2022 low) is still expected to continue. Decisive break of 1.2000 will carry larger bullish implications. However, sustained trading below 55 W EMA will argue that rise from 0.9534 has completed as a three wave corrective bounce, and keep outlook bearish.