
Sample Category Title
EUR/GBP Daily Outlook
Daily Pivots: (S1) 0.8780; (P) 0.8801; (R1) 0.8837; More…
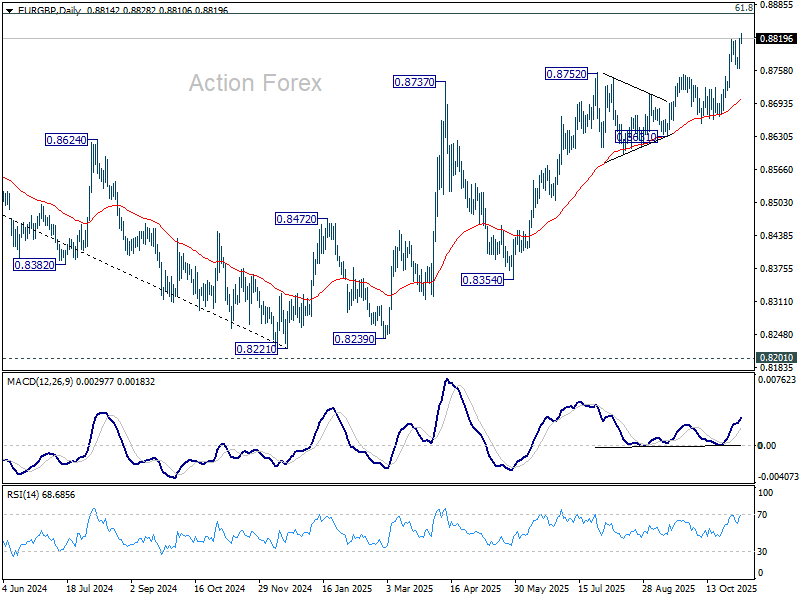
Intraday bias in EUR/GBP is back on the upside with break of 0.8817 temporary top. Next target is 0.8867 fibonacci level. Firm break there will carry larger bullish implications. For now, further rise is expected as long as 0.8761 support holds, in case of retreat.
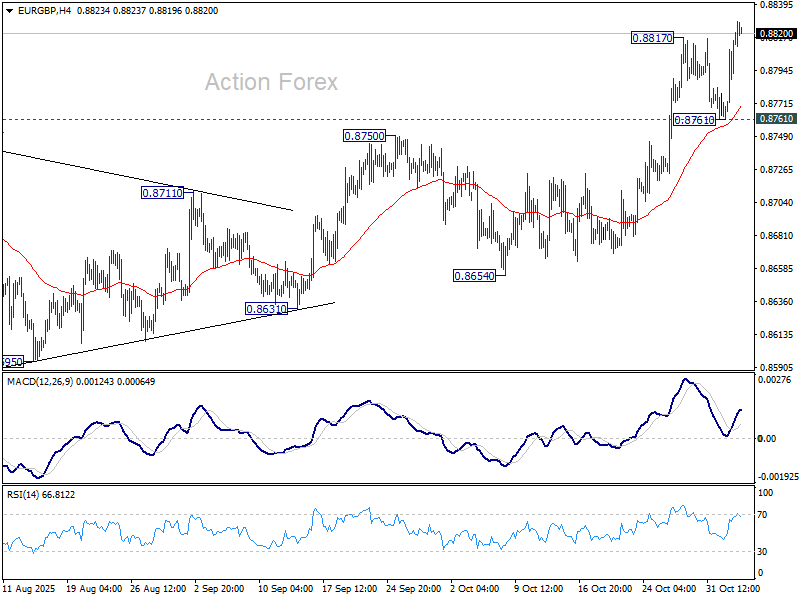
In the bigger picture, rise from 0.8221 medium term bottom is still seen as a corrective move. Upside should be limited by 61.8% retracement of 0.9267 to 0.8221 at 0.8867. Firm break of 0.8654 support will be the first sign that this corrective bounce has completed. However, decisive break of 0.8867 will suggest that EUR/GBP is already reversing whole decline from 0.9267 (2022 high).
EUR/AUD Daily Outlook
Daily Pivots: (S1) 1.7619; (P) 1.7672; (R1) 1.7744; More...
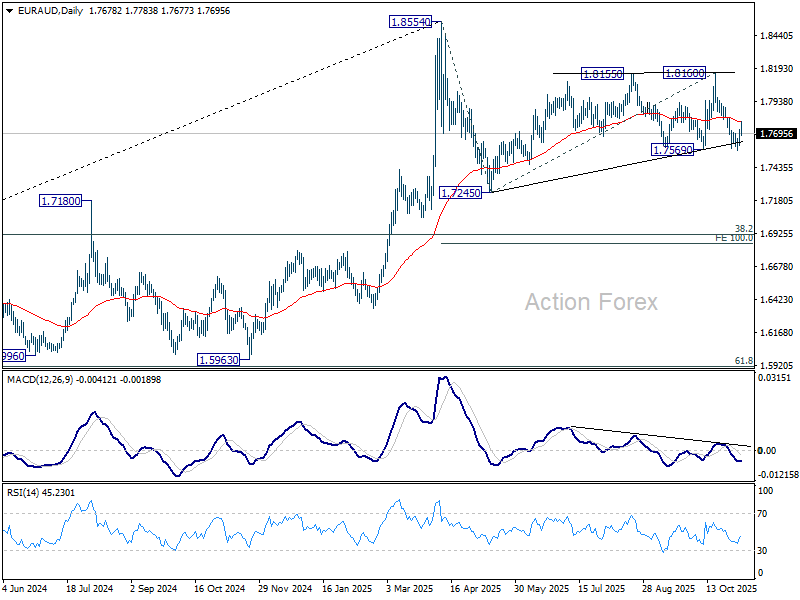
Intraday bias in EUR/AUD remains neutral and further decline is in favor with 1.7813 minor resistance intact. On the downside, decisive break of 1.7569 support solidify the case that corrective pattern from 1.8554 is already in the third leg. Deeper fall should then be seen to 1.7254 support next. However, strong break of 1.7813 will turn bias back to the upside for 1..8160 resistance instead.
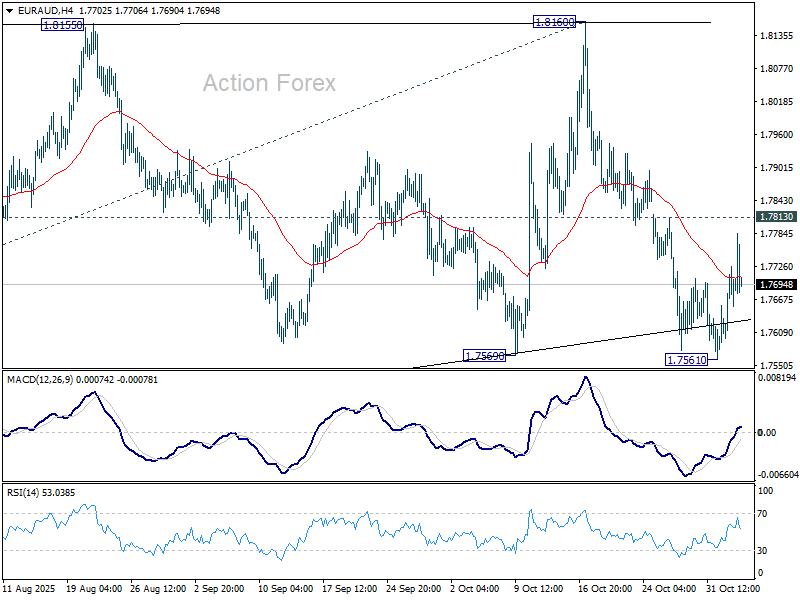
In the bigger picture, price actions from 1.8554 medium term top are seen as a corrective pattern. Sustained break of 55 W EMA (now at 1.7406) will suggest that it's correcting the whole rally from 1.4281 (2022 low). In this case, deeper decline would be seen to 38.2% retracement of 1.4281 to 1.8554 at 1.6922. Nevertheless, strong rebound form 55 W EMA will likely bring resumption of the up trend sooner.
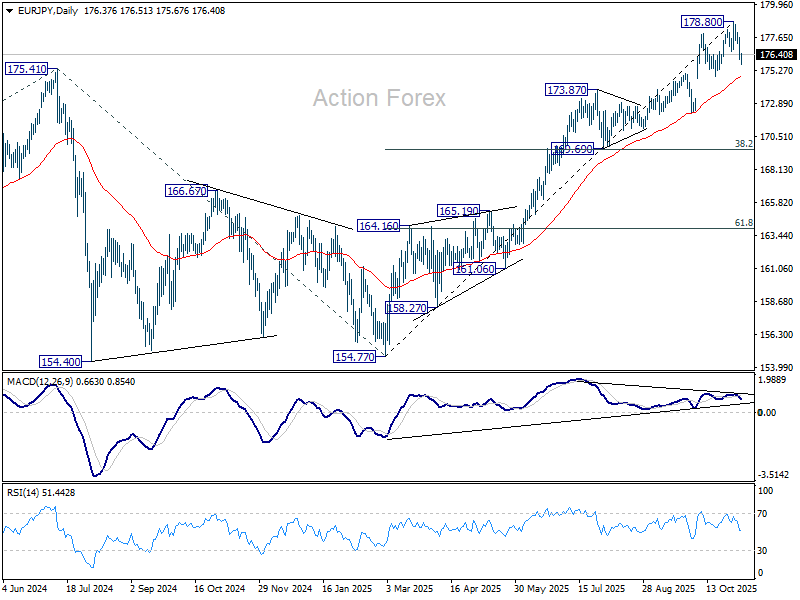
EUR/JPY Daily Outlook
Daily Pivots: (S1) 175.77; (P) 176.75; (R1) 177.41; More...
EUR/JPY's fall extended through 176.60 support. Considering bearish divergence condition in D MACD fall from 1780.80 short term top could be correcting whole rise from 154.77. Intraday bias is now on the downside for 55 D EMA (now at 174.76). Sustained break there will solidify this case and target 169.69 cluster (38.2% retracement of 154.77 to 178.80 at 169.69. Risk will stay on the downside as long as 178.80 resistance holds, in case of recovery.
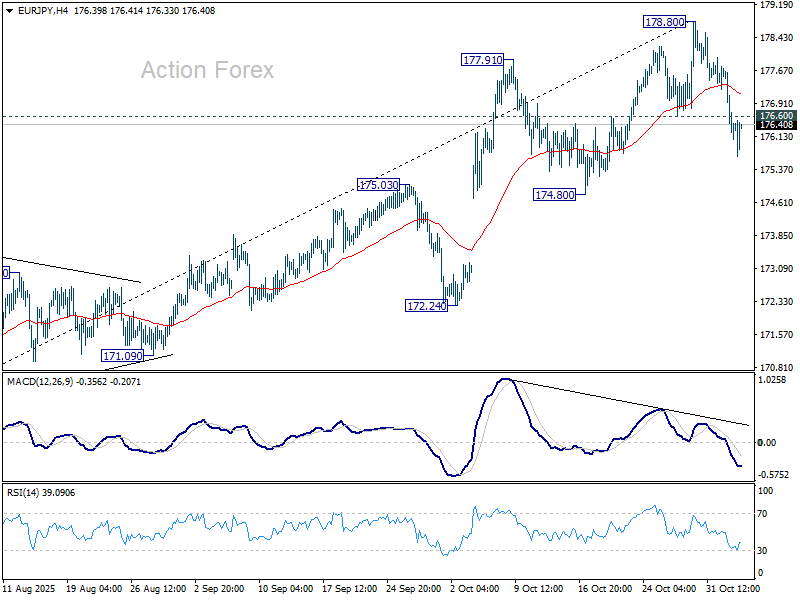
In the bigger picture, up trend from 114.42 (2020 low) is in progress and should target 61.8% projection of 124.37 to 175.41 from 154.77 at 186.31. Firm break of 174.80 support will suggests that it has turned into consolidations again. But still, outlook will continue to stay bullish as long as 55 W EMA (now at 167.87) holds, even in case of deep pullback.
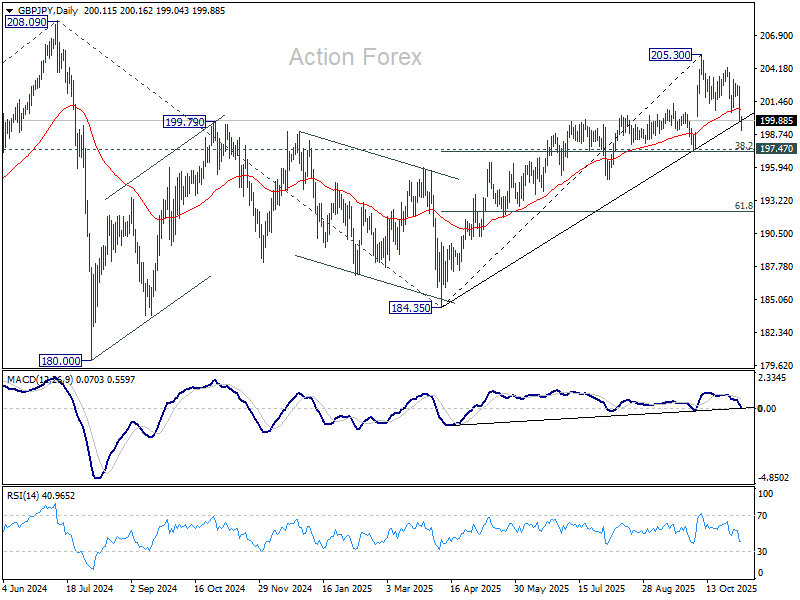
GBP/JPY Daily Outlook
Daily Pivots: (S1) 199.08; (P) 200.90; (R1) 201.91; More...
Intraday bias in GBP/JPY is back on the downside as fall from 205.30 resumed. Deeper decline should be seen to 194.47 cluster (38.2% retracement of 184.35 to 205.30 at 197.29). Strong support could be seen there to contain downside and bring rebound. above 300.54 minor resistance will turn bias neutral first. However, sustained break of 197.39/47 should confirm near term reversal, and target 61.8% retracement 192.35 next.
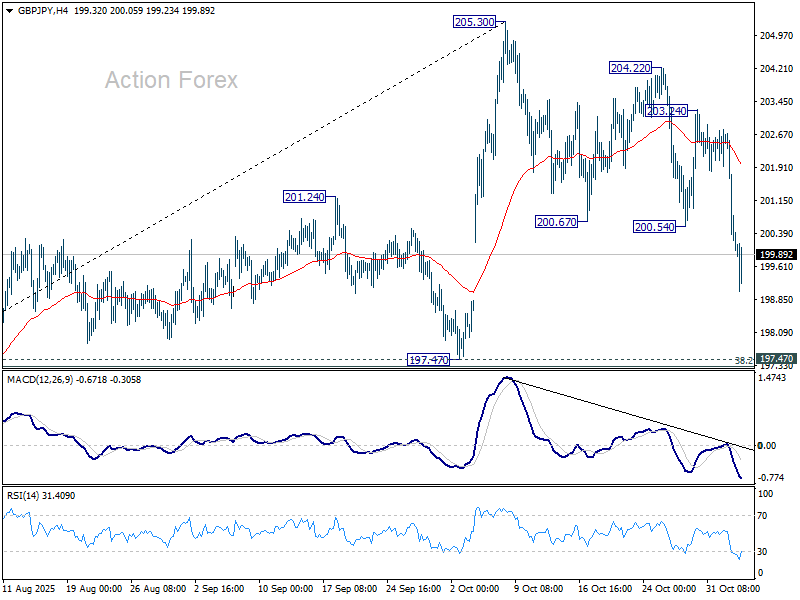
In the bigger picture, price actions from 208.09 (2024 high) are seen as a corrective pattern which might have completed at 184.35. Firm break of 208.09 high will resume the up trend from 123.94 (2020 low). Next target is 61.8% projection of 148.93 to 208.09 from 184.35 at 220.90. However, decisive break of 197.47 support will dampen this view and extend the corrective pattern with another fall.
AI Selloff Sparks Global Risk Rout; Yen and Dollar Stay Firm
Global markets tumbled on Wednesday as a renewed selloff in AI-linked stocks spread from Wall Street to Asia, driving a wave of risk aversion across assets. Nikkei and Kospi each fell nearly 3%, echoing the overnight decline in NASDAQ, which lost more than 2% as investors unwound positions in high-flying technology names. The correction comes amid growing fears that the AI trade, which has fueled much of this year’s rally, may be reaching unsustainable levels.
The pace and scale of gains in AI-related equities have prompted comparisons to past tech bubbles. Any meaningful correction in the sector could drag broader indexes lower given the heavy market weighting of mega-cap names. Goldman Sachs and Morgan Stanley added to the cautious tone this week, advising clients to brace for potential drawdowns over the next two years as valuations stretch beyond fundamentals.
The risk-off mood rippled into the crypto market, where Bitcoin briefly broke below the key 100,000 psychological level before recovering. Broader equity futures in both Europe and the U.S. also pointed lower, suggesting that the risk reset has yet to run its course.
In the currency market, Yen outperformed as investors flocked to safety, aided by continued verbal intervention from Japanese officials. Dollar also remained firm amid reduced odds of a December Fed cut, while Euro stayed resilient. On the weaker side, Kiwi and Aussie underperformed amid fading risk appetite, while Sterling also softened. Swiss Franc and Canadian Dollar traded in mid-range.
Attention now turns to U.S. ADP employment and ISM Services PMI today, which will serve as key policy signals during the ongoing government data blackout. With official statistics unavailable due to the shutdown, these private-sector indicators will heavily influence expectations for the Fed’s December meeting. However, the interpretations of the data could be nuanced: weaker readings could support hopes for Fed easing, but overly soft data might spark concern that the US economy is faltering faster than expected.
On the trade front, China’s State Council tariff commission announced the suspension of its 24% additional levy on U.S. goods for one year, while keeping a 10% baseline duty. Beijing also said it would lift tariffs of up to 15% on select U.S. agricultural goods from November 10. While the gesture offers a modest boost to sentiment, it was not enough to offset the day’s risk-off tone. With AI-driven volatility dominating markets. The prevailing theme remains caution, with risk assets struggling to find footing amid fears of a broader correction.
In Asia, at the time of writing, Nikkei is down -2.60%. Hong Kong HSI is down -0.29%. China Shanghai SSE is up 0.18%. Singapore Strait Times is down -0.39%. Japan 10-yer JGB yield is down -0.007 at 1.670. Overnight, DOW fell -0.53%. S&P 500 fell -1.17%. NASDAQ fell -2.04%. 10-year yield fell -0.017 to 4.089.
BoJ minutes: Hawks urge gradual tightening, others prefer to wait
Minutes from the BoJ’s September policy meeting revealed a deeply divided board, with members debating the pace and timing of future rate hikes. The nine-member board voted to keep the policy rate steady at 0.5%, rejecting calls by two hawkish members who wanted to raise borrowing costs to 0.75%. The discussion centered on balancing the downside risks to growth against persistent inflationary pressures, particularly from elevated food prices.
Some members argued for moving sooner rather than later. One hawkish participant called for raising rates at “somewhat regular intervals”, citing an improving flow of data, including corporate earnings and the Tankan business survey, as valuable indicators to guide normalization. Another member warned that the cost of waiting too long to tighten policy was “gradually increasing,” even if it would allow the BoJ to gain more clarity on the global outlook, especially from the U.S.
However, the majority on agreed it was better to wait for “a little more hard data” before considering another move. They noted that while conditions for tightening were gradually being met, acting now could “surprise the market” and risk destabilizing financial conditions. Some emphasized that as long as inflation expectations remain insufficiently anchored, maintaining accommodative conditions was appropriate to support Japan’s recovery.
Another member highlighted uncertainty surrounding the U.S. slowdown as a key reason to stay cautious, but conceded that, based purely on domestic fundamentals, Japan might soon meet the conditions for another hike.
New Zealand labor market stagnates, unemployment rate rises to 5.3%
New Zealand’s labor market showed further signs of softening in the Q3, with total employment flat at 0.0% qoq, missing expectations for a small 0.1% qoq rise. On an annual basis, employment fell -0.6% yoy.
Unemployment rate ticked up from 5.2% to 5.3%, in line with forecasts, extending a full year of readings above 5%. The last time joblessness reached this level was in late 2016. Labor-force participation rate slipped 0.2 ppt to 70.3%, suggesting some workers are leaving the active job market.
Wage growth also cooled, with all-sector earnings up 0.4% qoq and 2.1% yoy, indicating reduced pressure on labor costs.
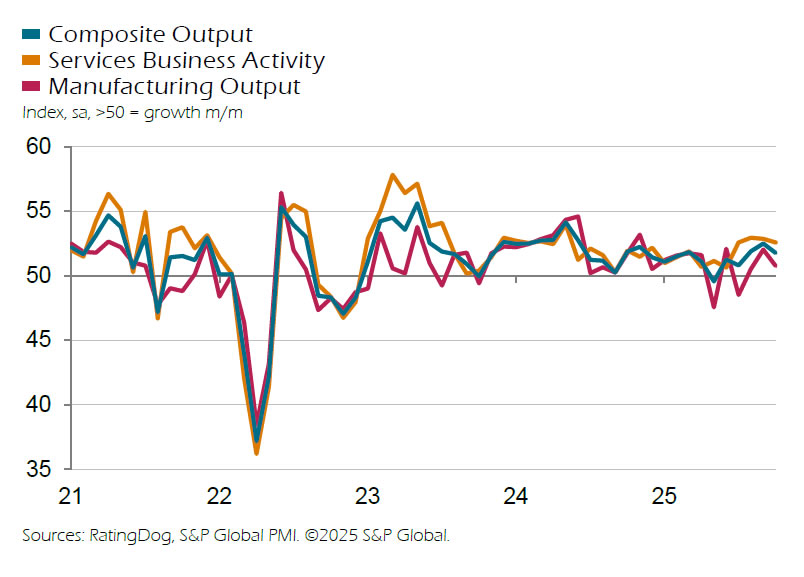
China RatingDog PMI Services falls to 52.6, export orders contract
China’s service sector expansion eased slightly in October, with the RatingDog PMI Services slipping from 52.9 to 52.6, in line with expectations. Composite PMI also moderated to 51.8 from 52.5. While domestic demand improved, weakness in overseas orders capped momentum, reflecting the impact of renewed global trade instability on China’s external-facing industries.
RatingDog founder Yao Yu said new export business “fell noticeably into contractionary territory” amid "increased instability in the global trade environment". However, total new orders still expanded as domestic demand strengthened. Business expectations remained high even though confidence edged slightly lower. Employment stayed in contraction, but the pace of job losses eased.
Price pressures were uneven. Input costs rose for an eighth consecutive month, reaching their highest level since October 2024. On the other hand, output prices slipped back into contraction, implying margin compression for service providers.
GBP/JPY Daily Outlook
Daily Pivots: (S1) 199.08; (P) 200.90; (R1) 201.91; More...
Intraday bias in GBP/JPY is back on the downside as fall from 205.30 resumed. Deeper decline should be seen to 194.47 cluster (38.2% retracement of 184.35 to 205.30 at 197.29). Strong support could be seen there to contain downside and bring rebound. above 300.54 minor resistance will turn bias neutral first. However, sustained break of 197.39/47 should confirm near term reversal, and target 61.8% retracement 192.35 next.
In the bigger picture, price actions from 208.09 (2024 high) are seen as a corrective pattern which might have completed at 184.35. Firm break of 208.09 high will resume the up trend from 123.94 (2020 low). Next target is 61.8% projection of 148.93 to 208.09 from 184.35 at 220.90. However, decisive break of 197.47 support will dampen this view and extend the corrective pattern with another fall.
USD/CHF Outlook: Bullish Momentum Grows, Key Resistance In Sight
Key Highlights
- USD/CHF started a fresh increase above 0.8000 and 0.8050.
- It cleared a key bearish trend line with resistance at 0.7955 on the 4-hour chart.
- EUR/USD declined further below 1.1550 and 1.1520.
- Bitcoin started another sharp decline and traded below $106,500.
USD/CHF Technical Analysis
The US Dollar started a decent increase from 0.7920 against the Swiss Franc. USD/CHF climbed above 0.8000 to enter a positive zone.
Looking at the 4-hour chart, the pair settled above 0.8020, the 100 simple moving average (red, 4-hour), and the 200 simple moving average (green, 4-hour). The pair even spiked above 0.8100. If the bulls remain in action, the pair could accelerate higher toward 0.8150.
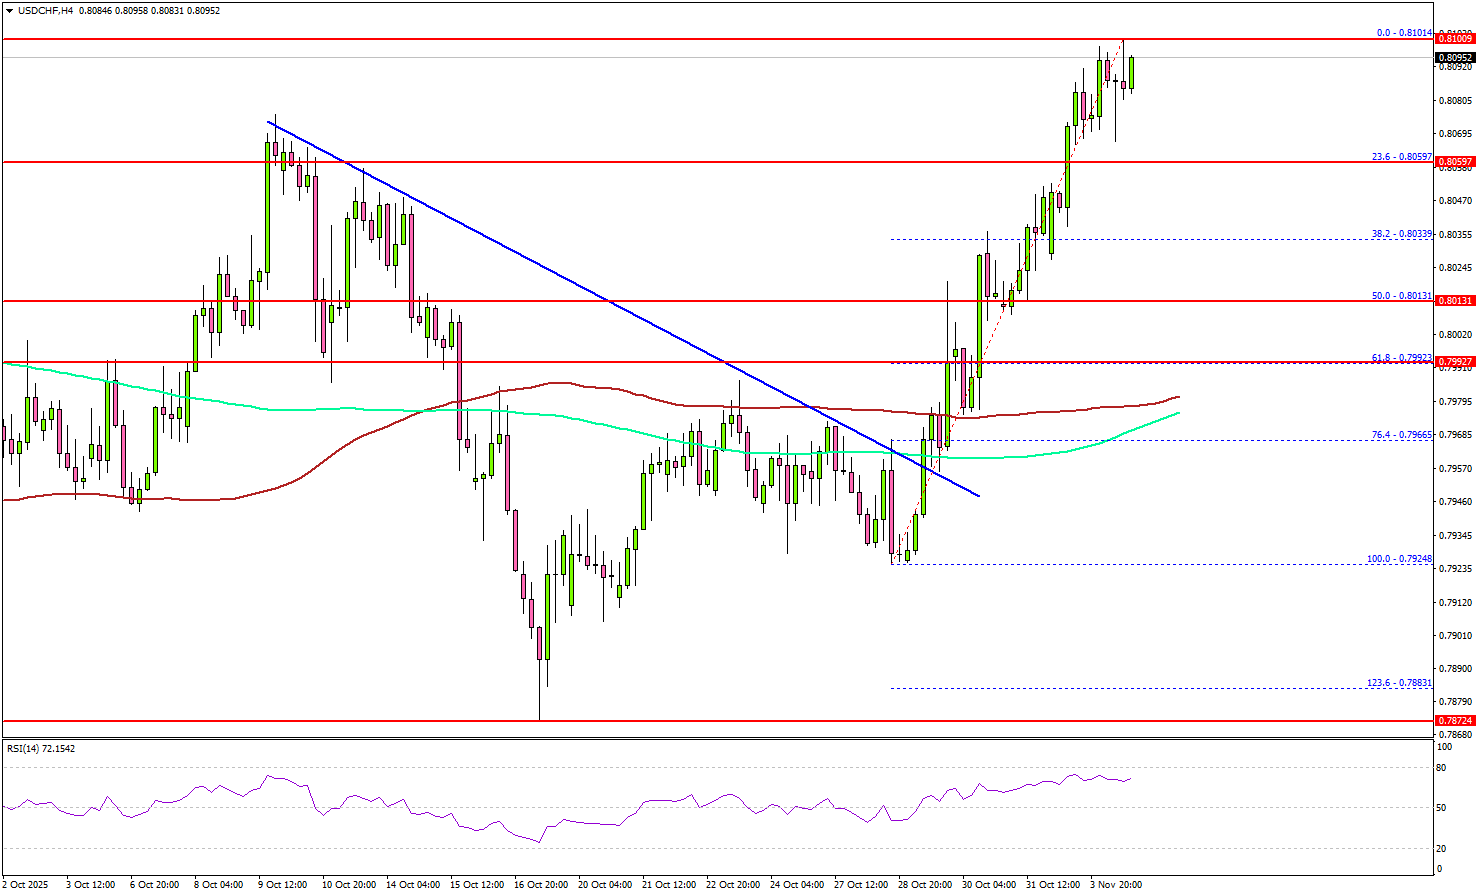
The first major resistance is 0.8200. A close above 0.8200 resistance might push the pair to 0.8240. Any more gains could set the pace for a steady increase toward 0.8265.
On the downside, the pair might find support at 0.8080. The main support might be 0.8060 and the 23.6% Fib retracement level of the upward move from the 0.7924 swing low to the 0.8104 high.
A close below the 0.8060 zone could start a major pullback toward 0.8010 and the 50% Fib retracement level of the upward move from the 0.7924 swing low to the 0.8104 high. Any more losses might open the doors for a test of 0.7980 and the 100 simple moving average (red, 4-hour).
Looking at EUR/USD, the pair is declining, and there are chances of more losses below the 1.1450 level in the near term.
Upcoming Key Economic Events:
- US Global Services PMI for Sep 2025 – Forecast 55.2, versus 55.2 previous.
- US ISM Services Index for Sep 2025 – Forecast 50.7, versus 50.0 previous.
- US ADP Employment Change for Oct 2025 - Forecast 24K, versus -32K previous.
BoJ minutes: Hawks urge gradual tightening, others prefer to wait
Minutes from the BoJ’s September policy meeting revealed a deeply divided board, with members debating the pace and timing of future rate hikes. The nine-member board voted to keep the policy rate steady at 0.5%, rejecting calls by two hawkish members who wanted to raise borrowing costs to 0.75%. The discussion centered on balancing the downside risks to growth against persistent inflationary pressures, particularly from elevated food prices.
Some members argued for moving sooner rather than later. One hawkish participant called for raising rates at “somewhat regular intervals”, citing an improving flow of data, including corporate earnings and the Tankan business survey, as valuable indicators to guide normalization. Another member warned that the cost of waiting too long to tighten policy was “gradually increasing,” even if it would allow the BoJ to gain more clarity on the global outlook, especially from the U.S.
However, the majority on agreed it was better to wait for “a little more hard data” before considering another move. They noted that while conditions for tightening were gradually being met, acting now could “surprise the market” and risk destabilizing financial conditions. Some emphasized that as long as inflation expectations remain insufficiently anchored, maintaining accommodative conditions was appropriate to support Japan’s recovery.
Another member highlighted uncertainty surrounding the U.S. slowdown as a key reason to stay cautious, but conceded that, based purely on domestic fundamentals, Japan might soon meet the conditions for another hike.
China RatingDog PMI services falls to 52.6, export orders contract
China’s service sector expansion eased slightly in October, with the RatingDog PMI Services slipping from 52.9 to 52.6, in line with expectations. Composite PMI also moderated to 51.8 from 52.5. While domestic demand improved, weakness in overseas orders capped momentum, reflecting the impact of renewed global trade instability on China’s external-facing industries.
RatingDog founder Yao Yu said new export business “fell noticeably into contractionary territory” amid "increased instability in the global trade environment". However, total new orders still expanded as domestic demand strengthened. Business expectations remained high even though confidence edged slightly lower. Employment stayed in contraction, but the pace of job losses eased.
Price pressures were uneven. Input costs rose for an eighth consecutive month, reaching their highest level since October 2024. On the other hand, output prices slipped back into contraction, implying margin compression for service providers.
New Zealand labor market stagnates, unemployment rate rises to 5.3%
New Zealand’s labor market showed further signs of softening in the Q3, with total employment flat at 0.0% qoq, missing expectations for a small 0.1% qoq rise. On an annual basis, employment fell -0.6% yoy.
Unemployment rate ticked up from 5.2% to 5.3%, in line with forecasts, extending a full year of readings above 5%. The last time joblessness reached this level was in late 2016. Labor-force participation rate slipped 0.2 ppt to 70.3%, suggesting some workers are leaving the active job market.
Wage growth also cooled, with all-sector earnings up 0.4% qoq and 2.1% yoy, indicating reduced pressure on labor costs.
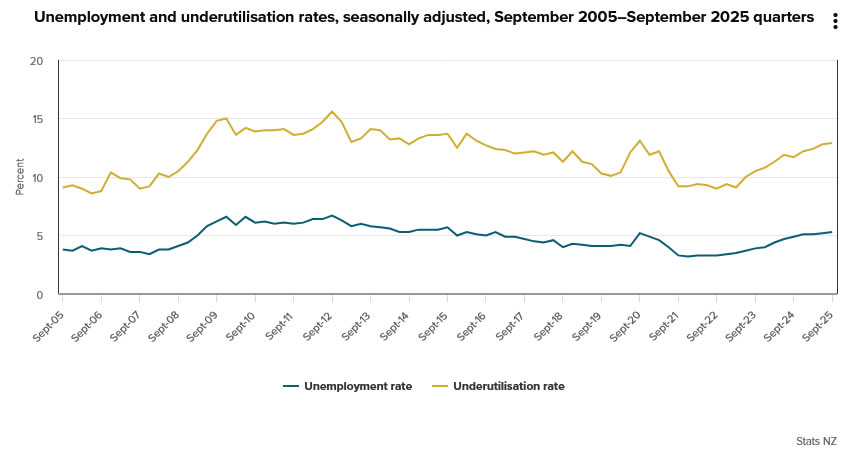
First Impressions: NZ Labour Market Statistics, September Quarter 2025
The unemployment rate rose to 5.3% in the September quarter, as expected. Employment was flat and more people exited the labour force, but there was an encouraging lift in hours worked.
- Unemployment rate: 5.3% (prev: 5.2%, Westpac: 5.3%, RBNZ: 5.3%, mkt: 5.3%)
- Employment change: 0.0% (prev: -0.2%, Westpac: 0.0%, RBNZ: 0.0%, mkt: +0.1%)
- Participation rate: 70.3% (prev: 70.5%, Westpac: 70.4%, RBNZ: 70.4%, mkt: 70.5%)
- Labour costs (private sector): +0.4% (prev: +0.6%, Westpac: +0.5%, RBNZ: +0.4%, mkt: +0.4%)
The September quarter labour market surveys were generally as subdued as we were expecting. The unemployment rate ticked up from 5.2% to 5.3%, its highest level since 2016. There was a similar rise in the broader underutilisation measure from 12.8% to 12.9%.
The number of people employed was flat for the quarter, broadly matching the signal from the Monthly Employment Indicator (noting that the MEI has picked up in the last two months but tends to be overstated on its initial release). With the working-age population growing by 0.3% over the quarter, this was absorbed through a combination of higher unemployment and lower participation. The participation rate fell from 70.5% to 70.3% – a slightly larger fall than we had assumed – and appears to have been spread across age groups.
One unexpected but encouraging result was a 0.9% rise in hours worked in the Household Labour Force Survey – the first quarterly increase since December 2023. The HLFS measure can be volatile and not necessarily a good indicator for quarterly GDP, but in this case it was backed by a rise in the jobs and hours measures in the Quarterly Employment Survey as well. Average hours worked had fallen markedly over the last year or so, implying that employers were adjusting to the soft economy by reducing hours rather than laying off workers; the latest quarterly result suggests that this trend is reversing (or was perhaps overstated in the first place).
Given the degree of slack in the labour market, wage trends were unsurprisingly subdued. The Labour Cost Index for all sectors rose by 0.4% for the quarter, a little below our estimate but in line with market and RBNZ forecasts. Public sector wages rose 0.6% (driven more by local than central government), while private sector wages were up 0.4%.
The unadjusted analytical LCI, which includes pay increases that are related to higher productivity, rose by 0.7% for the quarter. The annual growth rate slowed from 3.6% to 3.4%, its lowest since June 2021. The distribution of pay increases also continued to soften: 44% of roles saw no increase in the past year, the highest share since June 2021. For those roles that did see pay rises, the average size of the increase is converging on the 2-3% range.
The September quarter results were almost entirely in line with the RBNZ’s forecasts, offering little for markets to chew on ahead of the 26 November Monetary Policy Statement. There are some early signs of the economy stabilising, but the existing degree of spare capacity will give the RBNZ confidence that inflation will moderate back towards the 2% target midpoint next year. We continue to expect a 25bp cut in November.