Sample Category Title
GBP/JPY Daily Outlook
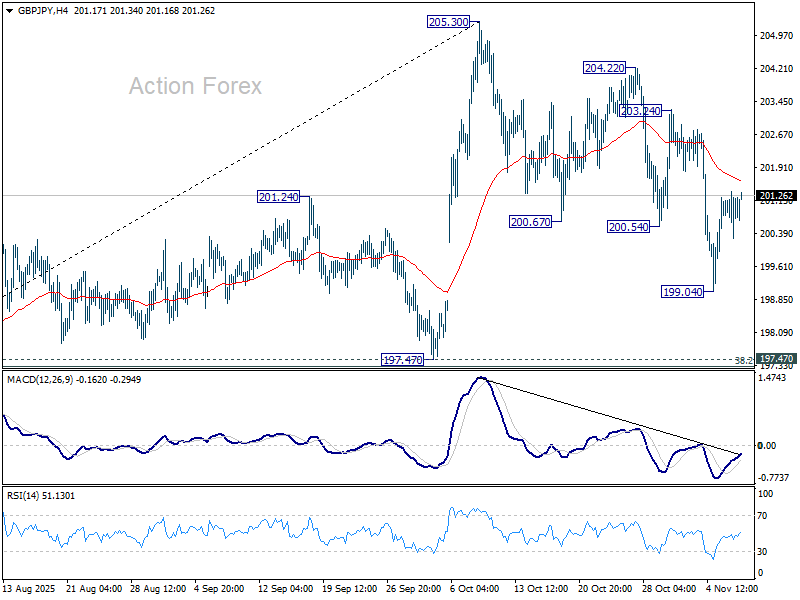
Daily Pivots: (S1) 200.49; (P) 200.94; (R1) 201.56; More...
Intraday bias in GBP/JPY remains neutral, and risk will stay on the downside as long as 203.24 resistance holds. Below 199.04 will resume the fall from 205.30 to 194.47 cluster (38.2% retracement of 184.35 to 205.30 at 197.29). Sustained break of 197.29/47 should confirm near term reversal, and target 61.8% retracement 192.35 next.
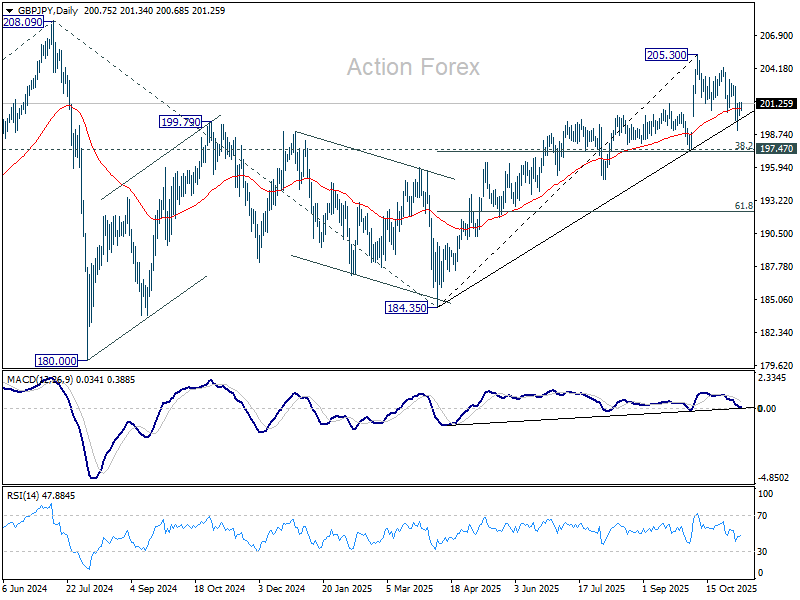
In the bigger picture, price actions from 208.09 (2024 high) are seen as a corrective pattern which might have completed at 184.35. Firm break of 208.09 high will resume the up trend from 123.94 (2020 low). Next target is 61.8% projection of 148.93 to 208.09 from 184.35 at 220.90. However, decisive break of 197.47 support will dampen this view and extend the corrective pattern with another fall.
EUR/JPY Daily Outlook
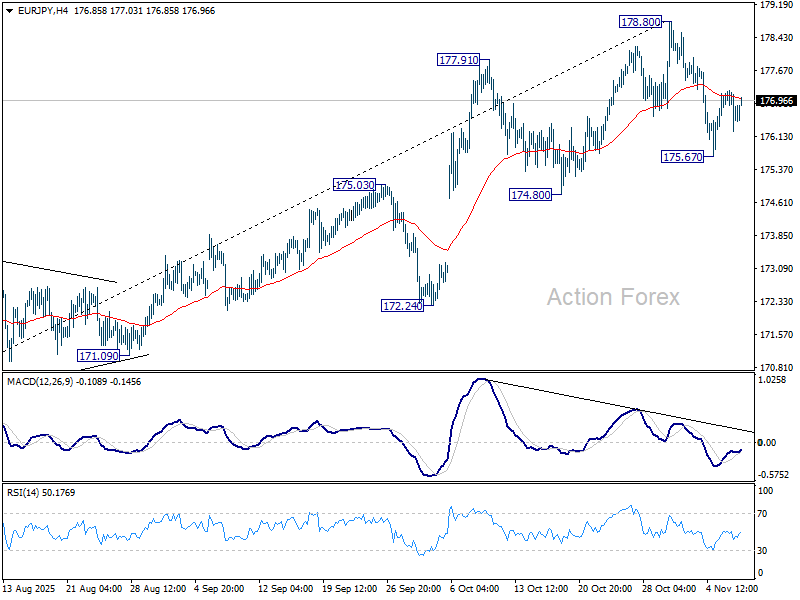
Daily Pivots: (S1) 176.30; (P) 176.76; (R1) 177.24; More...
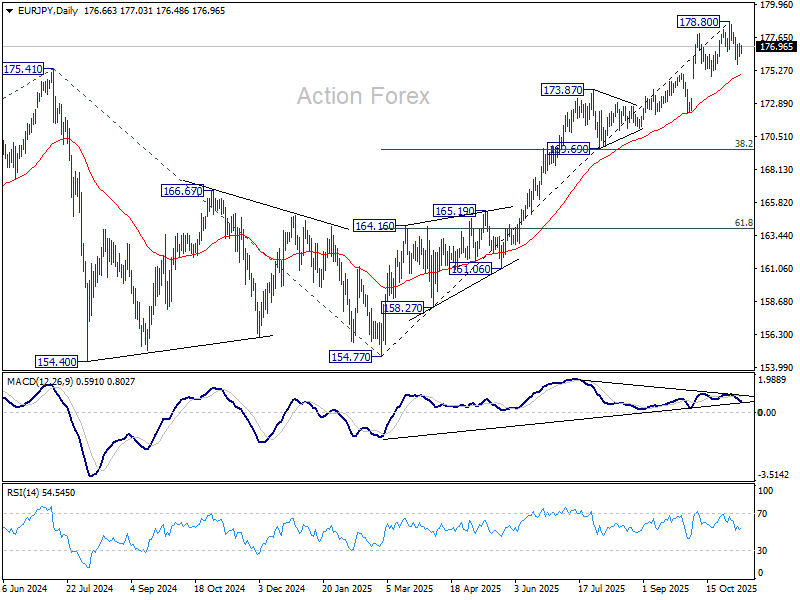
Intraday bias in EUR/JPY remains neutral at this point. Risk will stay on the downside as long as 178.80 short term top holds. Below 175.67 will target 55 D EMA (now at 174.99). Sustained break there will should confirm that EUR/JPY is correcting whole rise from 154.87, and target 169.69 cluster (38.2% retracement of 154.77 to 178.80 at 169.69).
In the bigger picture, up trend from 114.42 (2020 low) is in progress and should target 61.8% projection of 124.37 to 175.41 from 154.77 at 186.31. Firm break of 174.80 support will suggests that it has turned into consolidations again. But still, outlook will continue to stay bullish as long as 55 W EMA (now at 167.87) holds, even in case of deep pullback.
EUR/GBP Daily Outlook
Daily Pivots: (S1) 0.8778; (P) 0.8799; (R1) 0.8810; More…
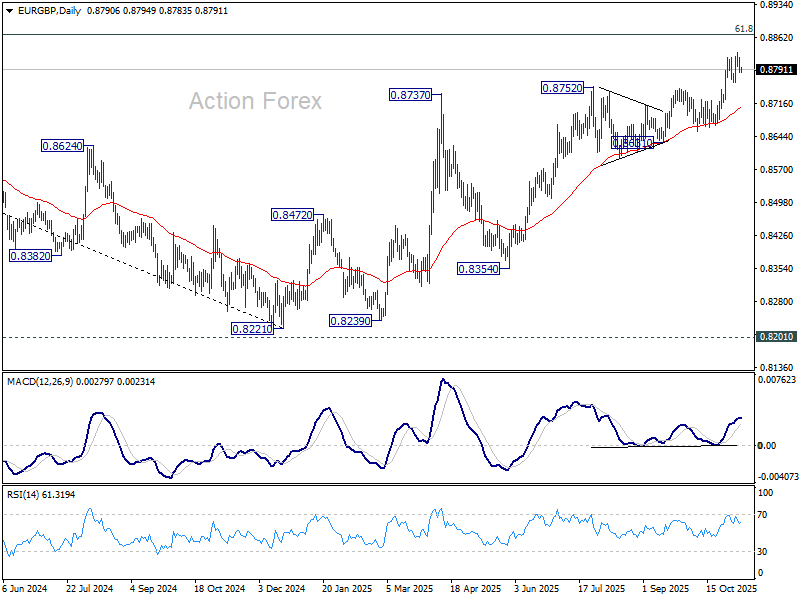
Intraday bias in EUR/GBP is turned neutral again with current retreat. On the upside, above 0.8828 will resume the rally from 0.8221 to 0.8867 fibonacci level. Firm break there will carry larger bullish implications. However, considering bearish divergence condition in 4H MACD, decisive break of 0.8761 will confirm short term topping, and bring deeper fall to 55 D EMA (now at 0.8708).
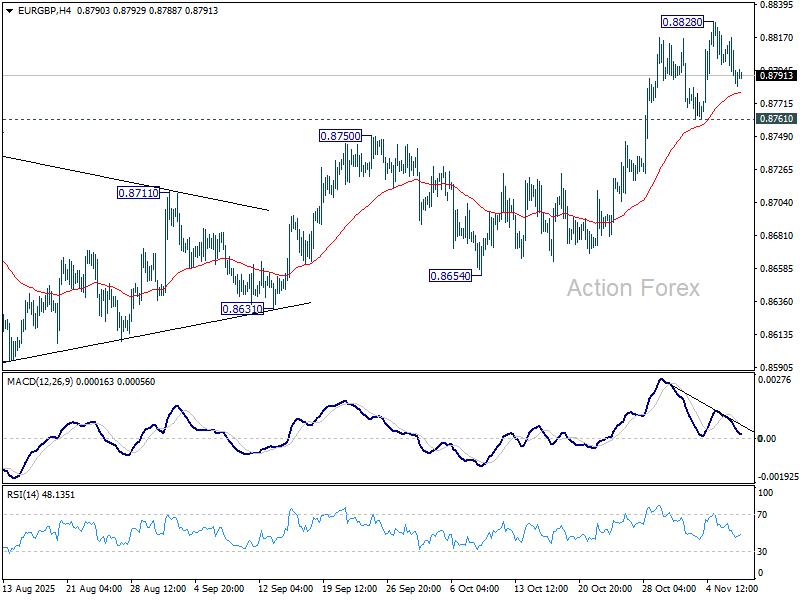
In the bigger picture, rise from 0.8221 medium term bottom is still seen as a corrective move. Upside should be limited by 61.8% retracement of 0.9267 to 0.8221 at 0.8867. Firm break of 0.8654 support will be the first sign that this corrective bounce has completed. However, decisive break of 0.8867 will suggest that EUR/GBP is already reversing whole decline from 0.9267 (2022 high).
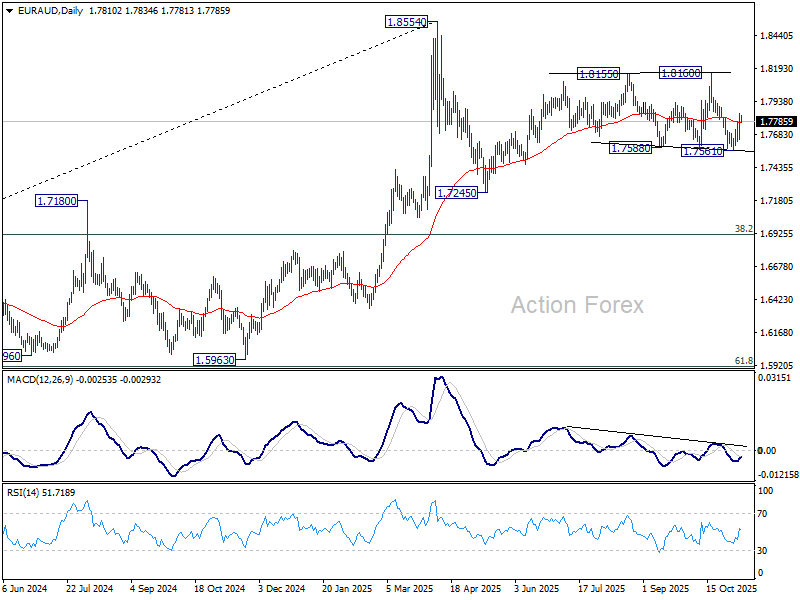
EUR/AUD Daily Outlook
Daily Pivots: (S1) 1.7700; (P) 1.7775; (R1) 1.7896; More...
EUR/AUD's break of 1.7813 resistance dampen the original bearish view. Intraday bias is back on the upside for 1.8160 resistance first. On the downside, though, break of 1.7561 will resume the fall from 1.8160 to 1.7254 support.
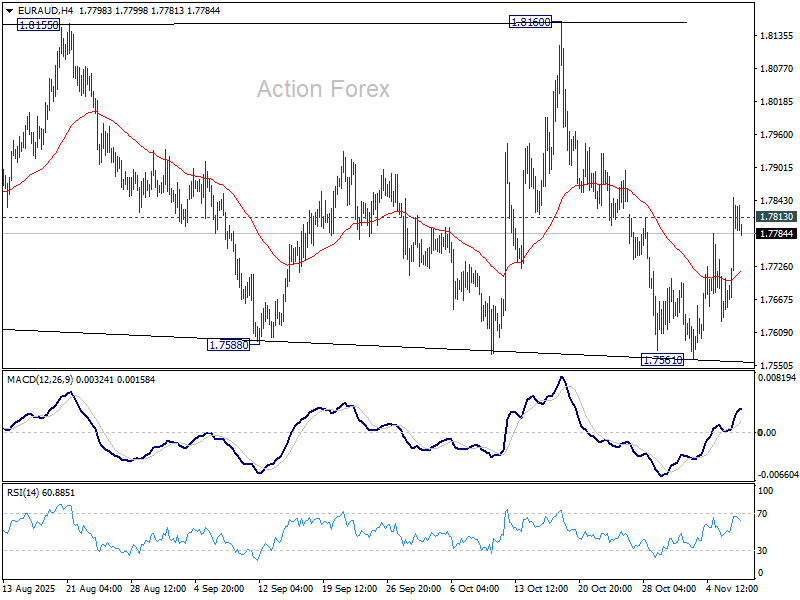
In the bigger picture, price actions from 1.8554 medium term top are seen as a corrective pattern. Sustained break of 55 W EMA (now at 1.7406) will suggest that it's correcting the whole rally from 1.4281 (2022 low). In this case, deeper decline would be seen to 38.2% retracement of 1.4281 to 1.8554 at 1.6922. Nevertheless, strong rebound form 55 W EMA will likely bring resumption of the up trend sooner.
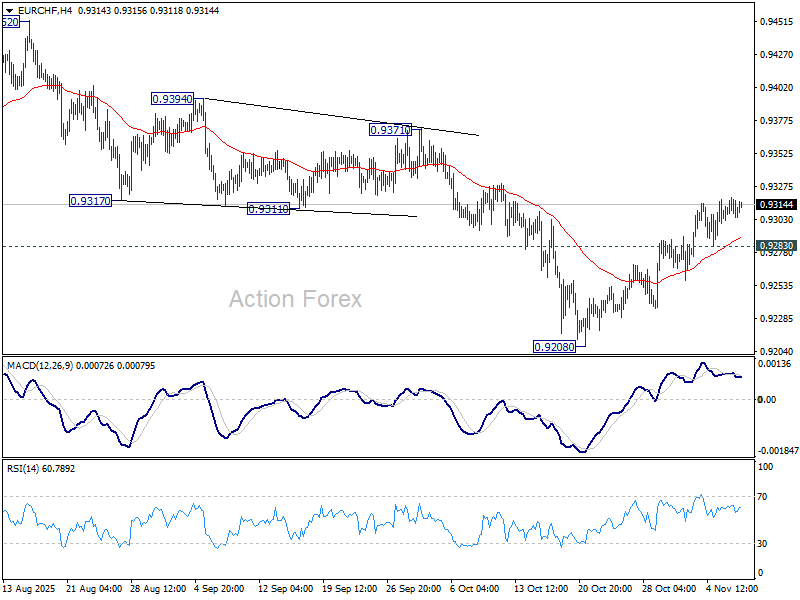
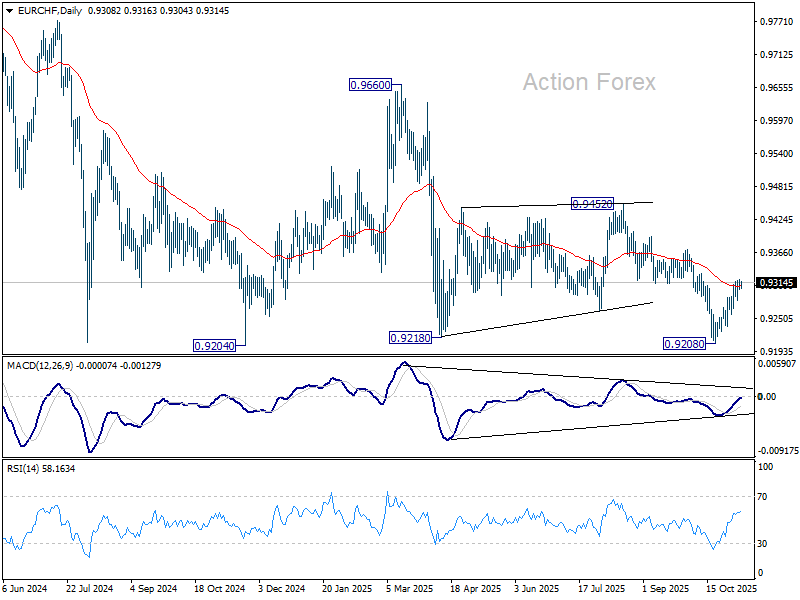
EUR/CHF Daily Outlook
Daily Pivots: (S1) 0.9302; (P) 0.9311; (R1) 0.9320; More....
Intraday bias in EUR/CHF remains mildly on this point. Rebound from 0.9208 short term bottom would target 0.9371 resistance first. Firm break there will target 0.9452 next. On the downside, below 0.9283 minor support will turn bias neutral again.
In the bigger picture, outlook remains bearish with EUR/CHF staying well inside long term falling channel after multiple rejection by 55 W EMA (now at 0.9386). Firm break of 0.9204 will resume the whole down trend from 1.2004 (2018 high). Next target is 61.8% projection of 1.1149 to 0.9407 from 0.9928 at 0.8851. Break of 0.9452 resistance is needed to be the first sign of medium term bottoming.
EUR/USD Daily Outlook
Daily Pivots: (S1) 1.1508; (P) 1.1530; (R1) 1.1569; More…
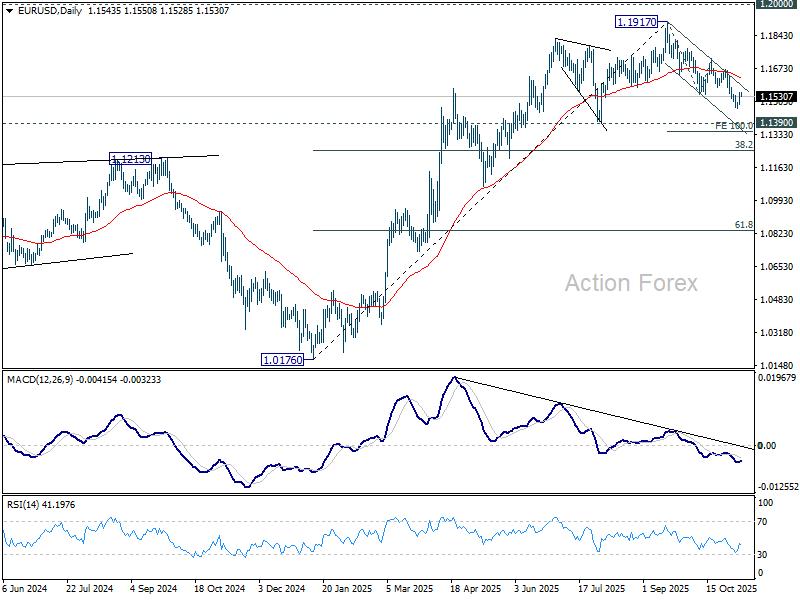
Intraday bias in EUR/USD remains neutral as consolidations continues. Further decline is expected as long as 1.1727 resistance holds. Below 1.1467 will extend the fall from 1.1917 to 100% projection of 1.1917 to 1.1540 from 1.1727 at 1.1350. Decisive break there would prompt downside acceleration to 38.2% retracement of 1.0176 to 1.1917 at 1.1252.
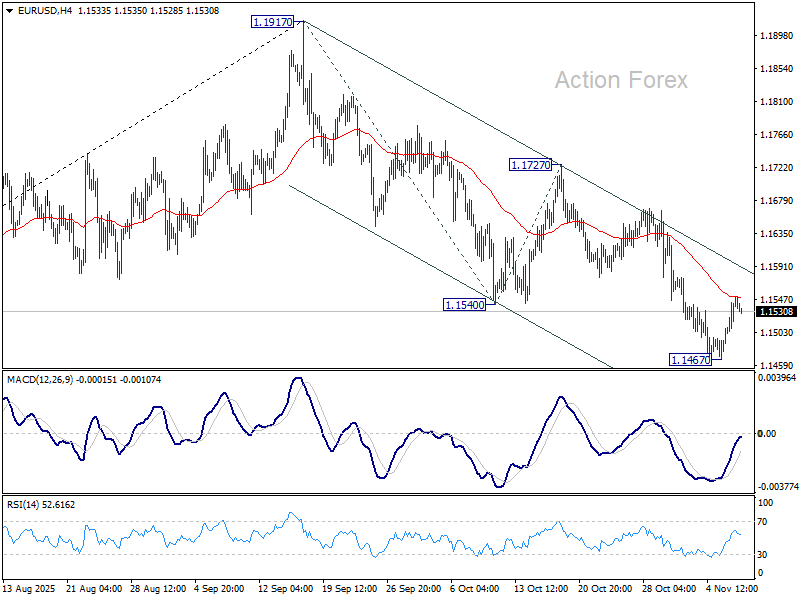
In the bigger picture, considering bearish divergence condition in D MACD, a medium term top is likely in place at 1.1917, just ahead of 1.2 key psychological level. As long as 55 W EMA (now at 1.1306) holds, the up trend from 0.9534 (2022 low) is still expected to continue. Decisive break of 1.2000 will carry larger bullish implications. However, sustained trading below 55 W EMA will argue that rise from 0.9534 has completed as a three wave corrective bounce, and keep outlook bearish.
GBP/USD Daily Outlook
Daily Pivots: (S1) 1.3075; (P) 1.3109; (R1) 1.3171; More...
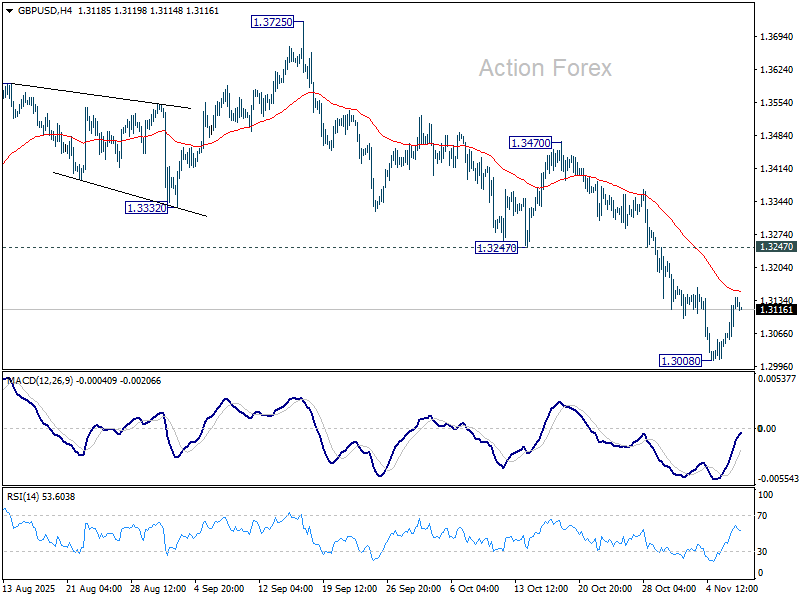
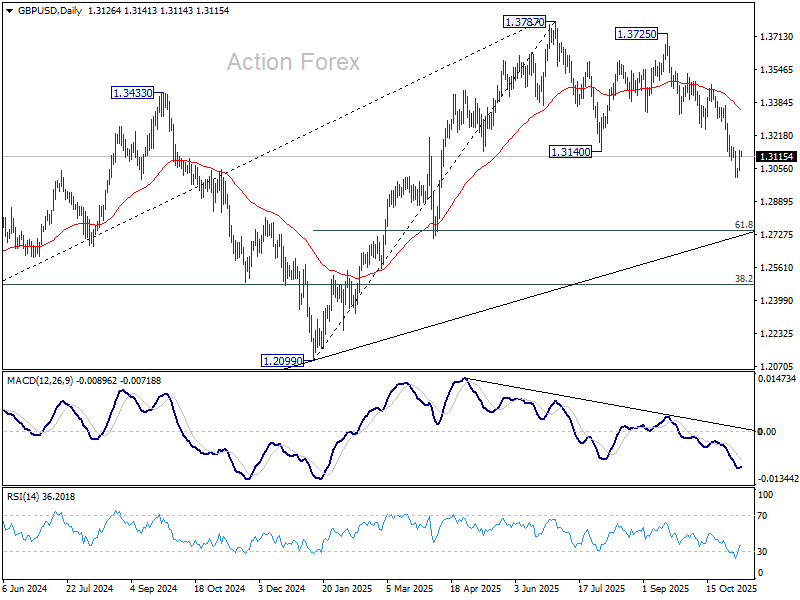
GBP/USD is staying in consolidations and intraday bias remains neutral. Further decline is expected with 1.3247 support turned resistance intact. Break of 1.3008 will resume the fall from 1.3787 and target 61.8% retracement of 1.2099 to 1.3787 at 1.2744. Sustained break there will pave the way to 1.2099 support next.
In the bigger picture, the break of 55 W EMA (now at 1.3185) is taken as the first sign that corrective rise from 1.0351 (2022 low) has completed. Decisive break of trend line support (now at 1.2780) will solidify this case and target 38.2% retracement of 1.0351 to 1.3787 at 1.2474 next. Meanwhile, in case of another rise, strong resistance should emerge below 1.4248 (2021 high) to cap upside to preserve the long term down trend.
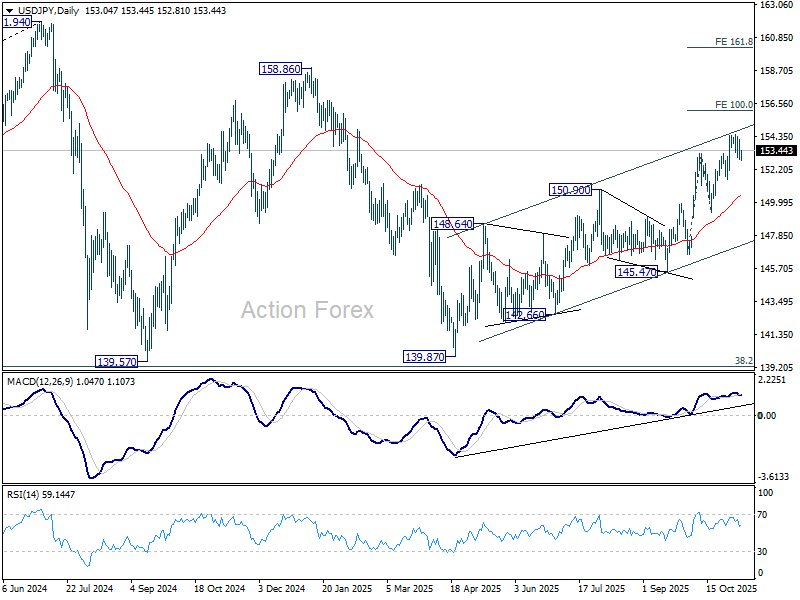
USD/JPY Daily Outlook
Daily Pivots: (S1) 152.55; (P) 153.35; (R1) 153.86; More...
USD/JPY is still extending consolidations from 154.47 and intraday bias remains neutral. Further rally is expected as long as 151.52 support holds. Above 154.47 will resume larger rise from 139.87 to 100% projection of 146.58 to 153.26 from 149.37 at 156.05. Break there will pave the way to 158.85 key structural resistance.
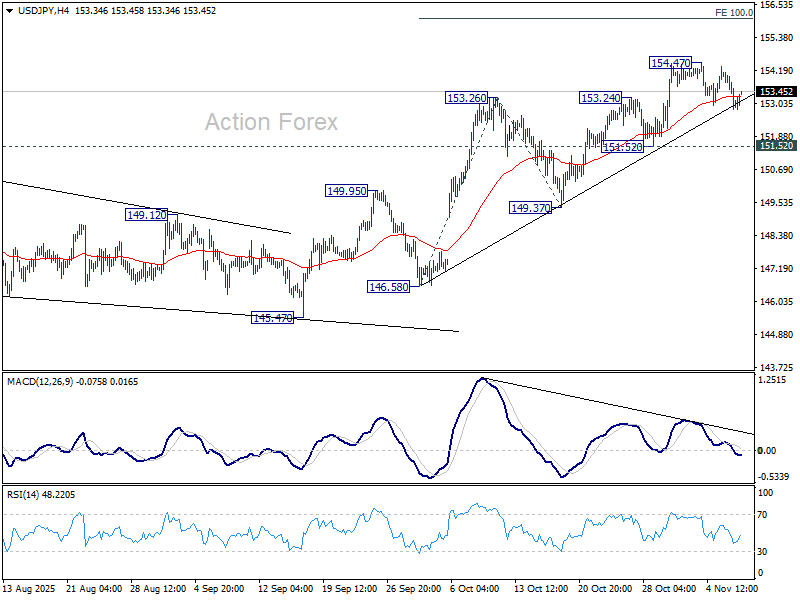
In the bigger picture, current development suggests that corrective pattern from 161.94 (2024 high) has completed with three waves at 139.87. Larger up trend from 102.58 (2021 low) could be ready to resume through 161.94 high. On the downside, break of 145.47 support will dampen this bullish view and extend the corrective pattern with another falling leg.
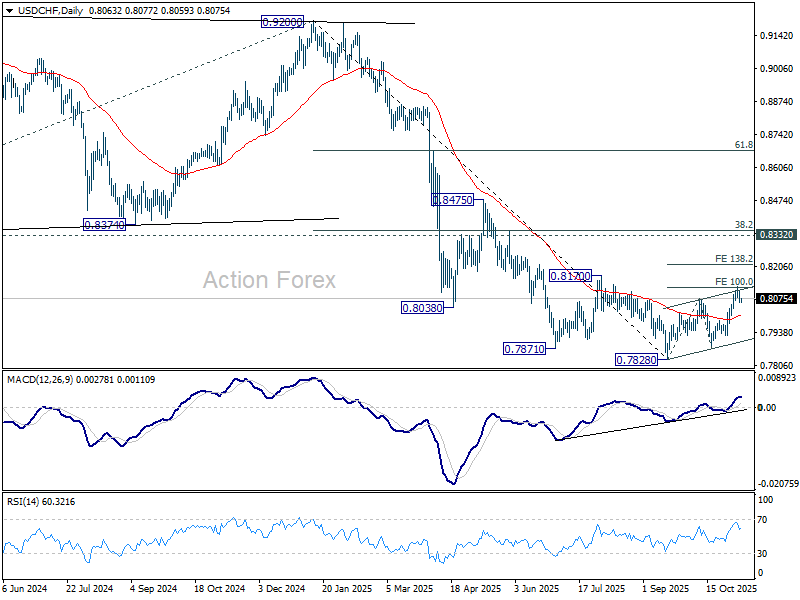
USD/CHF Daily Outlook
Daily Pivots: (S1) 0.8045; (P) 0.8076; (R1) 0.8092; More…
USD/CHF is staying in consolidations and intraday bias remains neutral. On the upside, firm break of 0.8123 will extend the corrective rally from 0.7828 to 138.2% projection of 0.7828 to 0.8075 from 0.7872 at 0.8213. On the downside, sustained break of 55 D EMA (now at 0.8007) will argue that the corrective bounce has completed and bring retest of 0.7828 low.
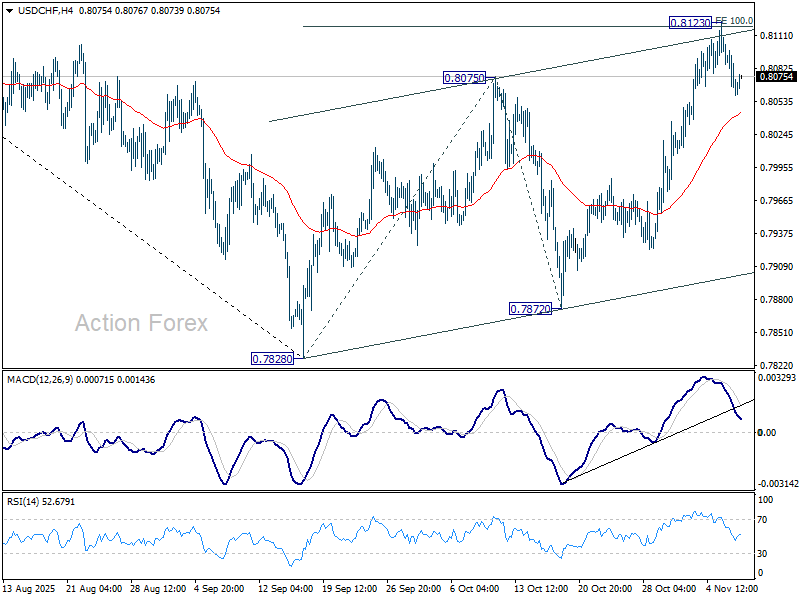
In the bigger picture, long term down trend from 1.0342 (2017 high) is still in progress. Next target is 100% projection of 1.0146 (2022 high) to 0.8332 from 0.9200 at 0.7382. In any case, outlook will stay bearish as long as 0.8332 support turned resistance holds (2023 low).
AUD/USD Daily Report
Daily Pivots: (S1) 0.6456; (P) 0.6487; (R1) 0.6512; More...
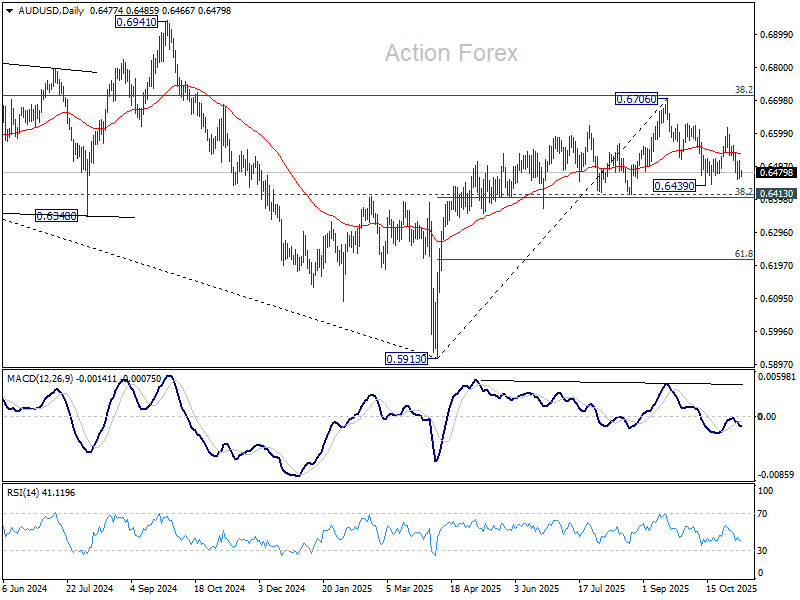
Intraday bias in AUD/USD remains neutral first. Below 0.6457 will target 0.6439 support, and then 0.6413 cluster (38.2% retracement of 0.5913 to 0.6706 at 0.6403). Strong support could be seen there to bring rebound. However, sustained trading below 0.6403/13 will carry larger bearish implications.
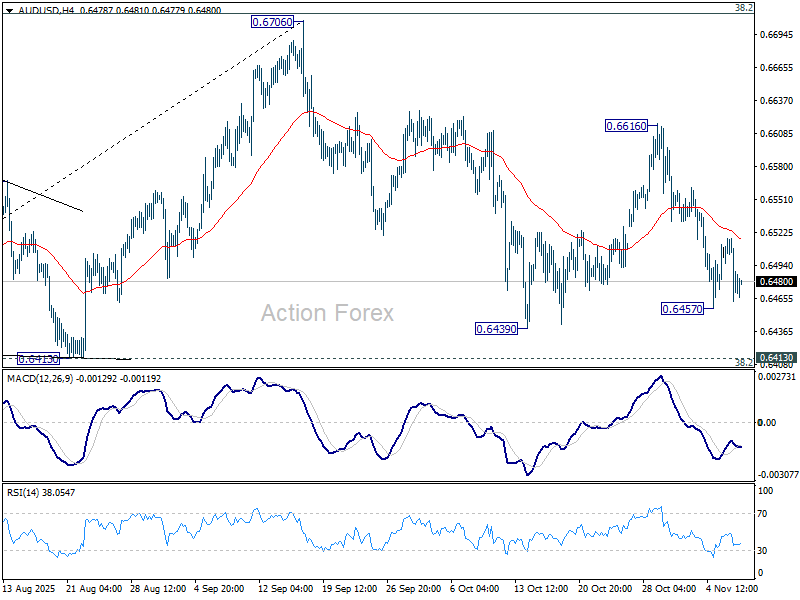
In the bigger picture, there is no clear sign that down trend from 0.8006 (2021 high) has completed. Rebound from 0.5913 is seen as a corrective move. Outlook will remain bearish as long as 38.2% retracement of 0.8006 to 0.5913 at 0.6713 holds. Break of 0.6413 support will suggest rejection by 0.6713 and solidify this bearish case. Nevertheless, considering bullish convergence condition in W MACD, sustained break of 0.6713 will be a strong sign of bullish trend reversal, and pave the way to 0.6941 structural resistance for confirmation.