Sample Category Title
Weekly Economic & Financial Commentary: Crude Oil Pops Under Sanction Pressure
Summary
United States: Fed Still Poised to Cut as Inflation Data Show Only Modest Gain
- The fire is not out for inflation, but the 0.2% rise in core CPI in September was the smallest in three months and keeps the Federal Reserve on track to deliver another 25 bps rate cut at its meeting this coming Wednesday. There were also signs of life in the existing home sales market this week.
- Next week: Consumer Confidence (Tue.), FOMC Meeting (Wed.)
International: Global Inflation Pressures and Emerging Resilience
- China’s Q3 GDP growth slowed but still exceeded expectations, rising 4.8% year-over-year, while several countries—including Canada, New Zealand and Japan—reported higher inflation readings this week. The UK was a notable exception, with inflation cooling. Meanwhile, PMI data from both the Eurozone and the UK surprised to the upside, pointing to a modest pickup in economic momentum heading into the final quarter of the year.
- Next week: Bank of Canada (Wed.), Bank of Japan (Thu.), European Central Bank (Thu.)
Topic of the Week: Crude Oil Pops Under Sanction Pressure
- The U.S. expanded sanctions on Russian oil firms this week, while maintaining hiked tariffs on Indian goods in an effort to pressure Moscow’s key export partner. Despite the spike in oil prices, elevated OPEC production and softer global demand point to continued easing in energy inflation into year-end.
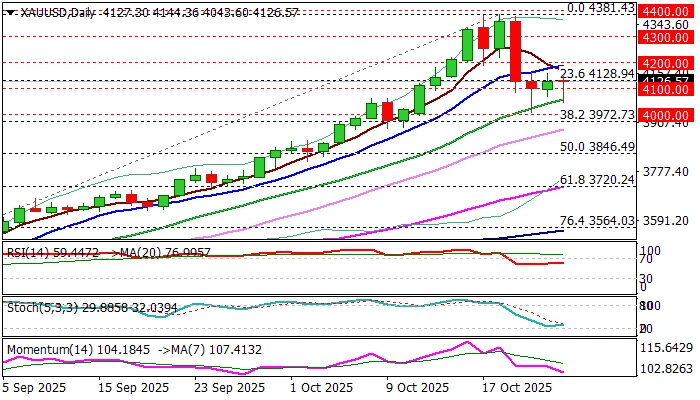
XAU/USD: Holds Above $4100 Following Limited Reaction on US CPI
Gold jumped after US inflation report which added to strong expectations for Fed rate cut next week, as inflation rose slightly less than expected in September.
However, September’s CPI numbers were insufficient to spark stronger rally, as economists expect full impact of import tariffs to show in coming months and stronger inflate prices.
Metal’s price remains within the range of past three days after critical $4000 support contained sharp sell-off from new record high, but recovery attempts were so far limited and holding well below upper triggers at $4200 zone (daily Tenkan-sen / psychological) which previously acted as one of key supports.
Hourly studies lack positive momentum and weighed by overbought conditions and recent formation of 100/200HMA bear-cross that so far limits upside potential.
Structure on daily chart shows weakening signals as positive momentum continues to fade, although larger bulls are expected to remain in play while the action stays above $4K.
Gold is on track for the first weekly loss after a steep uptrend in nine straight weeks which may add to initial signals of potential deeper pullback in case of loss of $4000 trigger.
Otherwise, it will continue to look like a healthy correction of larger uptrend, though with lift above $4200 required to signal that bears have found first ground and continue to regain control.
Traders shift their focus on next week’s Fed policy meeting and release of US PCE Index (Fed’s preferred inflation gauge) which would provide fresh direction signals.
Res: 4161; 4200; 4237; 4292
Sup: 4100; 4057; 4000; 3972
Fed Getting Closer to Cutting Rates? Inflation Weakens, but Risks Remain
- Cooling inflation boosts rate-cut hopes: U.S. CPI and core CPI both came in below expectations in September, fueling market bets that the Federal Reserve could cut interest rates as early as its next meeting, with another possible move in December.
- Markets rally on dovish expectations: Softer inflation data triggered gains across major U.S. stock indices, a drop in 10-year Treasury yields below 4%, and a weaker dollar against the euro.
- Risks and uncertainty remain: Despite easing price pressures, new tariffs, weak consumer sentiment, and potential data disruptions pose challenges for the Fed as it weighs balancing inflation control with supporting growth.
The September consumer inflation (CPI) report in the United States has provided markets with long-awaited signals of a potential shift in the Federal Reserve’s monetary policy. Both the headline CPI and its core measure came in below market expectations, increasing the likelihood of a rate cut at the upcoming Fed meeting — and possibly another one in December.
Inflation Weakens – CPI and Core CPI Below Forecasts
According to the published data, headline CPI rose by +0.3% month-on-month, compared to expectations of +0.4%, while core inflation — which excludes food and energy prices — increased by just 0.2%, the smallest gain in three months. On an annual basis, both indicators held steady at 3.0%, also below forecasts (3.1%).
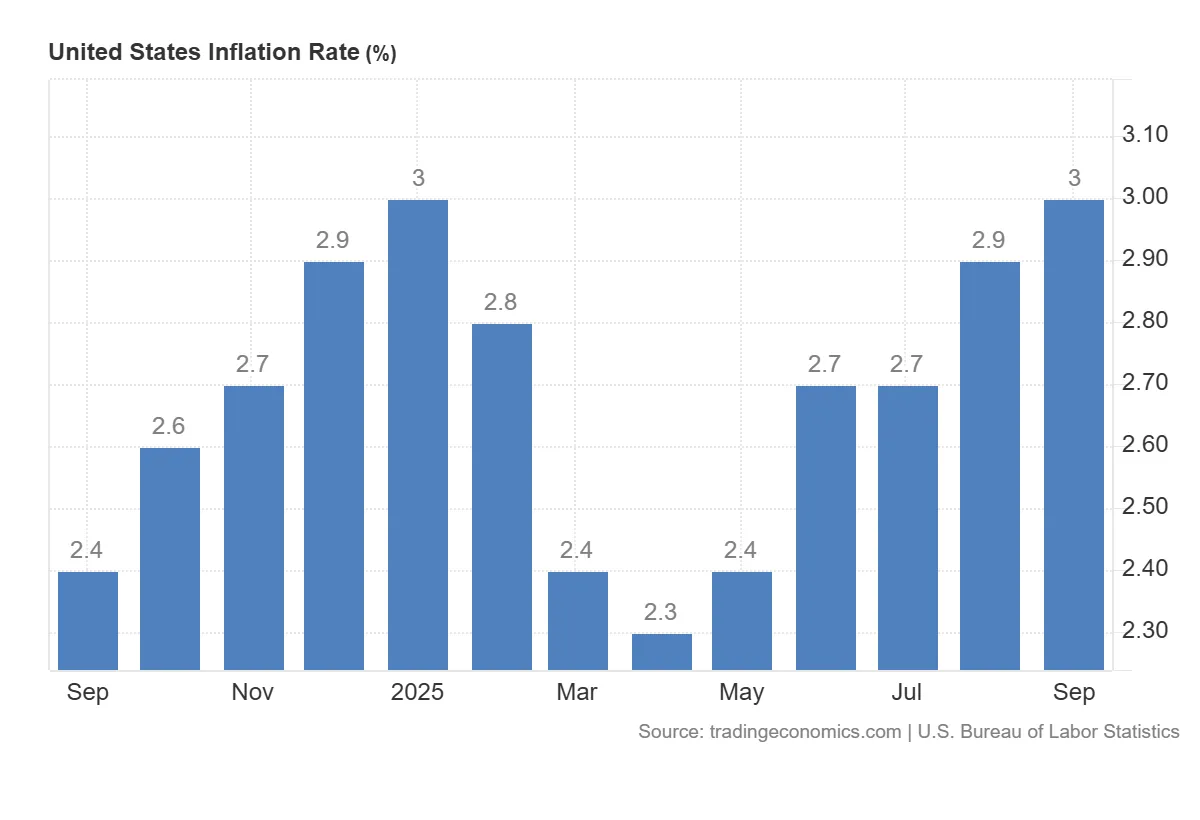
United States CPI, source: tradingeconomics.com
A particularly notable development was the slowdown in housing costs. The owners’ equivalent rent, a key component of services inflation, rose by only 0.1%, marking its slowest monthly increase since early 2021. This reading may be seen by the Fed as confirmation that previous rate hikes are effectively curbing price pressures in the economy.
Room for Rate Cuts – Market Prices in Easing
In light of these figures, market expectations for monetary policy have shifted significantly. Investors are now pricing in an almost certain 25-basis-point rate cut at the Fed’s next meeting. Moreover, the probability of a second cut in December has increased — particularly since a potential federal government shutdown could prevent the release of additional inflation data before year-end, making the September report even more crucial.
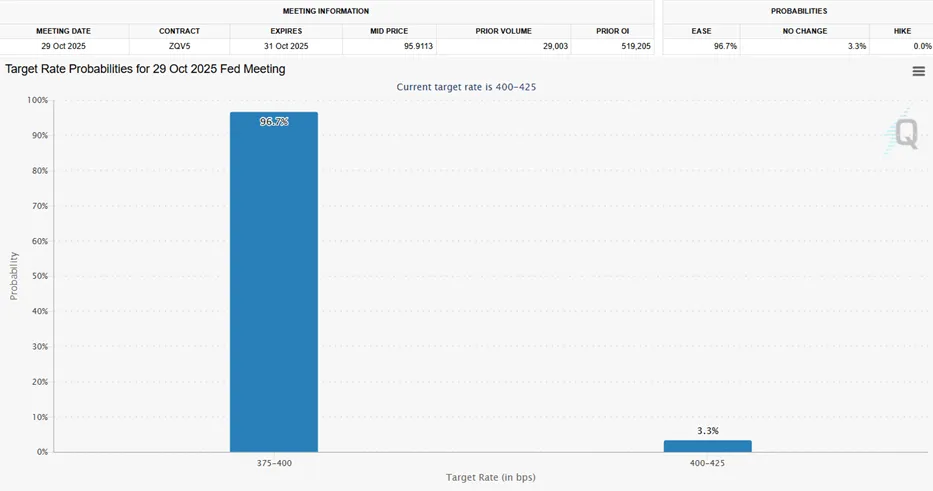
Probability of interest rate cuts based on 30 Day Federal Funds Futures, source: CME Group
Although inflation is cooling, risks to the price outlook remain. New tariffs announced by President Donald Trump — including on kitchen and upholstered furniture — could raise the prices of imported goods in the coming months. Companies such as Procter & Gamble and O’Reilly Automotive admit that while they are currently absorbing higher costs through margins, they will increasingly be forced to pass them on to consumers.
Market Reaction: Stock Rally, Lower Yields, Weaker Dollar
Lower inflation and rising expectations of a looser monetary policy had an immediate impact on financial markets. Major U.S. stock indices recorded strong gains:
- Dow Jones up 1.17%,
- Nasdaq 100 up 1.14%,
- S&P 500 up 0.89%.
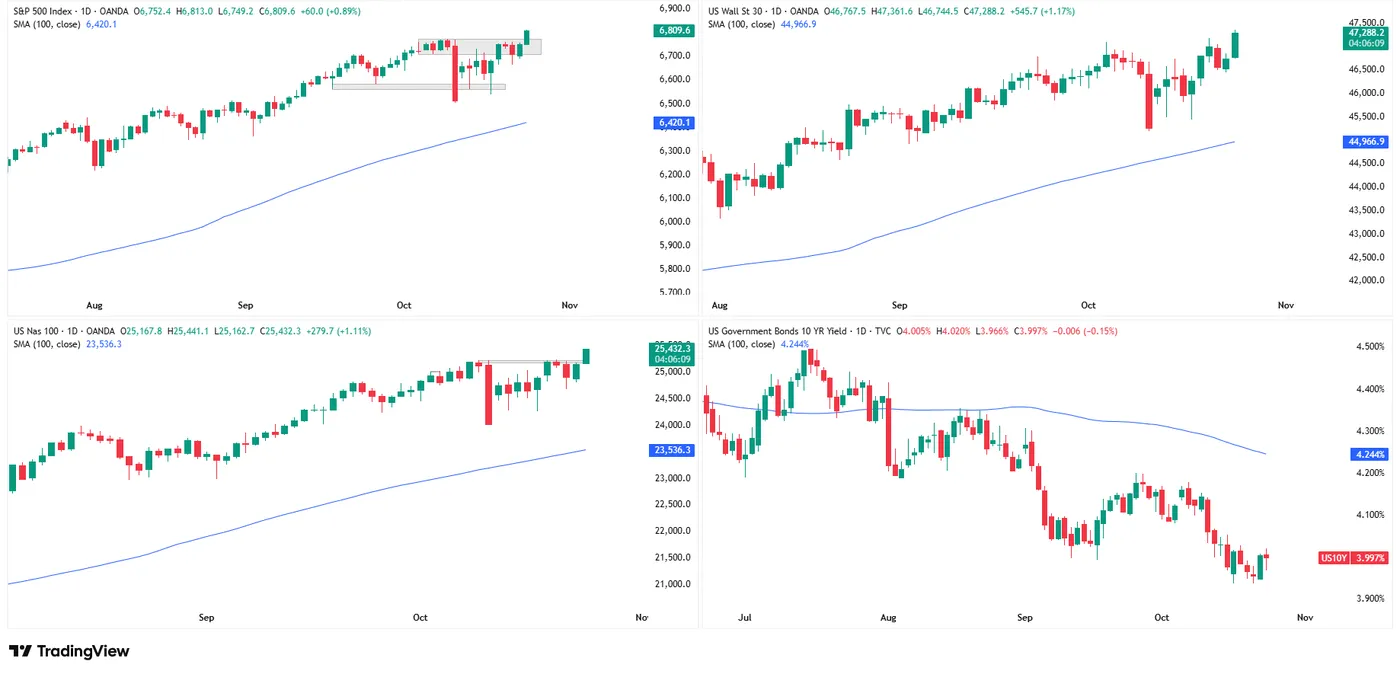
Daily chart of SP500, Dow Jones, NASDAQ100 and US10 yields, source: TradingView
Yields on 10-year Treasury bonds fell below the 4% level, signaling a shift in investor expectations about the future path of interest rates. Meanwhile, the U.S. dollar weakened, reflected in the EUR/USD exchange rate, which rebounded from 1.1580, which it reached on Wednesday. Whether these trends continue will depend on future Fed communications and potential confirmation of a rate cut decision.
Consumers Not Sharing the Optimism – Sentiment Weakens
It is worth noting, however, that despite market optimism, U.S. consumer sentiment has deteriorated. The University of Michigan index fell in October to 53.6 points, its lowest level in five months. Consumers continue to cite inflation and high living costs as their main sources of concern. Declining confidence could eventually weigh on consumption dynamics and, consequently, on the pace of economic growth.
Conclusions: Fed at a Crossroads – Markets Benefit, but Risks Persist
The September inflation data have clearly increased the likelihood of monetary easing by the Fed, already boosting equity indices and weakening the dollar against the euro. However, the Federal Reserve still faces the difficult task of balancing inflation control with support for the real economy.
New risks loom on the horizon — from protectionist tariffs and consumer uncertainty to the potential lack of further macroeconomic data due to government disruptions. In the coming weeks, not only the data itself but also the Fed’s communication and market reactions to every signal will be crucial for future movements on both Wall Street and the foreign exchange market.
Summary 10/27 – 10/31
Monday, Oct 27, 2025
| GMT | Ccy | Events | Consensus | Previous |
|---|---|---|---|---|
| 23:50 | JPY | Corporate Service Price Index Y/Y Sep | 2.70% | |
| 09:00 | EUR | Germany IFO Business Climate Oct | 87.8 | 87.7 |
| 09:00 | EUR | Germany IFO Current Assessment Oct | 85.5 | 85.7 |
| 09:00 | EUR | Germany IFO Expectations Oct | 89.7 | |
| 09:00 | EUR | Eurozone M3 Money Supply Y/Y Sep | 2.70% | 2.90% |
| GMT | Ccy | Events | |
|---|---|---|---|
| 23:50 | JPY | Corporate Service Price Index Y/Y Sep | |
| Forecast: | Previous: 2.70% | ||
| 09:00 | EUR | Germany IFO Business Climate Oct | |
| Forecast: 87.8 | Previous: 87.7 | ||
| 09:00 | EUR | Germany IFO Current Assessment Oct | |
| Forecast: 85.5 | Previous: 85.7 | ||
| 09:00 | EUR | Germany IFO Expectations Oct | |
| Forecast: | Previous: 89.7 | ||
| 09:00 | EUR | Eurozone M3 Money Supply Y/Y Sep | |
| Forecast: 2.70% | Previous: 2.90% | ||
Tuesday, Oct 28, 2025
| GMT | Ccy | Events | Consensus | Previous |
|---|---|---|---|---|
| 00:01 | GBP | BRC Shop Price Index Y/Y Oct | 1.60% | 1.40% |
| 07:00 | EUR | Germany GfK Consumer Confidence Nov | -22 | -22.3 |
| 13:00 | USD | S&P/CS Composite-20 HPI Y/Y Aug | 1.90% | 1.80% |
| 13:00 | USD | Housing Price Index M/M Aug | 0.10% | -0.10% |
| 14:00 | USD | Consumer Confidence Oct | 93.9 | 94.2 |
| GMT | Ccy | Events | |
|---|---|---|---|
| 00:01 | GBP | BRC Shop Price Index Y/Y Oct | |
| Forecast: 1.60% | Previous: 1.40% | ||
| 07:00 | EUR | Germany GfK Consumer Confidence Nov | |
| Forecast: -22 | Previous: -22.3 | ||
| 13:00 | USD | S&P/CS Composite-20 HPI Y/Y Aug | |
| Forecast: 1.90% | Previous: 1.80% | ||
| 13:00 | USD | Housing Price Index M/M Aug | |
| Forecast: 0.10% | Previous: -0.10% | ||
| 14:00 | USD | Consumer Confidence Oct | |
| Forecast: 93.9 | Previous: 94.2 | ||
Wednesday, Oct 29, 2025
| GMT | Ccy | Events | Consensus | Previous |
|---|---|---|---|---|
| 00:30 | AUD | Monthly CPI Y/Y Sep | 3% | |
| 00:30 | AUD | CPI Q/Q Q3 | 1.10% | 0.70% |
| 00:30 | AUD | CPI Y/Y Q3 | 3.00% | 2.10% |
| 00:30 | AUD | RBA Trimmed Mean CPI Q/Q Q3 | 0.60% | |
| 00:30 | AUD | RBA Trimmed Mean CPI Y/Y Q3 | 2.70% | |
| 05:00 | JPY | Consumer Confidence Oct | 35.6 | 35.3 |
| 09:00 | CHF | UBS Economic Expectations Oct | -46.4 | |
| 09:30 | GBP | Mortgage Approvals Sep | 64K | 65K |
| 09:30 | GBP | M4 Money Supply M/M Sep | 0.30% | 0.40% |
| 13:45 | CAD | BoC Interest Rate Decision | 2.25% | 2.50% |
| 14:00 | USD | Pending Home Sales M/M Sep | 4% | |
| 14:30 | CAD | BoC Press Conference | ||
| 14:30 | USD | Crude Oil Inventories (Oct 24) | -0.961M | |
| 18:00 | USD | Fed Interest Rate Decision | 4.00% | 4.25% |
| GMT | Ccy | Events | |
|---|---|---|---|
| 00:30 | AUD | Monthly CPI Y/Y Sep | |
| Forecast: | Previous: 3% | ||
| 00:30 | AUD | CPI Q/Q Q3 | |
| Forecast: 1.10% | Previous: 0.70% | ||
| 00:30 | AUD | CPI Y/Y Q3 | |
| Forecast: 3.00% | Previous: 2.10% | ||
| 00:30 | AUD | RBA Trimmed Mean CPI Q/Q Q3 | |
| Forecast: | Previous: 0.60% | ||
| 00:30 | AUD | RBA Trimmed Mean CPI Y/Y Q3 | |
| Forecast: | Previous: 2.70% | ||
| 05:00 | JPY | Consumer Confidence Oct | |
| Forecast: 35.6 | Previous: 35.3 | ||
| 09:00 | CHF | UBS Economic Expectations Oct | |
| Forecast: | Previous: -46.4 | ||
| 09:30 | GBP | Mortgage Approvals Sep | |
| Forecast: 64K | Previous: 65K | ||
| 09:30 | GBP | M4 Money Supply M/M Sep | |
| Forecast: 0.30% | Previous: 0.40% | ||
| 13:45 | CAD | BoC Interest Rate Decision | |
| Forecast: 2.25% | Previous: 2.50% | ||
| 14:00 | USD | Pending Home Sales M/M Sep | |
| Forecast: | Previous: 4% | ||
| 14:30 | CAD | BoC Press Conference | |
| Forecast: | Previous: | ||
| 14:30 | USD | Crude Oil Inventories (Oct 24) | |
| Forecast: | Previous: -0.961M | ||
| 18:00 | USD | Fed Interest Rate Decision | |
| Forecast: 4.00% | Previous: 4.25% | ||
Thursday, Oct 30, 2025
| GMT | Ccy | Events | Consensus | Previous |
|---|---|---|---|---|
| JPY | BoJ Interest Rate Decision | 0.50% | 0.50% | |
| 00:00 | NZD | ANZ Business Confidence Oct | 49.6 | |
| 00:00 | NZD | ANZ Activity Outlook Oct | 43.4 | |
| 00:30 | AUD | Import Price Index Q/Q Q3 | -0.80% | |
| 07:45 | EUR | France GDP Q/Q Q3 P | 0.20% | 0.30% |
| 08:00 | CHF | KOF Economic Barometer Oct | 99 | 98 |
| 08:55 | EUR | Germany Unemployment Change Sep | 10K | 14K |
| 08:55 | EUR | Germany Unemployment RateSep | 6.30% | 6.30% |
| 09:00 | EUR | Germany GDP Q/Q Q3 P | 0.00% | -0.30% |
| 10:00 | EUR | Eurozone GDP Q/Q Q3 P | 0.10% | 0.10% |
| 10:00 | EUR | Eurozone Unemployment Rate Sep | 6.30% | 6.30% |
| 10:00 | EUR | Eurozone Economic Sentiment Indicator Oct | 95.7 | 95.5 |
| 10:00 | EUR | Eurozone Industrial Confidence Oct | -9.8 | -10.3 |
| 10:00 | EUR | Eurozone Services Sentiment Oct | 3.7 | 3.6 |
| 10:00 | EUR | Eurozone Consumer Confidence Oct F | -14.2 | -14.2 |
| 13:00 | EUR | Germany CPI M/M Oct P | 0.20% | 0.20% |
| 13:00 | EUR | Germany CPI Y/Y Oct P | 2.20% | 2.40% |
| 13:15 | EUR | ECB Rate On Deposit Facility | 2.00% | 2.00% |
| 13:15 | EUR | ECB Main Refinancing Rate | 2.15% | 2.15% |
| 14:30 | USD | Natural Gas Storage (Oct 24) | 87B | |
| 23:30 | JPY | Tokyo CPI Y/Y Oct | 2.50% | |
| 23:30 | JPY | Tokyo CPI Core Y/Y Oct | 2.60% | 2.50% |
| 23:30 | JPY | Tokyo CPI Core-Core Y/Y Oct | 2.50% | |
| 23:30 | JPY | Unemployment Rate Sep | 2.50% | 2.60% |
| 23:50 | JPY | Industrial Production M/M Sep P | 1.60% | -1.50% |
| 23:50 | JPY | Retail Trade Y/Y Sep | 0.70% | -1.10% |
| GMT | Ccy | Events | |
|---|---|---|---|
| JPY | BoJ Interest Rate Decision | ||
| Forecast: 0.50% | Previous: 0.50% | ||
| 00:00 | NZD | ANZ Business Confidence Oct | |
| Forecast: | Previous: 49.6 | ||
| 00:00 | NZD | ANZ Activity Outlook Oct | |
| Forecast: | Previous: 43.4 | ||
| 00:30 | AUD | Import Price Index Q/Q Q3 | |
| Forecast: | Previous: -0.80% | ||
| 07:45 | EUR | France GDP Q/Q Q3 P | |
| Forecast: 0.20% | Previous: 0.30% | ||
| 08:00 | CHF | KOF Economic Barometer Oct | |
| Forecast: 99 | Previous: 98 | ||
| 08:55 | EUR | Germany Unemployment Change Sep | |
| Forecast: 10K | Previous: 14K | ||
| 08:55 | EUR | Germany Unemployment RateSep | |
| Forecast: 6.30% | Previous: 6.30% | ||
| 09:00 | EUR | Germany GDP Q/Q Q3 P | |
| Forecast: 0.00% | Previous: -0.30% | ||
| 10:00 | EUR | Eurozone GDP Q/Q Q3 P | |
| Forecast: 0.10% | Previous: 0.10% | ||
| 10:00 | EUR | Eurozone Unemployment Rate Sep | |
| Forecast: 6.30% | Previous: 6.30% | ||
| 10:00 | EUR | Eurozone Economic Sentiment Indicator Oct | |
| Forecast: 95.7 | Previous: 95.5 | ||
| 10:00 | EUR | Eurozone Industrial Confidence Oct | |
| Forecast: -9.8 | Previous: -10.3 | ||
| 10:00 | EUR | Eurozone Services Sentiment Oct | |
| Forecast: 3.7 | Previous: 3.6 | ||
| 10:00 | EUR | Eurozone Consumer Confidence Oct F | |
| Forecast: -14.2 | Previous: -14.2 | ||
| 13:00 | EUR | Germany CPI M/M Oct P | |
| Forecast: 0.20% | Previous: 0.20% | ||
| 13:00 | EUR | Germany CPI Y/Y Oct P | |
| Forecast: 2.20% | Previous: 2.40% | ||
| 13:15 | EUR | ECB Rate On Deposit Facility | |
| Forecast: 2.00% | Previous: 2.00% | ||
| 13:15 | EUR | ECB Main Refinancing Rate | |
| Forecast: 2.15% | Previous: 2.15% | ||
| 14:30 | USD | Natural Gas Storage (Oct 24) | |
| Forecast: | Previous: 87B | ||
| 23:30 | JPY | Tokyo CPI Y/Y Oct | |
| Forecast: | Previous: 2.50% | ||
| 23:30 | JPY | Tokyo CPI Core Y/Y Oct | |
| Forecast: 2.60% | Previous: 2.50% | ||
| 23:30 | JPY | Tokyo CPI Core-Core Y/Y Oct | |
| Forecast: | Previous: 2.50% | ||
| 23:30 | JPY | Unemployment Rate Sep | |
| Forecast: 2.50% | Previous: 2.60% | ||
| 23:50 | JPY | Industrial Production M/M Sep P | |
| Forecast: 1.60% | Previous: -1.50% | ||
| 23:50 | JPY | Retail Trade Y/Y Sep | |
| Forecast: 0.70% | Previous: -1.10% | ||
Friday, Oct 31, 2025
| GMT | Ccy | Events | Consensus | Previous |
|---|---|---|---|---|
| 00:30 | AUD | Private Sector Credit M/M Sep | 0.60% | 0.60% |
| 00:30 | AUD | PPI Q/Q Q3 | 0.80% | 0.70% |
| 01:30 | CNY | NBS Manufacturing PMI Oct | 49.7 | 49.8 |
| 01:30 | CNY | NBS Non-Manufacturing PMI Oct | 50.2 | 50 |
| 05:00 | JPY | Housing Starts Y/Y Sep | -7.90% | -9.80% |
| 07:00 | EUR | Germany Import Price Index M/M Sep | -0.10% | -0.50% |
| 07:00 | EUR | Germany Retail Sales M/M Sep | 0.30% | -0.20% |
| 07:30 | CHF | Real Retail Sales Y/Y Sep | 0.20% | -0.20% |
| 10:00 | EUR | Eurozone CPI Y/Y Oct P | 2.10% | 2.20% |
| 10:00 | EUR | Eurozone Core CPI Y/Y Oct P | 2.30% | 2.40% |
| 12:30 | CAD | GDP M/M Aug | 0.00% | 0.20% |
| 13:45 | USD | Chicago PMI Oct | 42 | 40.6 |
| GMT | Ccy | Events | |
|---|---|---|---|
| 00:30 | AUD | Private Sector Credit M/M Sep | |
| Forecast: 0.60% | Previous: 0.60% | ||
| 00:30 | AUD | PPI Q/Q Q3 | |
| Forecast: 0.80% | Previous: 0.70% | ||
| 01:30 | CNY | NBS Manufacturing PMI Oct | |
| Forecast: 49.7 | Previous: 49.8 | ||
| 01:30 | CNY | NBS Non-Manufacturing PMI Oct | |
| Forecast: 50.2 | Previous: 50 | ||
| 05:00 | JPY | Housing Starts Y/Y Sep | |
| Forecast: -7.90% | Previous: -9.80% | ||
| 07:00 | EUR | Germany Import Price Index M/M Sep | |
| Forecast: -0.10% | Previous: -0.50% | ||
| 07:00 | EUR | Germany Retail Sales M/M Sep | |
| Forecast: 0.30% | Previous: -0.20% | ||
| 07:30 | CHF | Real Retail Sales Y/Y Sep | |
| Forecast: 0.20% | Previous: -0.20% | ||
| 10:00 | EUR | Eurozone CPI Y/Y Oct P | |
| Forecast: 2.10% | Previous: 2.20% | ||
| 10:00 | EUR | Eurozone Core CPI Y/Y Oct P | |
| Forecast: 2.30% | Previous: 2.40% | ||
| 12:30 | CAD | GDP M/M Aug | |
| Forecast: 0.00% | Previous: 0.20% | ||
| 13:45 | USD | Chicago PMI Oct | |
| Forecast: 42 | Previous: 40.6 | ||
October Flashlight for the FOMC Blackout Period: Data Vacuum Clouds the Outlook
Summary
- We expect the FOMC to announce another 25 bps rate cut at the conclusion of its meeting on October 29. The government shutdown has clouded the U.S. economic outlook as most government data releases are currently delayed. The limited data that have been released suggest that gradual labor market softening has continued alongside inflation that is running at roughly a 3% underlying pace.
- We believe the shutdown is having a small but negative impact on the U.S. economy. The rule-of-thumb that each week of the shutdown shaves off 0.1-0.2 percentage points of quarterly economic growth still strikes us as reasonable. Most—though not all—of this output should be recouped in Q1, assuming that the shutdown has ended by then. If the shutdown drags on much longer, key economic data covering the month of October may be outright skipped rather than merely delayed, making it harder for policymakers to assess the state of the economy in real-time.
- Against this backdrop, several key FOMC officials have signaled support for another rate cut in October. However, public comments from FOMC officials generally have been careful to acknowledge that rate cuts past October are not guaranteed.
- We do not expect any major changes to the language in the post-meeting policy statement and expect Chair Powell's press conference remarks to echo the sentiment from his public remarks on October 14: inching toward neutral, but cognizant of the two-sided risks to the outlook given the current tension between their employment and inflation goals. There will not be an update to the Summary of Economic Projections at this meeting.
- Changes to the Fed's balance sheet runoff program also appear to be coming soon. Chair Powell suggested that runoff may end in the "coming months" in a recent speech. A wide range of indicators suggest this would be a prudent move, in our view. There has been a firming in repo rates recently in a sign that bank reserves are closer to ample than abundant. Furthermore, key thresholds have been reached or are close to being hit for the reserves-to-GDP rand reserves-to-bank assets ratios.
- Our longstanding forecast has been that the FOMC would announce the end of QT at its meeting on December 9-10, with balance sheet shrinkage ceasing after December 31. We are sticking with that forecast as a base case, although we acknowledge that it is a close call and the Committee may opt to end QT at the October meeting.
- If QT runs through year-end, the Fed's balance sheet will have declined by just shy of $2.5 trillion from its peak in the spring of 2022. We estimate the reduction in the central bank's security holdings has exerted 25-50 bps of upward pressure on long-term interest rates.
- Note that even if aggregate balance sheet runoff ceases, that does not mean that balance sheet policy has shifted to neutral. If the Fed's balance sheet is held flat for a couple quarters, then it will still be shrinking as a share of GDP. Furthermore, the composition of the balance sheet can continue to evolve such that policy accommodation is still being removed. We look for MBS runoff to continue indefinitely, with these securities replaced one-for-one with Treasury bills. If realized, this would gradually reduce support to the mortgage market from the Fed's balance sheet and put some very modest upward pressure on longer-term yields, all else equal.
Another Cut Coming in October
It has been a strange five weeks since the FOMC last met on September 17. At that meeting, the FOMC reduced the federal funds rate by 25 bps—its first rate move since December 2024. The dot plot showed a median projection of two more 25 bps rate cuts by year-end, although it was a close call; nine of the 19 participants looked for one or zero rate cuts at the final two meetings of the year. Shortly thereafter, the federal government shut down on October 1, and this created an economic data vacuum. The September employment report, scheduled to be released on October 3, has been indefinitely delayed. Many other key data releases, from housing starts to job openings to retail sales, have been delayed as well.
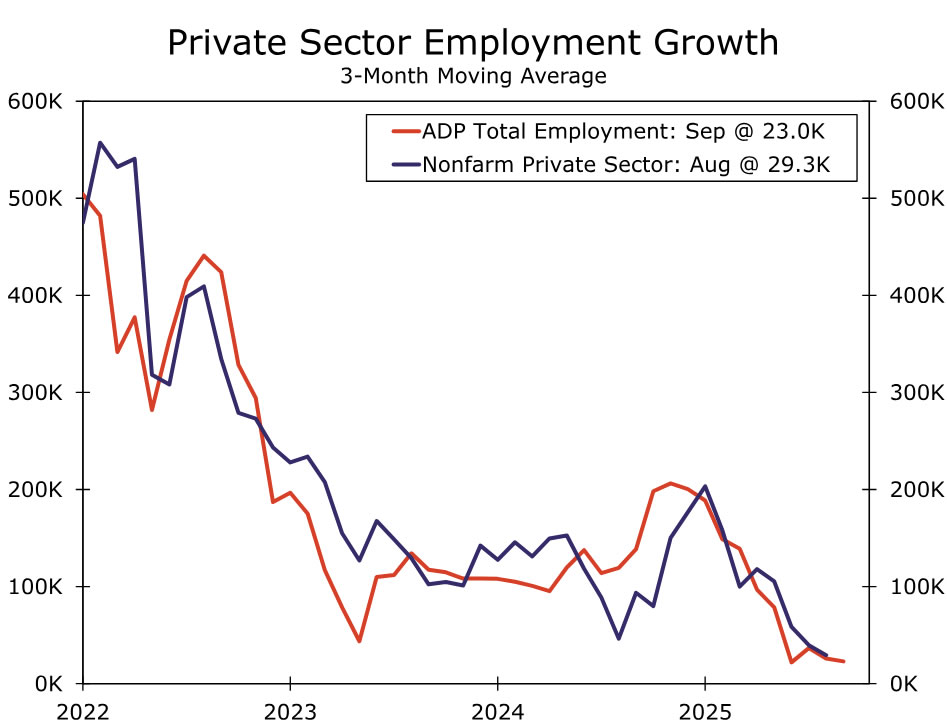
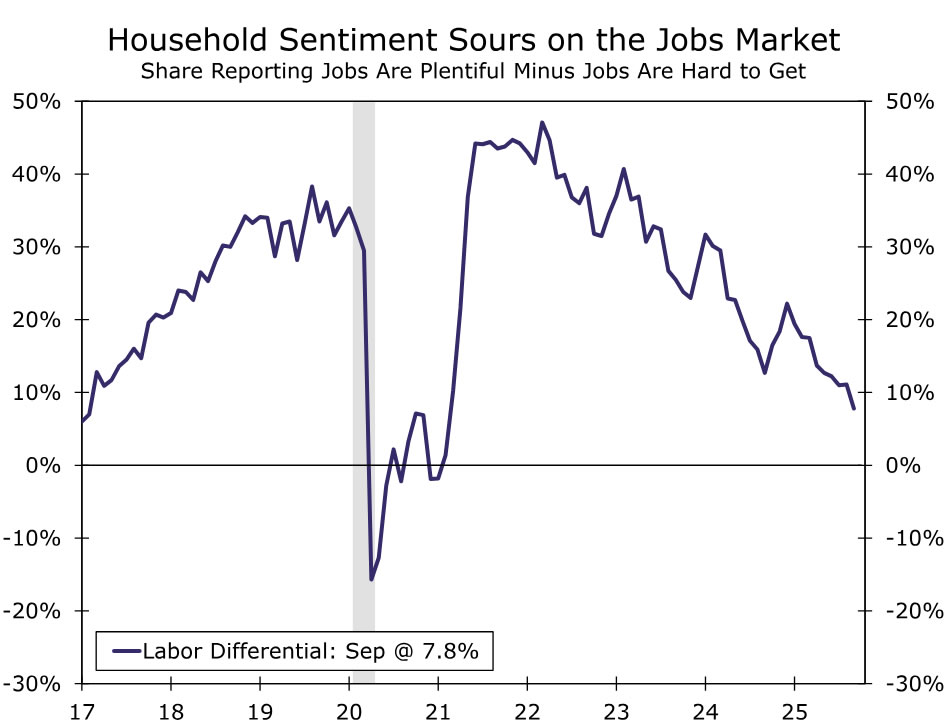
The limited data that we have received since the FOMC's last meeting suggest that the macro trends that were in place before the shutdown are still entrenched. The labor market news has been consistent with further gradual softening. ADP's measure of total private sector employment declined by 32K in September, the weakest reading since March 2023. With August's downwardly-revised ADP reading now sitting at -3K, the three-month moving average has fallen to just 23K (Figure 1), and monthly job growth has posted back-to-back negative readings for the first time since 2020. The Chicago Fed's Labor Market Indicators release estimated the September unemployment rate at 4.34%, a couple basis points above the actual reading in August. Encouragingly, state level data on initial jobless claims suggest layoffs have been relatively flat in recent weeks, but household sentiment about job availability deteriorated further last month (Figure 2).
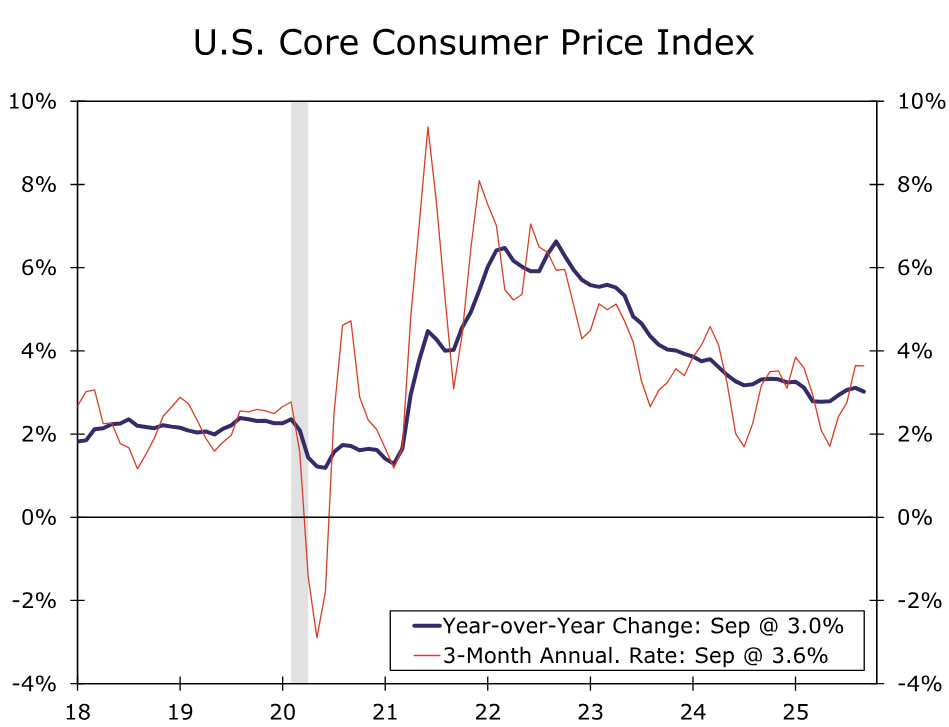
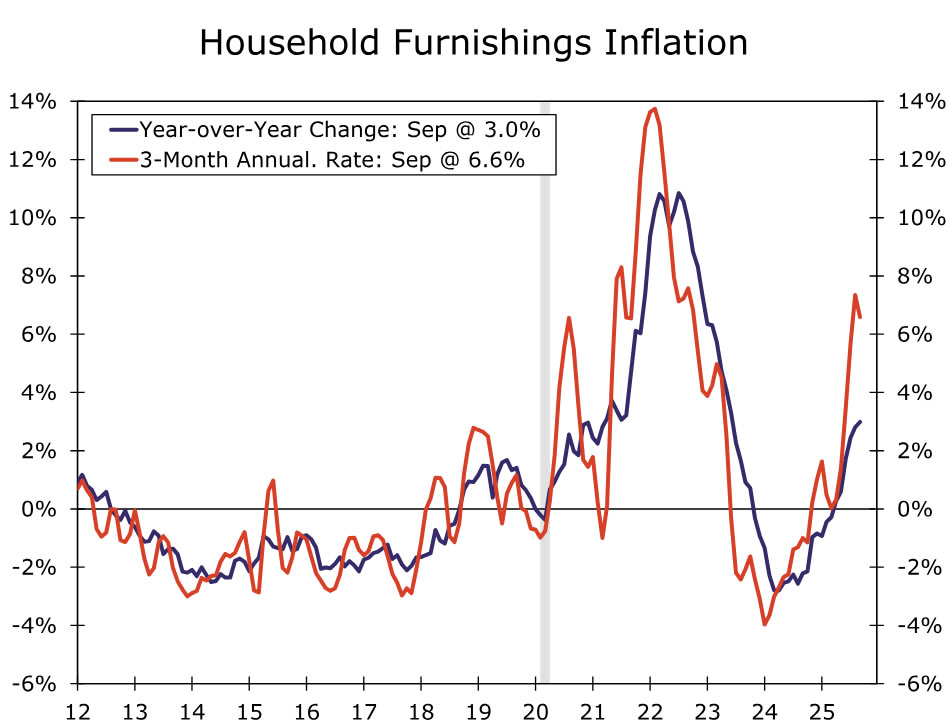
On the inflation front, the September CPI report was released on October 24, nine days after its originally scheduled date. The catalyst to publish the September CPI stemmed from the need for the Social Security Administration to prepare the annual cost of living adjustment for beneficiaries. Because data collection for the September CPI had largely been completed before the shutdown began on October 1, the BLS was able to compile and release the report. It showed inflation that remains uncomfortably above the central bank's target. Headline CPI rose 3.0% year-over-year, the highest since January. The core CPI ebbed to 3.0% year-over-year, but the hotter 3.6% three-month annualized rate signals that prices accelerated in the third quarter (Figure 3). Higher prices continue to flow through to many tariff-related items in a sign that the price pressures from this year's new import duties are still making their way into the economy (Figure 4).
Beyond the data implications, we believe the shutdown is having a small but negative impact on the U.S. economy. At least 700K federal government workers have been furloughed without pay, while the remainder of the 2.3 million federal civilian workforce is still working—although also without pay. The rule-of-thumb that each week of the shutdown shaves off 0.1-0.2 percentage points of quarterly economic growth still strikes us as reasonable. Most—though not all—of this output should be recouped in Q1, assuming that the shutdown has ended by then. For further reading on the shutdown's impact, see our recent special report.
Against this backdrop, FOMC participants generally have signaled support for another 25 bps rate cut at the October meeting. Speaking on October 14, Chair Powell stated that "the outlook for employment and inflation does not appear to have changed much since our September meeting four weeks ago." Governor Waller stated in a speech on October 16 that he supports a 25 bps rate cut to support the labor market. Federal Reserve Bank of Boston President and current FOMC voter Susan Collins shared her view that "with inflation risks somewhat more contained, but greater downside risks to employment, it seems prudent to normalize policy a bit further this year to support the labor market." Comments from newly-appointed Governor Miran suggests he will once again vote for a 50 bps rate cut at the upcoming meeting. However, the public comments from FOMC officials generally have been careful to acknowledge that rate cuts past October are not guaranteed. A case in point: Governor Waller's October 16 talk was titled "Cutting Rates in the Face of Conflicting Data," a nod to the softer labor market, stronger real GDP growth and above-target inflation regime in which the FOMC finds itself.
Our expectation is that the FOMC will cut the federal funds rate by 25 bps at the October meeting. We do not expect any major changes to the language in the post-meeting policy statement, and in the press conference, we expect Chair Powell's remarks to echo the sentiment from his public remarks on October 14: inching toward neutral, but cognizant of the two-sided risks to the outlook given the current tension between their employment and inflation goals. Beyond October, we look for another 25 bps rate cut at the December meeting, and then we expect the FOMC to move to an every-other-meeting approach for rate cuts. We project two more 25 bps rate cuts in March and June 2026, followed by a long hold at 3.00%-3.25% for the federal funds rate.
QT Is Nearing the Finish Line
Changes to the Federal Reserve's balance sheet runoff program appear to be coming soon. At present, the Federal Reserve is reducing the size of its balance sheet through passive runoff, commonly referred to as quantitative tightening (QT). Treasury security runoff is subject to a cap of $5 billion per month, while mortgage-backed security (MBS) runoff is subject to a cap of $35 billion per month. In practice, MBS runoff has been averaging roughly $17 billion per month, so total QT has been a bit more than $20 billion per month on average.
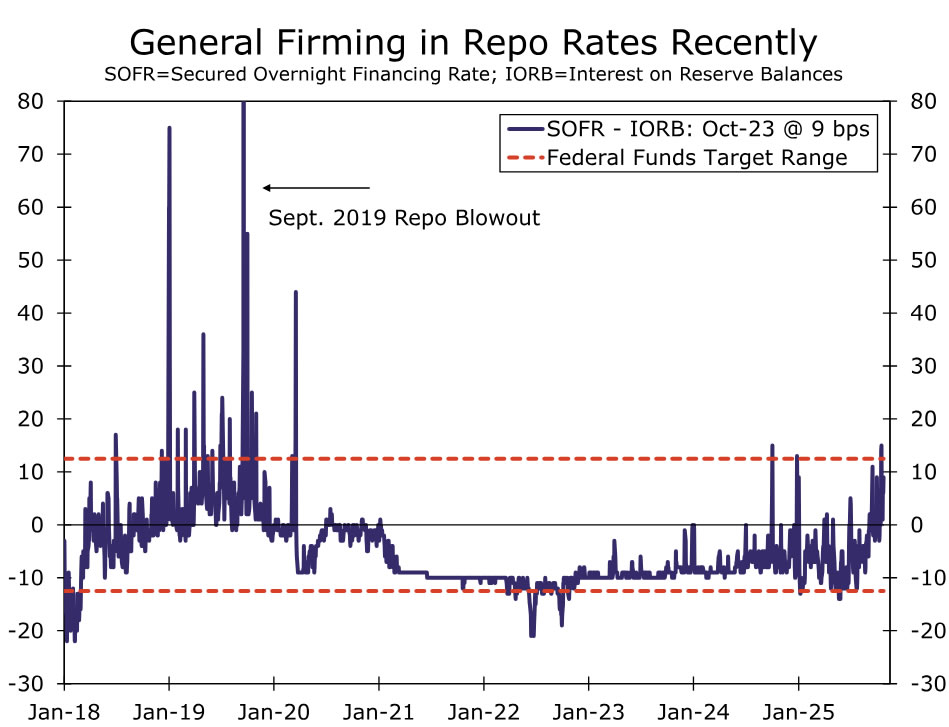
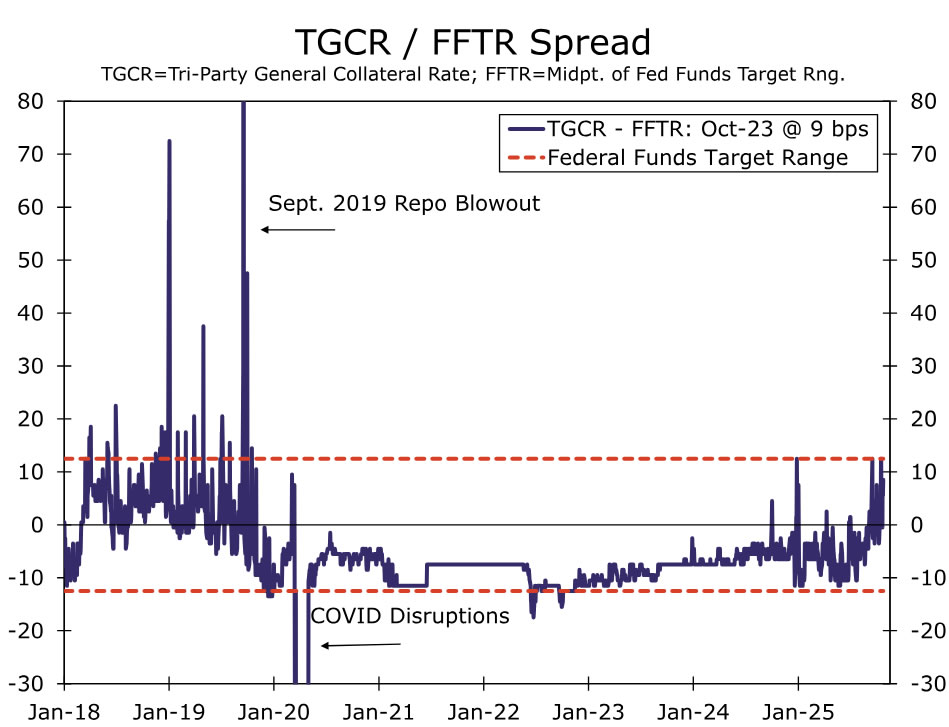
The core of Chair Powell's October 14 speech was focused on the outlook for the balance sheet. In Chair Powell's words, the Fed's "long-stated plan is to stop balance sheet runoff when reserves are somewhat above the level we judge consistent with ample reserve conditions. We may approach that point in coming months, and we are closely monitoring a wide range of indicators to inform this decision." A wide range of evidence has begun to build that bank reserves are closer to ample than abundant. There has been a general firming in repo rates since the end of the summer, with SOFR trading comfortably above IORB and the tri-party general collateral rate (TGCR) testing the upper-bound of the fed funds target range (Figures 5 and 6). It was the latter rate that Federal Reserve Bank of Dallas President Lorie Logan recently suggested as a future replacement for the federal funds rate as the central bank's target interest rate.
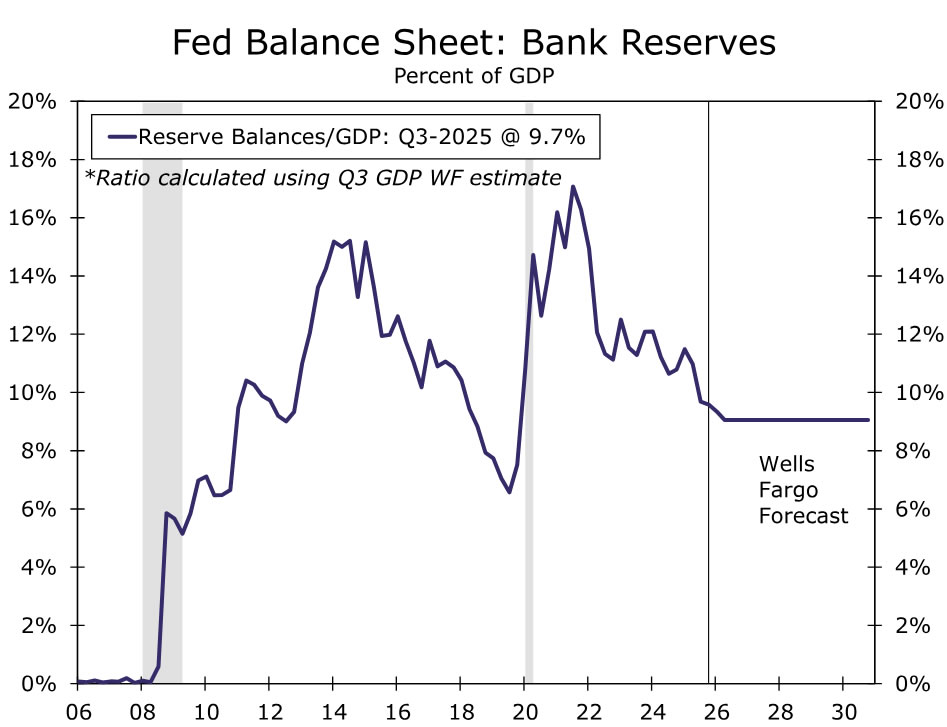
Looking beyond the recent moves in money market rates, past research on this topic also points to reserves becoming less abundant, even if they are not yet scarce. In a speech given on July 10, Governor Waller cited a bank reserves-to-GDP ratio of 9% as "the threshold below which reserves would not be ample." We estimate this ratio was 9.7% at the end of Q3, so not quite to Governor Waller's yardstick, but getting close. Research co-authored by Federal Reserve Bank of New York President John Williams cites a reserves-to-bank assets ratio of 12%-13% as another key threshold to monitor, and this level has been approximately reached.1
Our longstanding forecast has been that the FOMC would announce the end of QT at its meeting on December 9-10, with balance sheet shrinkage ceasing after December 31. We are sticking with that forecast as a base case, although we acknowledge that it is a close call and the Committee may opt to end QT at the October meeting. Although there has been some unexpected pressure and volatility in repo markets recently, it generally has been more mild than what occurred on the worst days of 2019 even when excluding the September repo blowup of that year (refer back to Figures 5 and 6). The Standing Repo Facility (SRF) is also in place to serve as a backstop (albeit an imperfect one) to the market which was not the case in 2019. Chair Powell's remarks on October 14 that QT may end in the "coming months" do not necessarily point to an immediate end to balance sheet runoff. Furthermore, we suspect the Committee will want to take a meeting to discuss what comes next for the balance sheet regarding its security composition.
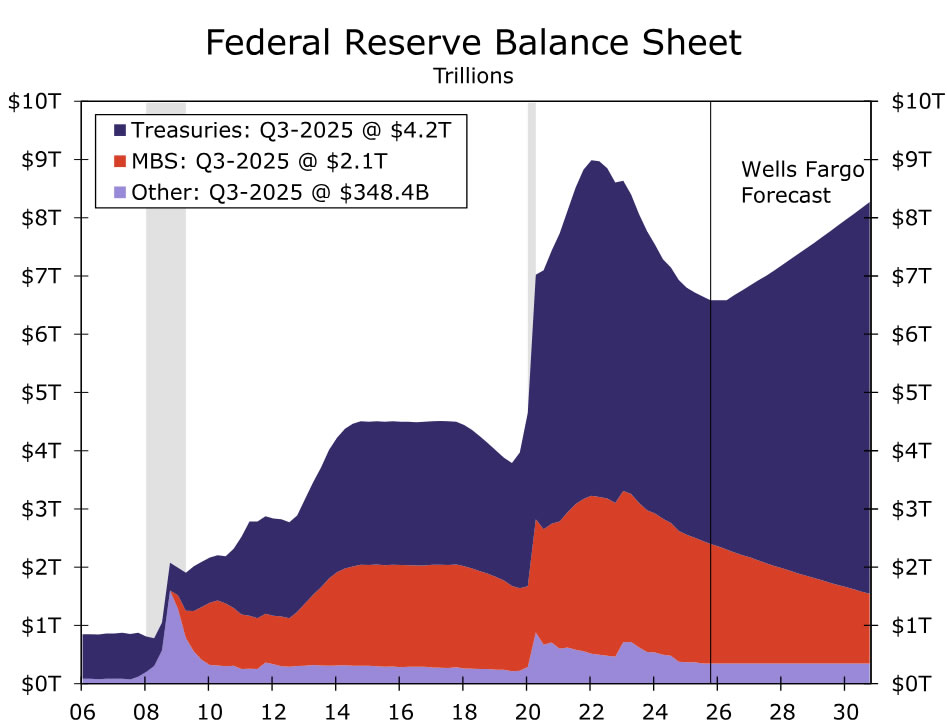
If QT runs through year-end, the Fed's balance sheet will have declined by just shy of $2.5 trillion from its peak in the spring of 2022, a reduction in the central bank's security holdings that we estimate has exerted 25-50 bps of upward pressure on long-term interest rates.2 Note that even if aggregate balance sheet runoff ceases, that does not mean that balance sheet policy has shifted to neutral. If the Fed's balance sheet is held flat for an extended period of time, then it will still be shrinking as a share of GDP. Bank reserves will continue to decline gradually and in proportion to the growth in non-reserve liabilities on the Fed's balance sheet, such as currency in circulation.
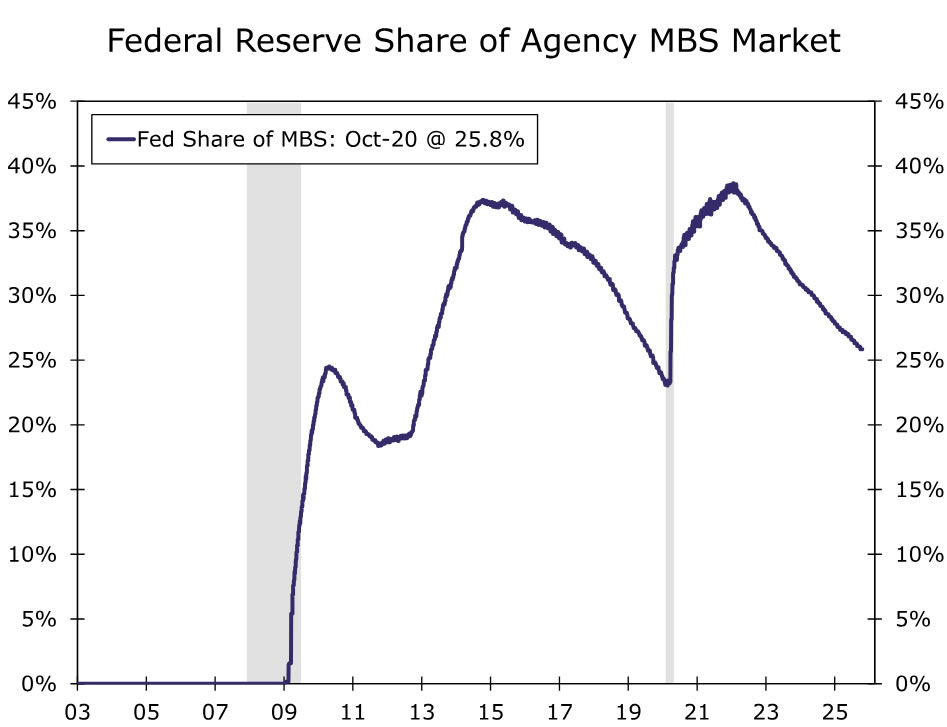
Furthermore, the composition of the balance sheet can continue to evolve such that policy accommodation is still being removed. We look for MBS runoff to continue indefinitely as the Federal Reserve strives to reduce its mortgage holdings and slowly return to holding primarily Treasury securities. In order to keep the total size of the balance sheet unchanged amid ongoing MBS runoff, we look for the Federal Reserve to start buying Treasury securities such that they replace MBS paydowns one-for-one. Returning to a primarily Treasury security portfolio would reduce the support that the central bank lends to the mortgage market. The Federal Reserve's share of the agency MBS market has not been below 20% since the early 2010s, but this should be within reach in a few years if MBS runoff continues (Figure 9).
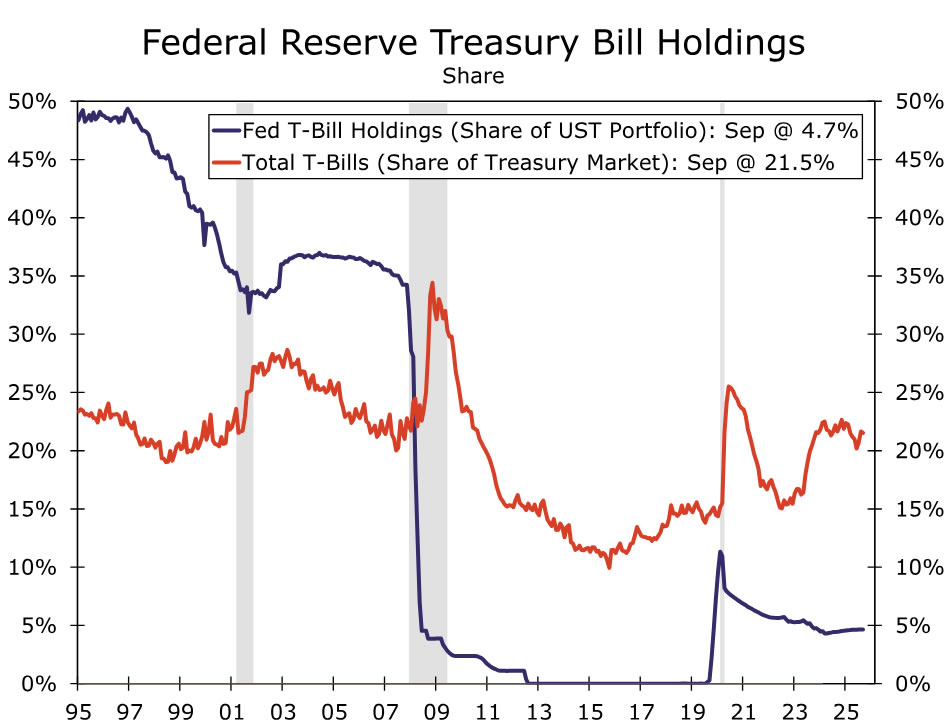
Another factor to consider is the weighted-average maturity of the central bank's Treasury security holdings. At present, the Federal Reserve's security holdings generally skew longer-dated than the overall Treasury market. The Federal Reserve T-bill holdings comprise just 5% of its Treasury security holdings despite T-bills accounting for roughly 22% of the overall Treasury market (Figure 10). Our base case is that the Federal Reserve will purchase Treasury bills to replace MBS as holdings of the latter continue to decline. Slowly replacing MBS with T-bills would reweight the Fed's balance sheet away from longer-dated securities and toward shorter-dated securities, putting some very modest upward pressure on longer-term yields, all else equal.
Endnotes
1 – Afonso, Gara, Domenico Giannone, Gabriele La Spada and John C. Williams. May 2025. "Scarce, Abundant, or Ample? A Time-Varying Model of the Reserve Demand Curve." Federal Reserve Bank of New York.
2 – Federal Reserve Bank of New York, March 2024. Survey of Primary Dealers; Crawley, Edmund, Etienne Gagnon, James Hebden and James Trevino. June 2022. "Substitutability between Balance Sheet Reductions and Policy Rate Hikes: Some Illustrations and a Discussion." Federal Reserve Board; Wei, Bin. July 2022. "How Many Rate Hikes Does Quantitative Tightening Equal?" Federal Reserve Bank of Atlanta; Gulati, Chaitri and A. Lee Smith. November 2022. "The Evolving Role of the Fed's Balance Sheet: Effects and Challenges." Federal Reserve Bank of Kansas City.
Forward Guidance: BoC to Cut Before a Flat GDP Print for Canada in August
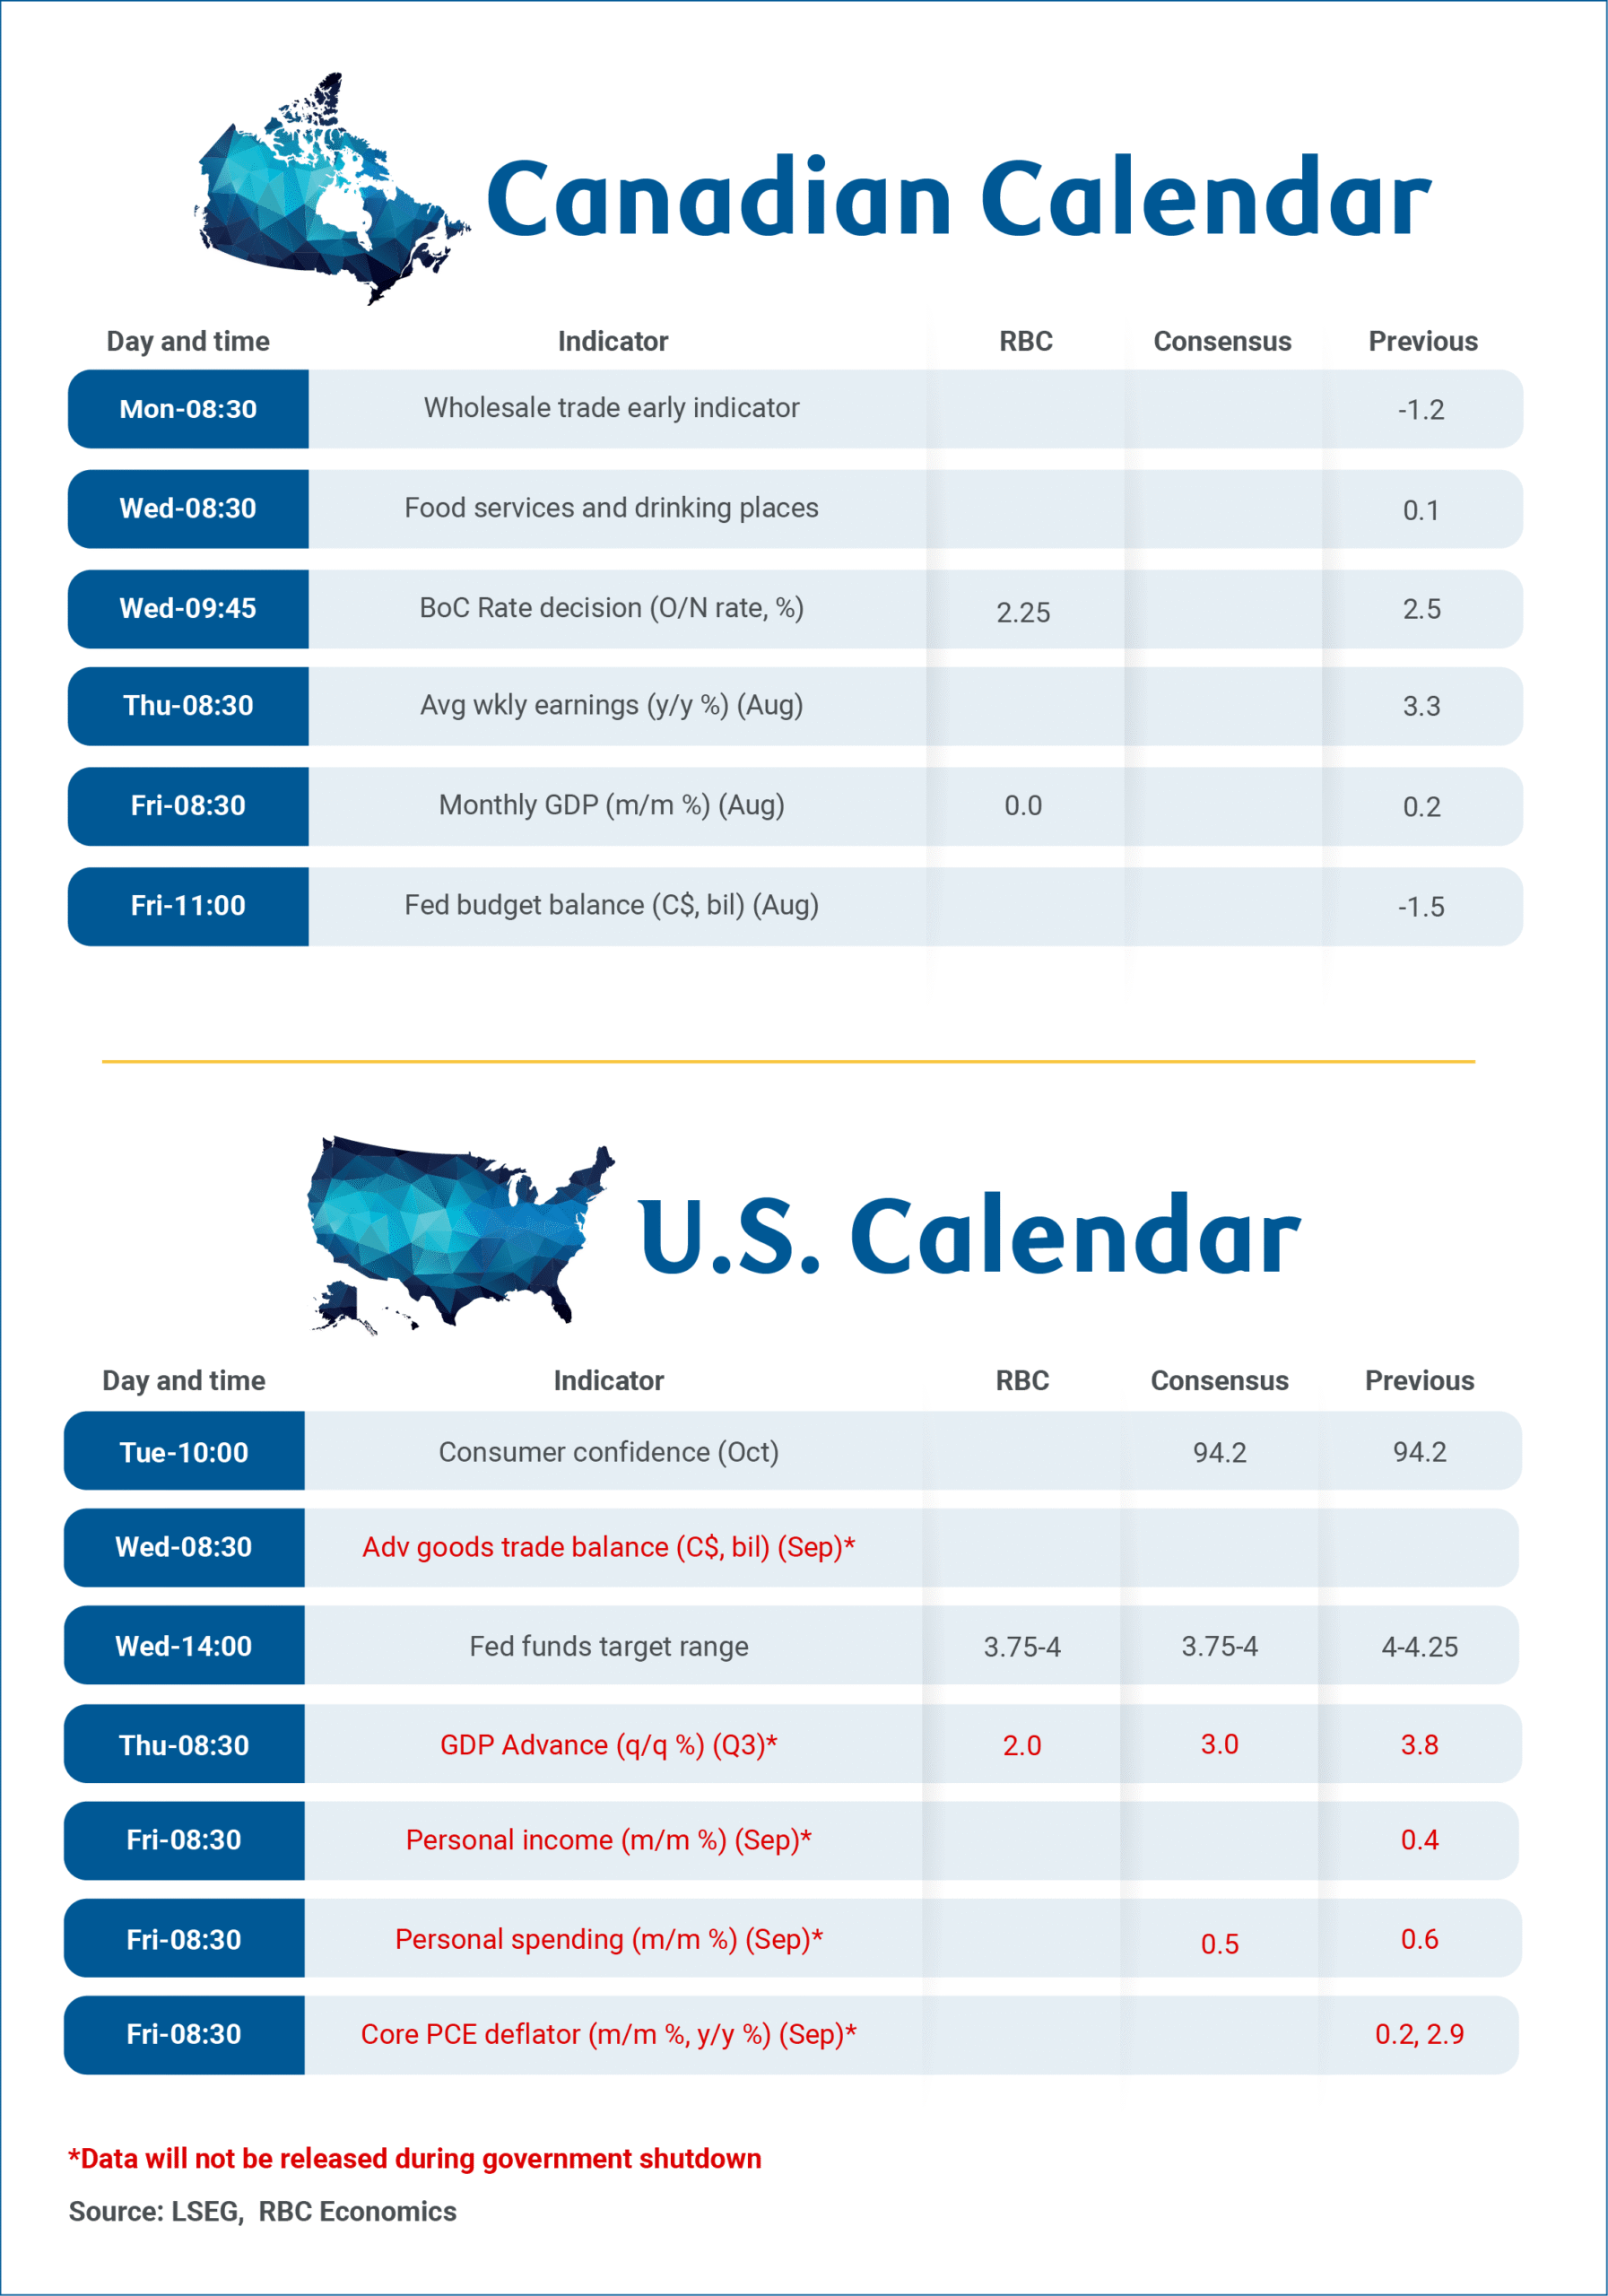
The U.S. Federal Reserve and Bank of Canada are both expected to cut policy rates on Wednesday, adding to 25 basis point reductions from each in September.
Another reduction from the U.S. Federal Reserve is widely expected – the Fed’s policy rate is starting from a higher, more restrictive, level than other central banks after cutting less since 2024, making it easier to justify additional reductions. And U.S. labour markets have been softening. The U.S. unemployment rate has edged higher with employment growth slowing to a stand-still since April – and soft alternative private sector data released during the U.S. government shutdown has been consistent with hiring demand remaining low.
The decision from the BoC is less straightforward. The Canadian central bank has already cut interest rates significantly more than the U.S. Fed in recent years and inflation is still running above the 2% inflation target.
Still, another 25 basis point rate reduction would leave the overnight rate at the bottom end, but not below, the BoC’s 2.25% to 3.25% estimated neutral range – in other words still at levels that would not be expected to significantly add to inflation pressures over time.
And we think it’s unlikely the BoC expected the one 25 basis point cut in September (the first reduction since March) would be enough to make a significant difference in the economy. The reduction last month came amid elevated trade uncertainty, “a weaker economy, and less upside risk to inflation,” according to the central bank.
Since September, data on growth and inflation have not surprised enough on the upside to derail another reduction this month. The unemployment rate at 7.1% in September was still elevated despite a rebound in employment counts. And, lower inflation expectations in the latest Business Outlook Survey are consistent with the BoC’s assessment of fading upside inflation risks.
This essentially means more room and flexibility for the central bank to have looser monetary policy. Still, we continue to expect that further cuts to the overnight rate to more stimulative levels would be increasingly difficult to justify when core inflation is running persistently above target, barring a significant further deterioration in growth that is not in our base case forecast.
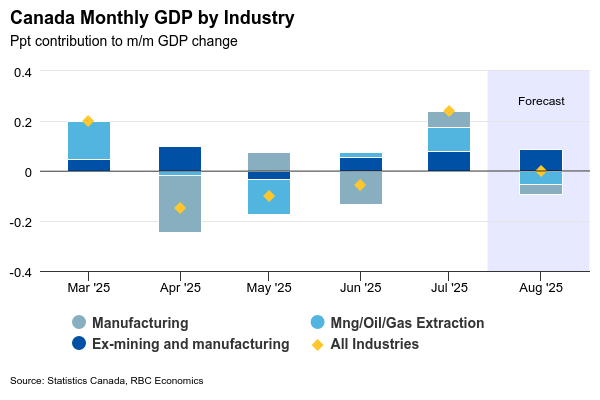
To be sure, U.S. tariffs are still hurting targeted sectors. We look for manufacturing and wholesale production to both contract in August gross domestic product data next Friday. Weakness in those sectors warrants a supportive policy response, but fiscal policy is more suited to respond to weakness in targeted sectors than blanket interest rate cuts . And the federal budget on Nov. 4 is expected to contain significant deficit spending to support growth in 2026 and beyond.
Week ahead data watch:
We expect August GDP held steady in Canada. Wholesale and manufacturing sales both declined after rising in July, and we expect a pullback in the mining sector to partially reverse a 1.4% jump in July. Other services industries likely posted growth, led by an 1.0% increase in retail sales. Early indicators for the advance GDP estimate for September are limited. Hours worked contracted 0.2% and the advance stimate of September retail sales was down 0.7%. But the advance manufacturing sales estimate bounced back 2.8%, which (if confirmed) would be the largest one month increase since February 2022.
Weekly Focus – A Cut in the Dark
The US government remains in shutdown and hence, we continue to have very little data on the state of the economy. Nevertheless, there is a widespread expectation, which we share, that the Fed will deliver a rate cut next week. In the absence of new information, the Fed will emphasise the weak job growth in August which has not been contradicted by the indicators that we do have about developments since. We will receive a much-delayed inflation number for September as well as PMI data for October today (after the time of writing), which could of course influence the decision, but we think the bar is high for the Fed to change its mind on the rate cut. Lowering the Fed Funds target to 4% will still mean that monetary policy is restrictive. The Fed might discuss slowing or ending the reduction of its bond holdings, not least given recent volatility in the repo market. It could also be interesting to hear how the Fed sees the situation for US regional banks.
The ECB will also deliver a rate decision in the coming week, and we see no reason to expect a different message than the "we're in a good place" in terms of interest rates and the economy that ECB president Christine Largarde highlighted at the September meeting. Since then, we have seen an increase in headline inflation to 2.2% y/y, but that is driven by base effects and should not affect the outlook. Inflation is expected to head down as wage growth slows and as a consequence of the stronger EUR. October PMI data for the euro area was stronger than expected driven by the German service sector, and markets are pricing only a small probability of a rate cut over the coming year, which we think that Lagarde is unlikely to push against.
Even as the ECB is finalising its monetary policy statement on Thursday, we will get data on GDP growth in Q3 and inflation in Germany and Spain in October, before the total euro area number Friday. On GDP, we estimate growth of 0.1% q/q as in Q2, after the strong Q1 driven not least by export to the US ahead of the tariff hikes. However, the October PMIs show a promising start to Q4 in terms of growth. On inflation, we expect it to slow to 2.1% y/y with a chance that it could be lower, and we also forecast core inflation to decline from 2.4% to 2.3%.
Trade tensions between China and the US have increased in recent weeks, with China increasing export controls on rare earth minerals and Donald Trump threatening 100% tariff on imports from China from 1 November. The US and Chinese presidents are set to meet next week, and we see a good chance that they can reach a deal. If they do not, there could be a risk-off market reaction. China outlined its next five-year plan this week and re-emphasised the need to boost domestic consumer spending but did not provide a concrete target or new means to reach that.
In Japan, Sanae Takaichi has formed a minority government that is likely to push for easing of fiscal policy, although it is not clear how much it can achieve. Takaichi is opposed to tightening of monetary policy which is one reason why we expect the Bank of Japan to keep rates unchanged at is meeting Thursday despite inflation rising in September and having exceeded the target for 42 months now.
ECB Preview – In a Good Place But Ready to Act
- We expect the ECB to leave the deposit rate unchanged at 2.00% on Thursday 30 October in line with consensus and market pricing.
- Data has been close to expectations since the September meeting, and we therefore expect no shift in communication on the assessment of the economic outlook nor in the 'meeting-by-meeting' approach. We will pay close attention to any new details on the 'good place' assessment and what could change it.
- We expect a limited market reaction during the press conference.
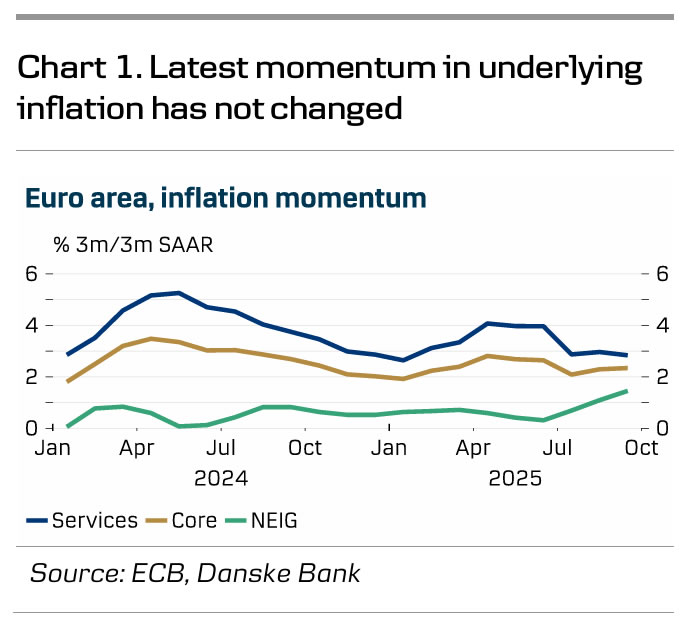
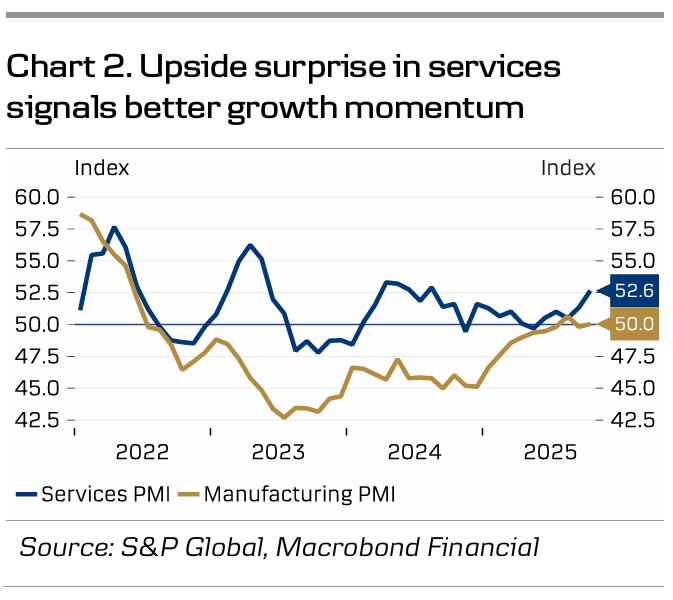
We expect the ECB to leave the deposit rate unchanged at 2.0% at the meeting on 30 October, in line with market pricing and consensus. Macro data since the September meeting has been close to expectations, suggesting the outlook has not changed. The September PMIs rose as expected while October PMIs surprised on the upside due to a strong increase in the services sector (see chart 2). PMIs suggest a slightly better growth momentum than the ECB staff projections, which forecasted 0.0% q/q GDP growth in Q3 and 0.2% q/q in Q4. Inflation ticked up to 2.2% y/y in September due to base effects while the momentum of underlying inflation was highly similar to that in recent months (see chart 1). September inflation thus aligned with staff projections for Q3 in both core and headline. Hence, we expect Lagarde to repeat the 'meeting-by-meeting' and 'data-dependent' approach.
Governing Council members continue to state that the ECB is 'in a good place', but there is growing divergence among members regarding the inflation outlook. This was evident in the minutes from the September meeting, where several members highlighted downside risks to inflation and expressed concerns regarding the euro's strength and households' persistently high savings rates. On the other hand, some members emphasised the potential inflationary effects of expansionary fiscal policies in the region and rising food inflation. We still see a clear majority of GC members that do not expect more cuts despite inflation projections being below target in both 2026 and 2027, but we are also hearing more dovish comments from e.g. Villeroy saying that a rate cut is more likely than a hike. Yet, with medium-term inflation expectations anchored close to 2%, decent October PMIs, and private consensus inflation expectations at 2% for 2027 we think the bar for another rate cut is high. This is also supported by the ECB seeing growth risks as balanced after having highlighted downside risks to growth since September 2023. Still, we do see a risk that the sentiment in the GC could change after the December staff projections if they show inflation below target on the full forecast horizon, including 2028.
Markets are currently pricing 2bp worth of cuts in 2025 and 10bp in 2026, leaving a 50% probability of one more rate cut. This chance of a cut has thus been lowered compared to before the September meeting when markets were pricing 8bp for 2025 and 8bp for 2026. While we see upside risks to current market pricing as we expect the ECB to remain on hold throughout 2026, we have recently taken profit on our payer positions in the short end of the EUR-swap curve as we see the risks as more balanced. At the press conference we will pay attention to communication about details on the 'good place' assessment by Lagarde and what potentially could change that view. However, we expect Lagarde to reiterate the place assessment but say that it is not fixed and that the ECB is ready to act.
Sunset Market Commentary
Markets
Euro area PMIs for October were on tap and came in to the strong side of expectations. Economy-wide activity picked up to 52.2 from 51.2, a 17-month high, driven by the services sector (52.6 from 51.3) on a steeper increase in new orders and employment. Germany in particular printed a sharp increase in services activity (54.5 from 51.5). Manufacturing output quickened to a 2-month high of 51.1 and with order books stabilizing after September’s drop it helped the total manufacturing index climb out of contraction territory. Exports remains a weak point but backlogs stabilized, thereby ending a period of depleting stretching back to April 2023. Input cost inflation eased again but manufacturers increased their selling (output) prices for the first time in six months, joining the services sector. Firms remain cautious on the outlook though. France stands out in virtually every (sub)series, and not in a good way. The PMI owners say economic growth in the euro area is currently much weaker than it could have been because of the French drama. Either way, the overall takeaway is an across-the-board solid beat. It lifted European yields to their highest levels in two weeks (+/- 5 bps), both at the front and long end of the curve before dropping from their intraday highs in the wake of US inflation numbers printing a tad below expectations. Headline US CPI rose by 0.3% m/m, core by 0.2%, resulting in a 3% annual reading. Energy was a main contributor (+1.5% m/m). Apparel & household furnishings, one of the categories watched for tariff-related inflationary effects, rose 0.7% and 0.5% respectively. The market reaction is telling: the 2-yr yield dropped up to 7 bps before paring most of the losses. Money markets at some point were even mulling the possibility of the Fed going big at one of the remaining two meetings this year. That seems farfetched based on this sole economic data point but its revealing of the markets’ mindset. Longer term US bond yields ease 1-2.5 bps. Enter the PMIs to wipe out all of the remaining CPI-driven losses. The US version followed the European and UK example by coming in better than expected. The services gauge picked up to 55.2, the manufacturing series to 52.2. The overall PMI (54.8) is this year’s second-highest reading. The strong start to Q4 (2.5% annualized growth) comes with weaker confidence for the year ahead though. Input cost inflation rose but output prices didn’t follow amid firms competing for sales. The flurry of eco data offers no clear guidance for EUR/USD, with the pair simply holding steady around 1.162.
Today’s PMIs and US inflation were mere appetizers going into next week’s main dish. The ongoing US government shutdown strips us from the durable goods orders, Q3 GDP and PCE inflation releases & jobless claims but we have the euro area to fill in some of the gaps. EA GDP and inflation numbers are due with releases scattered across the week. Key central banks decide over policy: the Fed (-25 bps expected to 3.75-4%) and the Bank of Canada (-25 bps to 2.25%) on Wednesday, and the BoJ (unchanged at 0.5%) and ECB (unchanged at 2%) on Thursday. The highly anticipated in-person meeting between presidents Trump and Xi will be closely watched for any signs of a trade thaw. The earnings season shifts into higher gear (Caterpillar, Alphabet, Meta, Microsoft, Apple, Amazon …).
News & Views
October Czech confidence data improved further. The composite indicator rose 2.1 points to 104, the best level since June 2021 on both improving business (up 1.8 to 103.4) and consumer confidence (+ 3.9 to 107.4). Confidence in the economy increased in industry and slightly in selected service sectors. It declined in trade and construction. The share of consumers expecting the overall economic situation to deteriorate over the next twelve months fell significantly compared to September. Households expecting their financial situation to improve over the same horizon also increased. The Czech koruna trades marginally softer today at EUR/CZK 24.33, but in a broader perspective holds a solid performance recorded earlier this year (YTD 3.5% gain).
UK PMIs showed somewhat faster UK output growth in October, with the composite PMI rising from 50.1 to 51.1. That corresponds to still-sluggish growth nonetheless (0.1%). The upturn was supported by another modest improvement in the services sector (51.1 from 50.8) and a first limited expansion in manufacturing output in 12 months. New business volumes also increased and contributed to the slowest rate of private sector job shedding since May. Input prices moderated to the lowest since November 2024 and output inflation slowed, driven by a more modest rise in service sector prices. The upcoming budget remains a source of caution in businesses’ behavior.
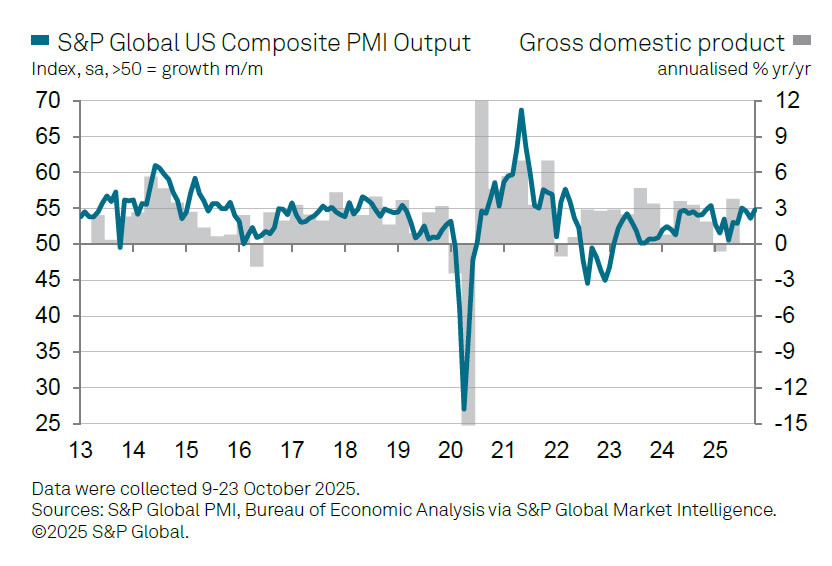
US PMI composite rises to 54.8, points to sustained strong economic growth
US business activity expanded at a solid pace in October, with PMI Composite rising from 53.9 to 54.8. Both sectors showed improvement as Manufacturing edged up from 52.0 to 52.2 and Services climbed from 54.2 to 55.2, signaling a broad-based pickup in momentum.
According to Chris Williamson, Chief Business Economist at S&P Global Market Intelligence, the data point to “sustained strong economic growth” at the start of the fourth quarter, consistent with an annualized expansion of around 2.5% — similar to the pace seen in Q3.
However, optimism about the future weakened noticeably. Williamson noted that business confidence fell to one of the lowest levels in three years, as companies expressed growing concern over the economic fallout from tariffs and uncertain policy direction.
Price trends offered a mixed picture. Input costs continued to rise sharply, reflecting the pass-through of tariffs, yet firms struggled to raise prices amid competitive pressures. As a result, selling price inflation cooled to its lowest since April.