
Sample Category Title
EUR/AUD Daily Outlook
Daily Pivots: (S1) 1.7826; (P) 1.7861; (R1) 1.7893; More...
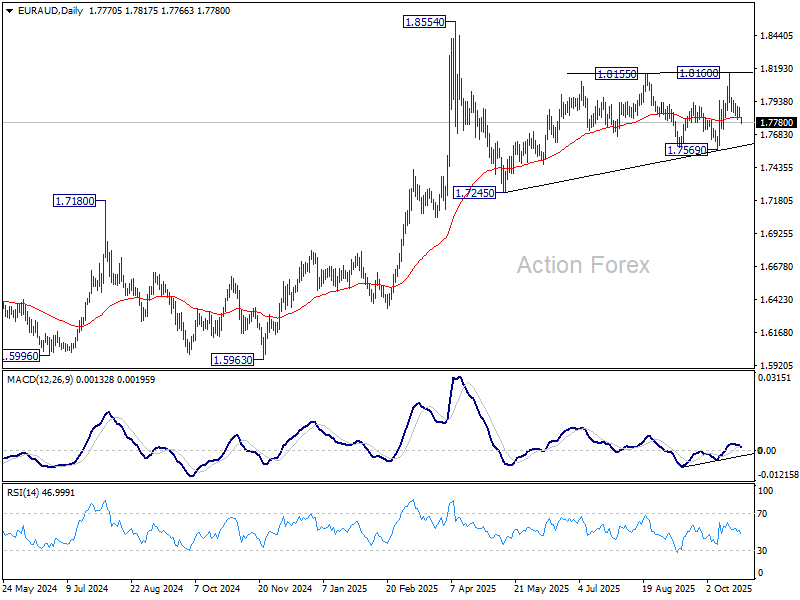
EUR/AUD's fall from 18160 resumed by breaking through 1.7798 temporary low. The development dampened the original bullish view, and suggests that corrective pattern from 1.8554 is probably extending. Intraday bias is turned back to the downside for 1.7569 support first. On the upside, above 1.7895 minor resistance will turn intraday bias neutral.
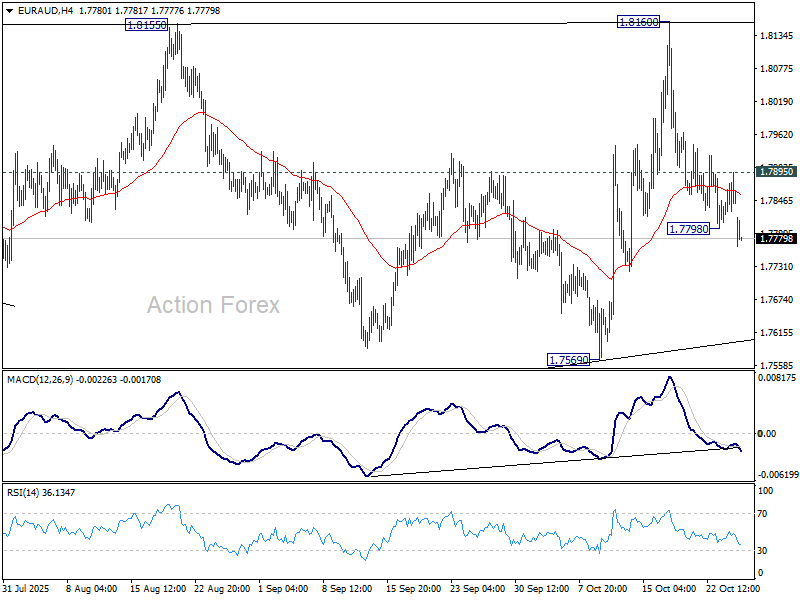
In the bigger picture, price actions from 1.8554 medium term top are seen as a corrective pattern, which might still be in progress. But outlook will stay bullish as long as 55 W EMA (now at 1.7391) holds, and up trend from 1.4281 (2022 low) is expected to resume through 1.8554 at a later stage.
EUR/CHF Daily Outlook
Daily Pivots: (S1) 0.9236; (P) 0.9246; (R1) 0.9260; More....
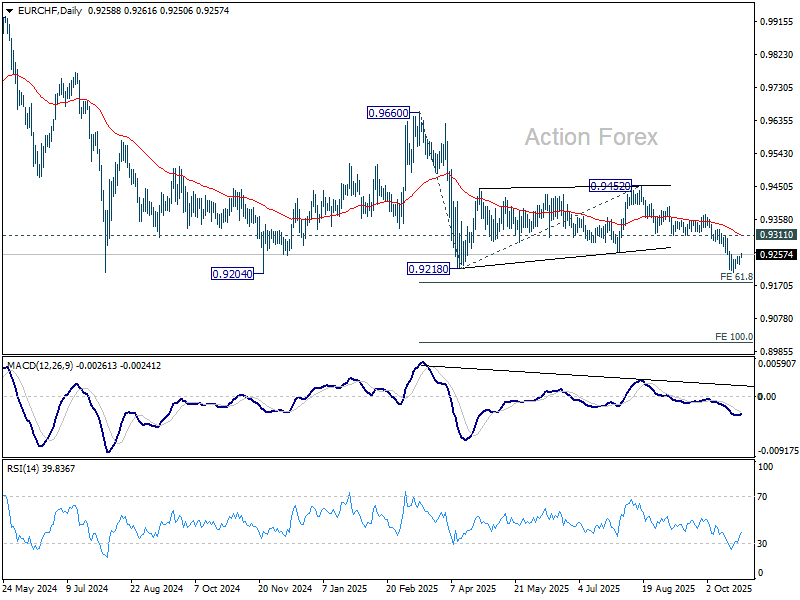
Intraday bias in EUR/CHF remains neutral as consolidations continues above 0.9208. Upside should be limited below 0.9311 support turned resistance. On the downside, break of 0.9204 will confirm larger down trend resumption. Next target is 61.8% projection of 0.9660 to 0.9218 from 0.9452 at 0.9179. Firm break there will target 100% projection at 0.9010.
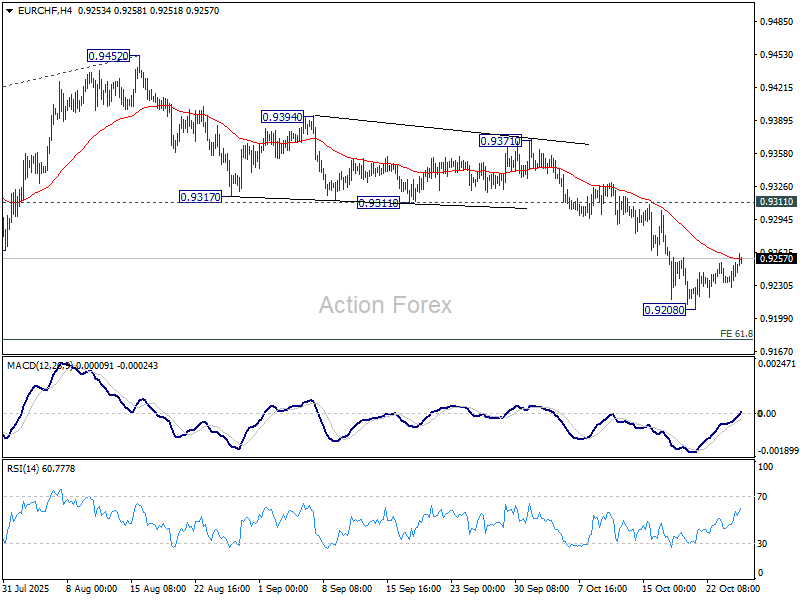
In the bigger picture, outlook remains bearish with EUR/CHF staying well inside long term falling channel after multiple rejection by 55 W EMA (now at 0.9385). Firm break of 0.9204 will resume the whole down trend from 1.2004 (2018 high). Next target is 61.8% projection of 1.1149 to 0.9407 from 0.9928 at 0.8851. Break of 0.9452 resistance is needed to be the first sign of medium term bottoming.
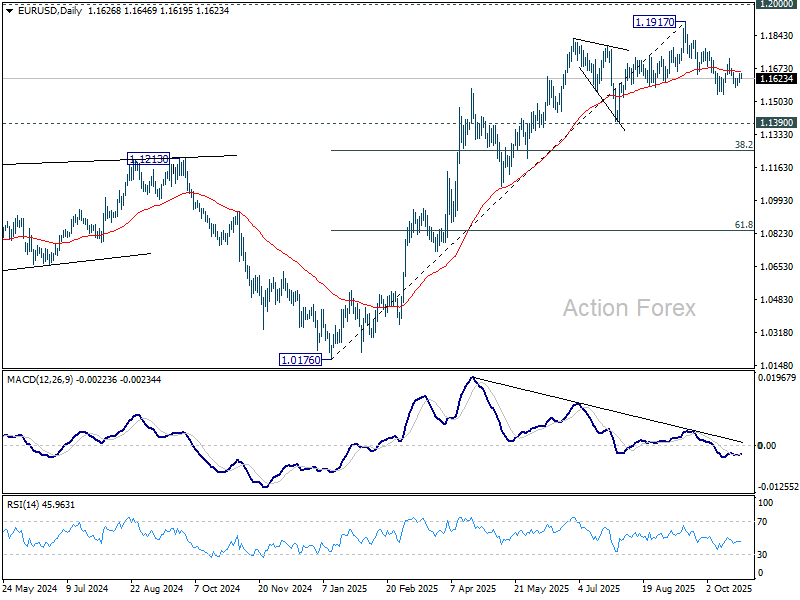
EUR/USD Daily Outlook
Daily Pivots: (S1) 1.1603; (P) 1.1626; (R1) 1.1650; More…
Range trading continues in EUR/USD and intraday bias stays neutral. On the downside, below 1.1540 will resume the decline from 1.1917 and target 1.1390 support, or even further to 38.2% retracement of 1.0176 to 1.1917 at 1.1252. On the upside, though, break of 1.1727 resistance will turn bias back to the upside for 1.1778, and then retest of 1.1917 high instead.
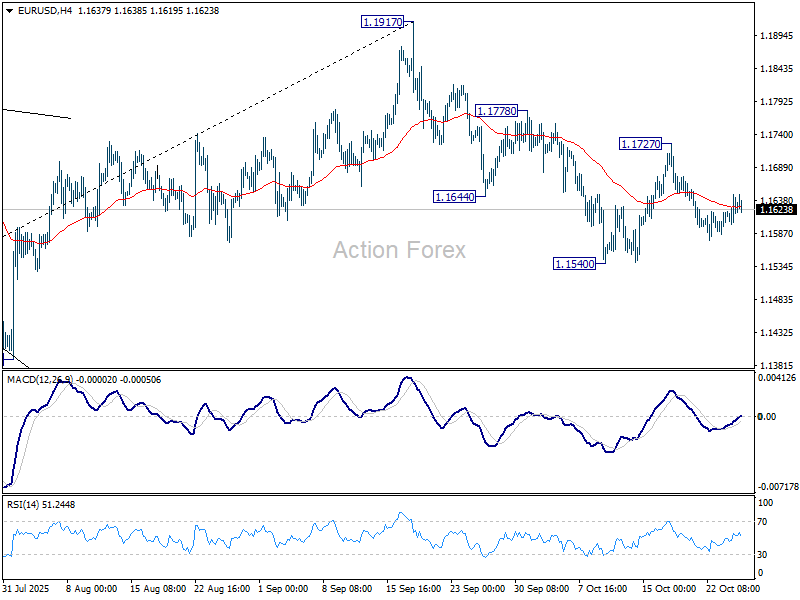
In the bigger picture, considering bearish divergence condition in D MACD, a medium term top is likely in place at 1.1917, just ahead of 1.2 key psychological level. As long as 55 W EMA (now at 1.1301) holds, the up trend from 0.9534 (2022 low) is still expected to continue. Decisive break of 1.2000 will carry larger bullish implications. However, sustained trading below 55 W EMA will argue that rise from 0.9534 has completed as a three wave corrective bounce, and keep outlook bearish.
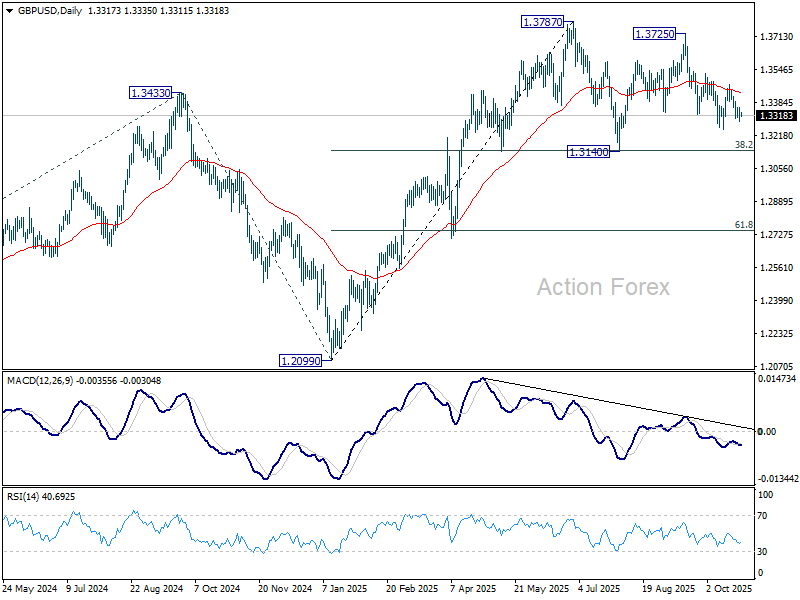
GBP/USD Daily Outlook
Daily Pivots: (S1) 1.3280; (P) 1.3319; (R1) 1.3351; More...
Range trading continues in GBP/USD and intraday bias stays neutral at this point. On the downside, break of 1.3247 will target 1.3140 cluster (38.2% retracement of 1.2099 to 1.3787 at 1.3142). Strong support is expected there to contain downside to complete the corrective pattern from 1.3787. On the upside, break of 1.3470 resistance will turn bias back to the upside for 1.3526, and then 1.3725/87 resistance zone.
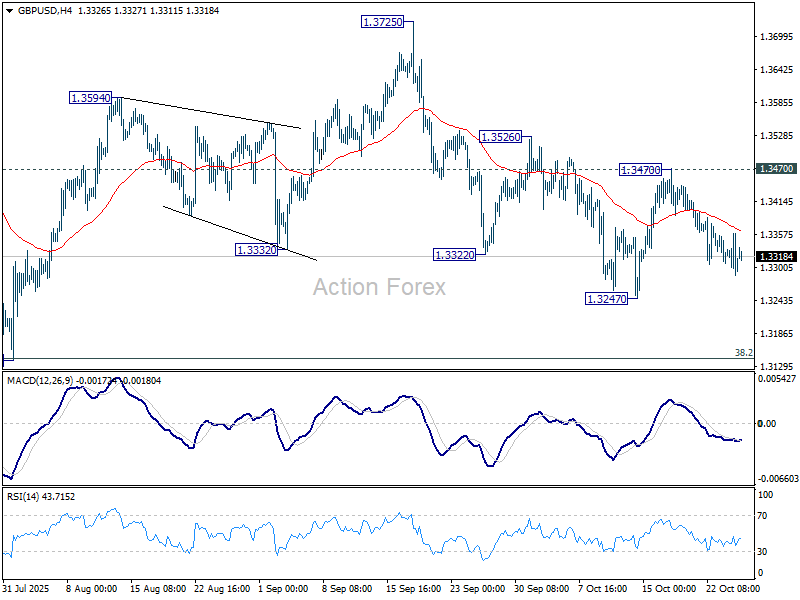
In the bigger picture, rise from 1.0351 (2022 low) is still seen as a corrective move. Further rally could be seen to 61.8% projection of 1.0351 to 1.3433 (2024 high) from 1.2099 (2025 low) at 1.4004. But strong resistance could emerge from 1.4248 (2021 high) to limit upside. Sustained break of 55 W EMA (now at 1.3191) will argue that a medium term top has already formed and bring deeper fall back to 1.2099.
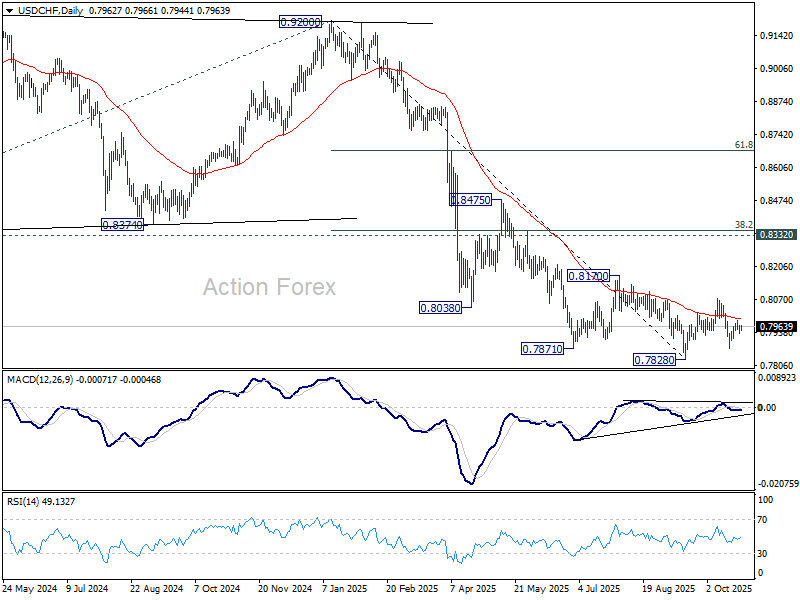
USD/CHF Daily Outlook
Daily Pivots: (S1) 0.7939; (P) 0.7954; (R1) 0.7972; More…
Intraday bias in USD/CHF remains neutral for the moment. Deeper decline is still in favor with 0.7984 resistance intact. On the downside, below 0.7913 will turn bias to the downside for 0.7872 support, and then 0.7828 low. However, firm break of 0.7984 will suggest that corrective pattern from 0.7828 is extending with another rising leg, and target 0.8075 again.
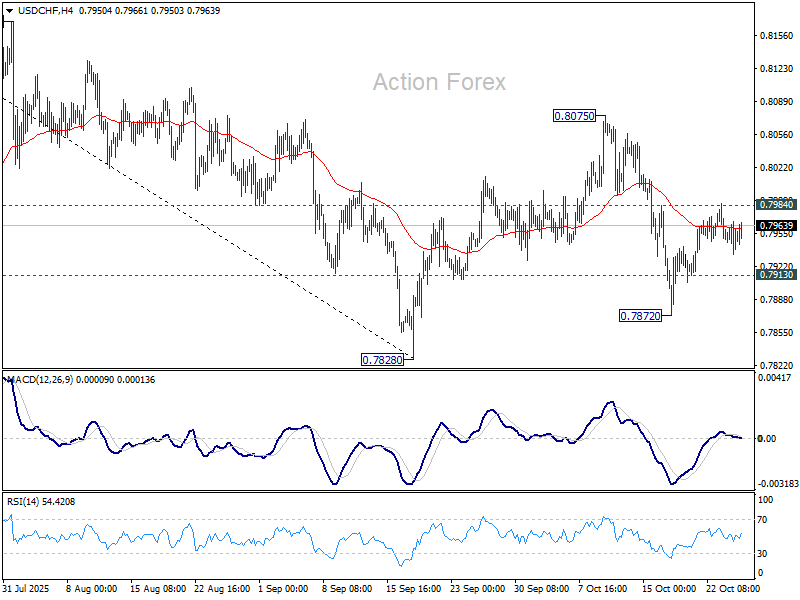
In the bigger picture, long term down trend from 1.0342 (2017 high) is still in progress. Next target is 100% projection of 1.0146 (2022 high) to 0.8332 from 0.9200 at 0.7382. In any case, outlook will stay bearish as long as 0.8332 support turned resistance holds (2023 low).
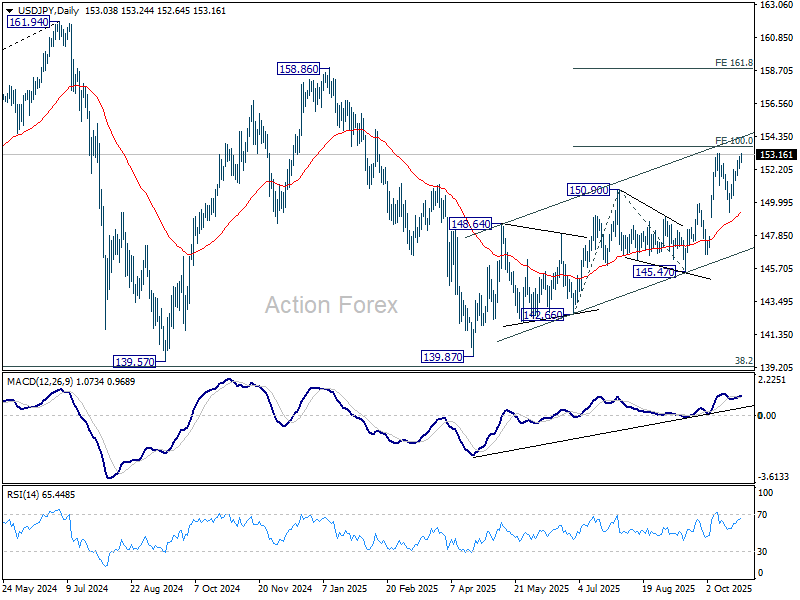
USD/JPY Daily Outlook
Daily Pivots: (S1) 152.45; (P) 152.76; (R1) 153.18; More...
Intraday bias in USD/JPY is back on the upside with break of 153.05 temporary top. Break of 153.26 will resume larger rise from 139.87 to 100% projection of 142.66 to 150.90 from 145.47 at 153.71. Firm break there would prompt upside acceleration to 161.8% projection at 158.80. On the downside, below 152.25 minor support will turn intraday bias neutral again first.
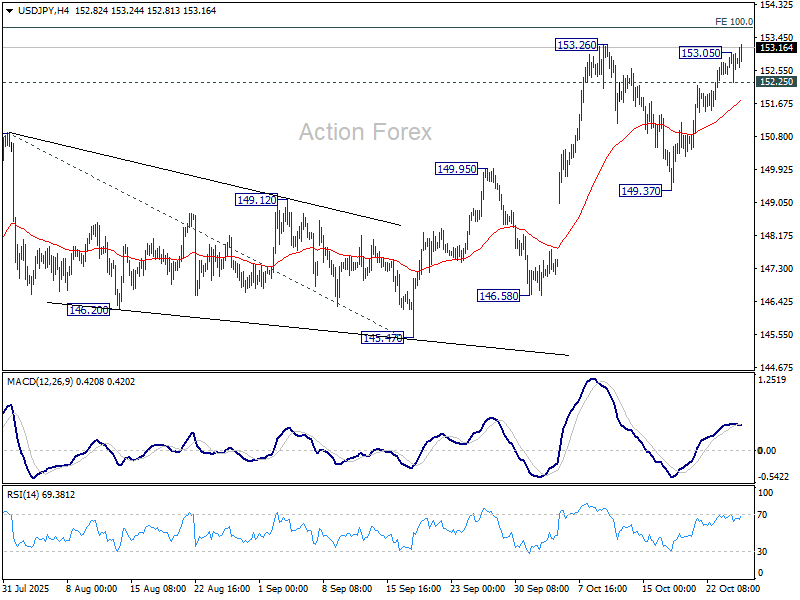
In the bigger picture, current development suggests that corrective pattern from 161.94 (2024 high) has completed with three waves at 139.87. Larger up trend from 102.58 (2021 low) could be ready to resume through 161.94 high. On the downside, break of 145.47 support will dampen this bullish view and extend the corrective pattern with another falling leg.
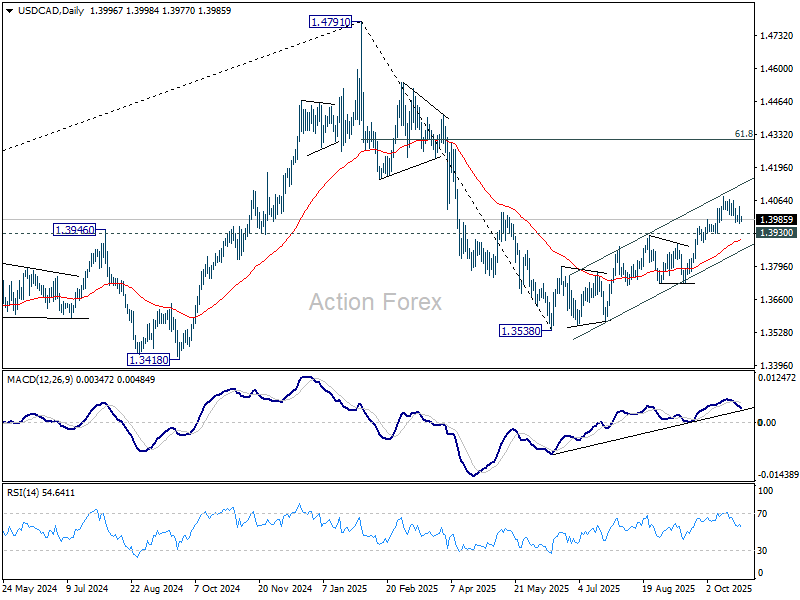
USD/CAD Daily Outlook
Daily Pivots: (S1) 1.3972; (P) 1.4005; (R1) 1.4037; More...
USD/CAD is still extending consolidations below 1.4078 and intraday bias remains neutral. Further rally is expected as long as 1.3930 support holds. Break of 1.4078 will resume the rise from 1.3538 to 61.8% retracement of 1.4791 to 1.3538 at 1.4312.
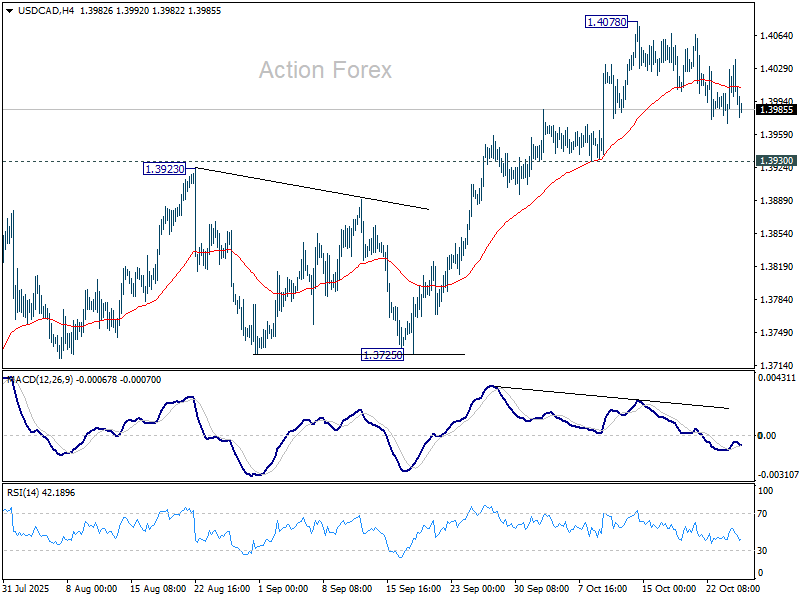
In the bigger picture, price actions from 1.4791 medium term top is likely just unfolding as a correction to up trend from 1.2005 (2021 low). Based on current momentum, rise from 1.3538 is the second leg, and a third leg should follow before up trend resumption. That is, range trading is set to extend for the medium term. For now, this will remain the favored case as long as 1.3725 support holds.
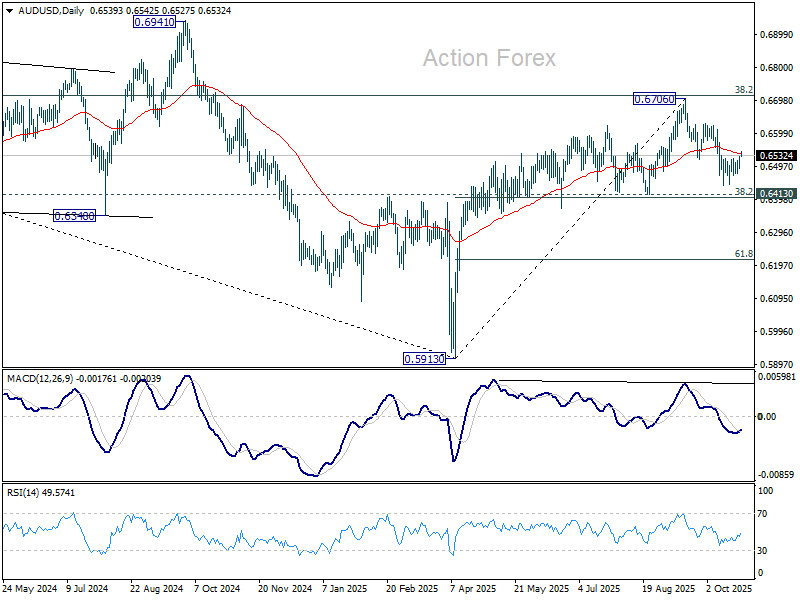
AUD/USD Daily Report
Daily Pivots: (S1) 0.6494; (P) 0.6511; (R1) 0.6530; More...
AUD/USD edges higher today and immediate focus is on 55 D EMA (now at 0.6538). Sustained break there will argue that fall from 0.6706 has completed as a three wave correction at 0.6439. Further rally should then be seen to 0.6628 resistance, and then retest 0.6706 high. On the downside, though, below 0.6492 minor support will turn bias back to the downside to resume the fall from 0.6706 to 0.6413 cluster support (38.2% retracement of 0.5913 to 0.6706 at 0.6403. Decisive break there will indicate bearish reversal after rejection by 0.6713 fibonacci level.
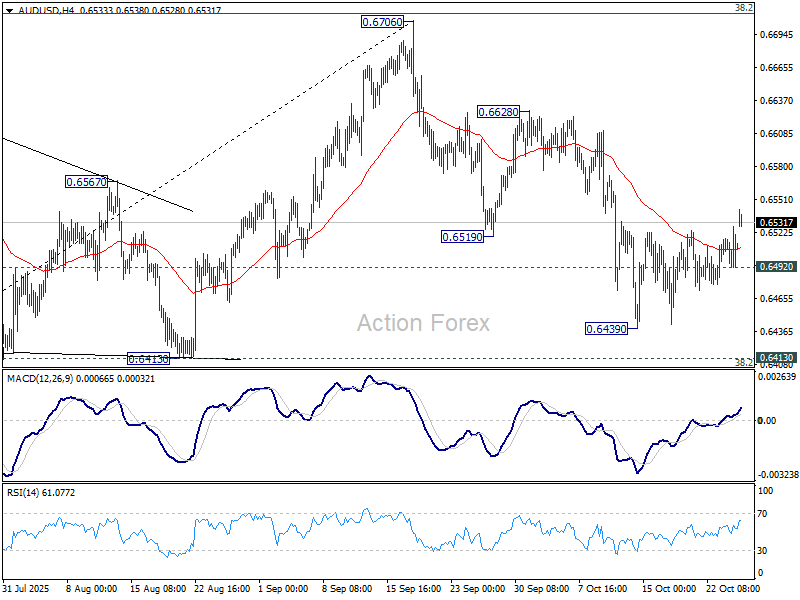
In the bigger picture, there is no clear sign that down trend from 0.8006 (2021 high) has completed. Rebound from 0.5913 is seen as a corrective move. Outlook will remain bearish as long as 38.2% retracement of 0.8006 to 0.5913 at 0.6713 holds. Nevertheless, considering bullish convergence condition in W MACD, sustained break of 0.6713 will be a strong sign of bullish trend reversal, and pave the way to 0.6941 structural resistance for confirmation.
Risk-On Wave Sweeps Asia; Commodity FX Gains Ahead of Central Bank blitz
A powerful risk-on wave swept through Asian markets at the start of the week, propelling commodity currencies higher as equities across Japan and South Korea surged record while China jumped to decade highs. The mood reflected growing conviction that the U.S.–China trade conflict is entering a phase of lasting calm.
Following a “very good two-day meeting” between top officials in Washington and Beijing, U.S. negotiators hinted that additional American 100% tariffs on Chinese goods are now “effectively off the table.” That comment, combined with growing expectations for an extended tariff truce, eased concerns of a fresh escalation ahead of the Trump–Xi summit later this week.
In Australia, equities rose but underperformed their regional counterparts as rare-earth producers and explorers tumbled. Investors reacted to expectations that China will delay the rollout of its rare-earth export licensing regime — a move that could ease global supply tensions but dent near-term revenue prospects for Australian miners. Still, the broader regional risk tone remained overwhelmingly positive.
Attention will also center on the first major meeting between U.S. President Donald Trump and Japan’s new Prime Minister Sanae Takaichi. The pair are expected to discuss trade, security cooperation, defense spending, and investment — contentious issues that could shape the tone of U.S.–Japan relations under Takaichi’s leadership. Her diplomatic debut with the ASEAN summit in Malaysia and the APEC leaders’ meeting in Gyeongju, offering her a high-profile global stage early in her tenure. The Trump–Takaichi encounter is a potential swing factor for Japanese equities. A smooth discussion could reinforce investor confidence in Japan’s policy stability and extend the Nikkei’s record run.
Beyond geopolitics, this week also features a heavy central bank calendar. The Fed and BoC are both expected to cut rates, while the BoJ and ECB are seen holding steady. Traders will pay particular attention to whether the Fed, constrained by a data blackout from the ongoing U.S. government shutdown, signals that it remains on track for another back-to-back cut in December.
In the FX market, the tone aligns perfectly with the broader risk rally. Aussie leads gains, followed by Kiwi and Loonie. Safe havens are under pressure — Yen, Swiss Franc, and Euro are the weakest performers — while Dollar and Sterling hold middle ground.
In Asia, at the time of writing, Nikkei is up 2.12%. Hong Kong HSI is up 1.02%. China Shanghai SSE is up 1.04%. Singapore Strait Times is up 0.48%. Japan 10-year JGB yield is up 0.012 at 1.671.
Yuan surges as US-China move toward tariff truce framework
Chinese yuan rallied in Asian session after weekend reports signaled tangible progress toward a new U.S.–China trade framework. Senior economic officials from both countries agreed on the broad outline of a deal that could be finalized when Presidents Donald Trump and Xi Jinping meet later this week at the APEC summit in Gyeongju, South Korea. The accord aims to extend the existing tariff truce and suspend China’s planned rare-earth export controls, easing one of the key geopolitical risks that has hung over markets for weeks.
U.S. Treasury Secretary Bessent described the outcome of the fifth round of talks as “a very successful framework” for the leaders to discuss on Thursday, noting optimism that the tariff pause beyond its November 10 expiry is all but assured. He added that China is expected to resume substantial purchases of U.S. soybeans, ending a complete halt in September when Chinese buyers turned to Brazil and Argentina.
Bessent also said Beijing plans to delay by a year the rollout of its rare-earth licensing regime while the policy is reviewed. That concession effectively removes a major supply-chain concern for U.S. manufacturers in the short term.
Trump reinforced the upbeat sentiment, telling reporters he believes “we’re going to have a deal with China.”
The positive momentum coincided with stronger domestic data from China. Industrial profits surged 21.6% yoy in September, accelerating from 20.4% in August and marking the fastest pace since late 2023. The data lent further support to Chinese assets and Yuan, reinforcing the perception that policy stimulus and improving export volumes are feeding through to corporate earnings.
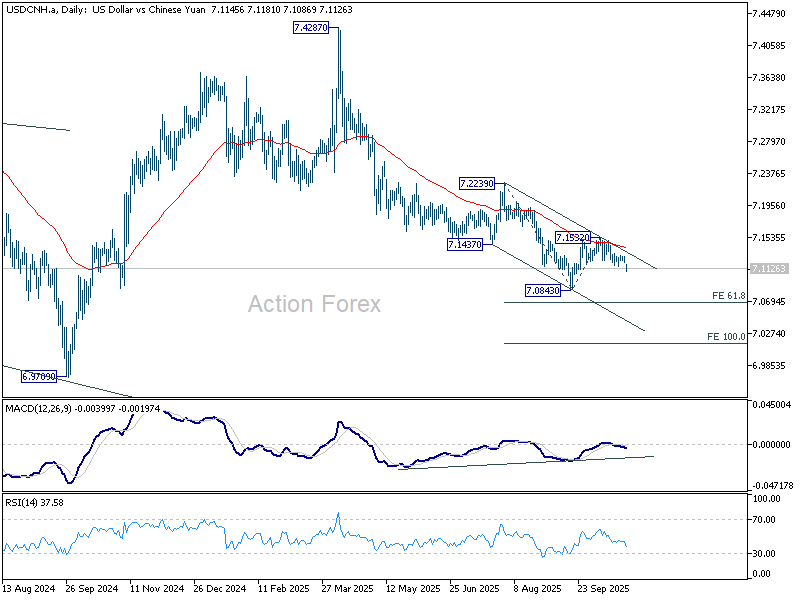
Technically, USD/CNH’s gap-down move today confirmed renewed downside momentum. The rejection by 55 D EMA (now at 7.1532) indicates the corrective bounce from 7.0843 has ended, with sellers regaining control. Break below 7.0843 would resume the broader downtrend from the April high of 7.4287 toward 61.8% projection of 7.2239 to 7.0843 from 7.1532 at 7.0669 next.
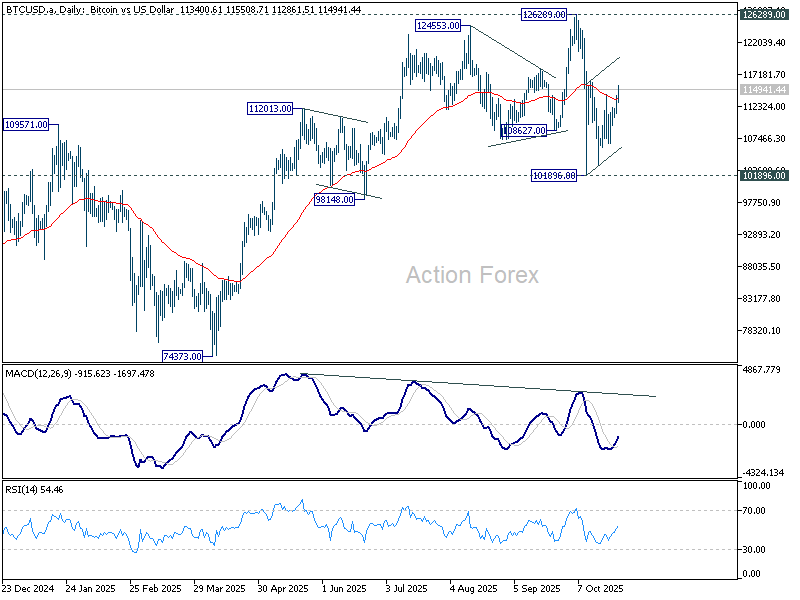
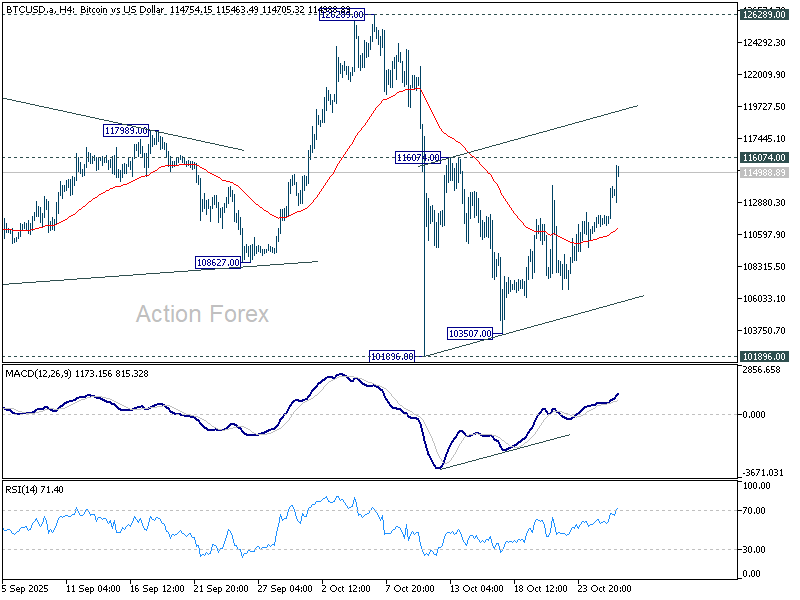
Bitcoin tests 116k resistance as risk-on rally builds in Asia
Bitcoin advanced notably today as risk appetite surged across Asia, with equity benchmarks in Japan and South Korea hitting historic milestones. Nikkei 225 jumped more than 2%, breaking above the 50,000 mark for the first time, while South Korea’s KOSPI surged 2.1% to cross 4,000. The broad rally reflected optimism that U.S.–China trade negotiations are progressing toward an extension of the tariff truce, fueling a powerful risk-on tone across regional assets.
Improving sentiment spilled over into digital markets, with Bitcoin rising in tandem with equities and commodities. Traders appear to be rotating back into higher-risk assets amid easing geopolitical tensions and steady global liquidity.
Technically, immediate focus is now on 116,074 resistance. Firm break above that level would confirm that the entire pullback from 126,289 represents only a consolidation to the five-wave rally from 74,373, rather than a larger scale correction. In that case, another rally toward 126,289 would be favored, though that prior high could still act as a cap within the range. Even if the consolidation extends with another downleg, the downside should remain contained above 101,896.
Conversely, rejection by 116,074 would undermine the range-bound view and raise the risk of a deeper slide below 101,896. While such a move would likely remain a correction, it would signal that the selling momentum has yet to fully exhaust.
Policy marathon: Fed and BoC to cut, BoJ and ECB to hold
Markets head into one of the busiest weeks of the year with a full slate of central bank meetings and top-tier data releases. Investors are bracing for decisions from the Fed, BoC, BoJ, and ECB — all set to test the durability of last week’s global risk rally.
The Fed meeting on Wednesday takes center stage. Markets have fully priced in a 25bps rate cut, which would bring the federal funds rate to 3.75–4.00%. Last week’s cooler CPI print reinforced expectations of a follow-up cut in December, with traders increasingly confident the Fed will stay on its easing path into early 2026.
A pre-CPI Reuters poll showed 71% of economists anticipated a December cut, and that figure likely rose after the inflation surprise. All eyes will turn to Jerome Powell’s press conference for subtle signals about how comfortable the Fed is with this dovish market path. He is expected to keep guidance deliberately vague, emphasizing data dependency and patience while steering clear of firm commitments.
North of the border, the BoC is also expected to deliver a 25bps rate cut this week, lowering its benchmark rate to 2.25%. While inflation has recently re-accelerated, growth momentum remains tepid and wage pressures are moderating, giving policymakers room to act. Around two-thirds of those surveyed in a Reuters poll expect the BoC to end the year at 2.25%, effectively reaching the lower limit of its 2.25–3.25% neutral band.
Looking further ahead, a majority of forecasters — roughly 60% — see the BoC holding rates at 2.25% through the end of 2026. Only a small minority expect deeper easing. That view underscores a growing belief that the current cycle is nearing completion.
In Asia, the BoJ is widely expected to stand pat at 0.50% this week. Most economists anticipate the next hike will come in December or January as officials gauge the new administration’s pro-growth policies. Reuters polling shows around 60% expect a move to 0.75% in Q4, rising to nearly full consensus by the end of March 2026. Markets will also pay close attention to the BoJ’s updated forecasts, which may reflect the positive spillovers from the U.S.–Japan trade agreement.
The ECB’s decision is expected to be a quiet one. Policymakers are set to keep the deposit rate steady at 2.00%. Investors view the October meeting as a placeholder, with December’s update — including new staff projections — likely to set the stage for 2026 guidance. Eurozone GDP and CPI flash data released this week could nonetheless shape rate expectations heading into year-end.
Beyond the central bank agenda, a packed data calendar will keep traders on alert. Key releases include, Eurozone GDP and CPI, Germany's Ifo and Gfk sentiment, Australian CPI, Japan industrial production and Tokyo CPI, Canada GDP, and China PMIs. The convergence of these reports — alongside four central bank meetings — ensures an eventful week that could reset global market direction heading into November.
Here are some highlights for the week:
- Monday: Germany Ifo business climate; Eurozone M3 money supply.
- Tuesday: Germany Gfk consumer sentiment; US consumer confidence.
- Wednesday: Australia CPI; BoC rate decision; Fed rate decision.
- Thursday: New Zealand ANZ business confidence; BoJ rate decision; Swiss KOF economic barometer; Eurozone GDP; ECB rate decision.
- Friday: Japan Tokyo CPI, industrial production, retail sales, unemployment rate; Australia PPI; China PMIs; Swiss retail sales; Eurozone CPI flash; Canada GDP.
AUD/USD Daily Report
Daily Pivots: (S1) 0.6494; (P) 0.6511; (R1) 0.6530; More...
AUD/USD edges higher today and immediate focus is on 55 D EMA (now at 0.6538). Sustained break there will argue that fall from 0.6706 has completed as a three wave correction at 0.6439. Further rally should then be seen to 0.6628 resistance, and then retest 0.6706 high. On the downside, though, below 0.6492 minor support will turn bias back to the downside to resume the fall from 0.6706 to 0.6413 cluster support (38.2% retracement of 0.5913 to 0.6706 at 0.6403. Decisive break there will indicate bearish reversal after rejection by 0.6713 fibonacci level.
In the bigger picture, there is no clear sign that down trend from 0.8006 (2021 high) has completed. Rebound from 0.5913 is seen as a corrective move. Outlook will remain bearish as long as 38.2% retracement of 0.8006 to 0.5913 at 0.6713 holds. Nevertheless, considering bullish convergence condition in W MACD, sustained break of 0.6713 will be a strong sign of bullish trend reversal, and pave the way to 0.6941 structural resistance for confirmation.
EUR/USD Attempts Modest Bounce But Recovery Could Falter
Key Highlights
- EUR/USD is attempting to recover from 1.1540.
- A short-term bullish trend line is forming with support at 1.1610 on the 4-hour chart.
- GBP/USD is again moving below the 1.3360 support.
- Bitcoin is gaining pace above the $113,500 resistance.
EUR/USD Technical Analysis
The Euro found support near 1.1540 against the US Dollar. EUR/USD is slowly moving higher above 1.1600 but faces many hurdles.
Looking at the 4-hour chart, the pair traded above the 38.2% Fib retracement level of the downward move from the 1.1728 swing high to the 1.1576 swing low. On the upside, the pair faces resistance near the 1.1650 level and the 100 simple moving average (red, 4-hour).
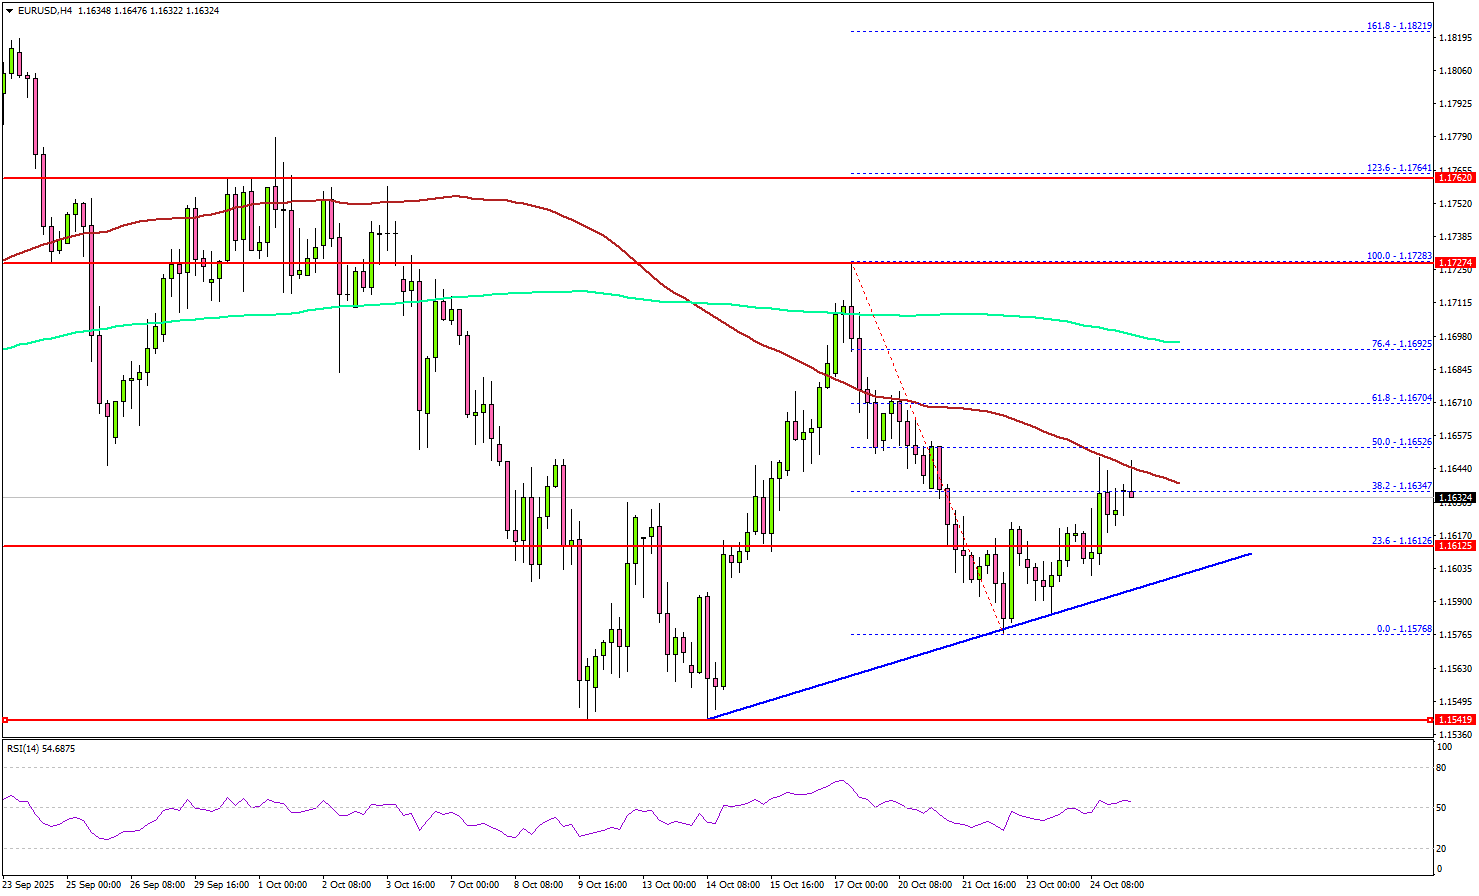
The next hurdle could be near 1.1690 and the 200 simple moving average (green, 4-hour). It is close to the 76.4% Fib retracement level of the downward move from the 1.1728 swing high to the 1.1576 swing low. A close above 1.1690 resistance might push the pair to 1.1750.
If the pair fails to clear 1.1650, it could resume its decline. On the downside, the pair might find support at 1.1610. The main support might be 1.1540.
A close below the 1.1540 zone could start a major pullback toward 1.1500. Any more losses might open the doors for a test of 1.1440.
Looking at GBP/USD, the pair started a recovery wave, but the bears might remain active below the 1.3480 and 1.3500 levels.
Upcoming Key Economic Events:
- US Durable Goods Orders for Sep 2025 – Forecast +0.3% versus +2.9% previous.
- Dallas Fed Manufacturing Business Index for Oct 2025 – Forecast -8.5, versus -8.7 previous.