Sample Category Title
AUD/USD Daily Report
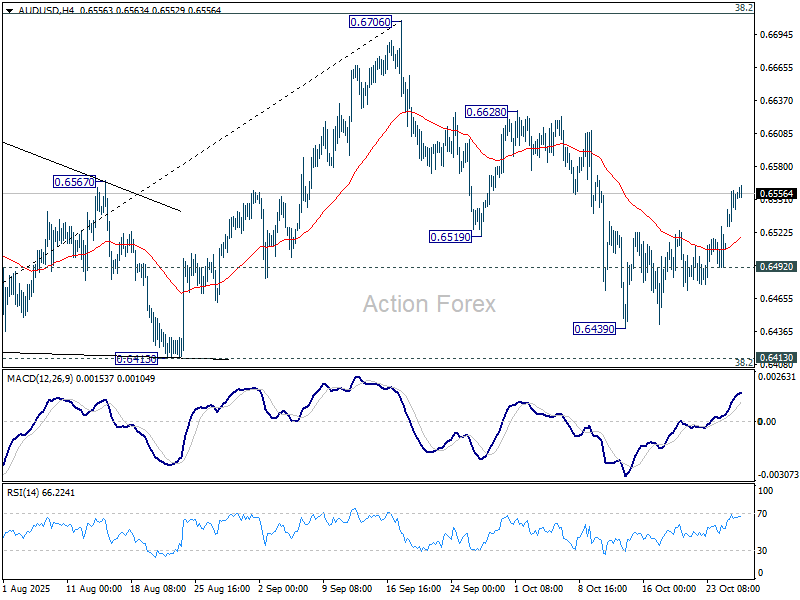
Daily Pivots: (S1) 0.6536; (P) 0.6548; (R1) 0.6567; More...
AUD/USD's break of 55D EMA suggests that corrective fall from 0.6706 has already completed with three waves down to 0.6439. Intraday bias is back on the upside for 0.6628 resistance first. Firm break there will target a retest on 0.6706 high. ON the downside, however, break of 0.6492 will resume the correction to 0.6413 cluster support (38.2% retracement of 0.5913 to 0.6706 at 0.6403).
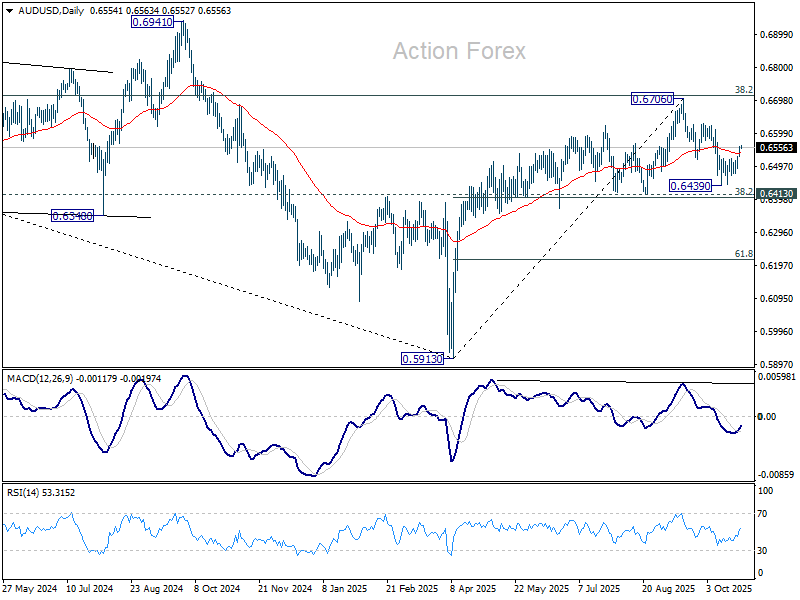
In the bigger picture, there is no clear sign that down trend from 0.8006 (2021 high) has completed. Rebound from 0.5913 is seen as a corrective move. Outlook will remain bearish as long as 38.2% retracement of 0.8006 to 0.5913 at 0.6713 holds. Nevertheless, considering bullish convergence condition in W MACD, sustained break of 0.6713 will be a strong sign of bullish trend reversal, and pave the way to 0.6941 structural resistance for confirmation.
USD/CAD Daily Outlook
Daily Pivots: (S1) 1.3970; (P) 1.3990; (R1) 1.4011; More...
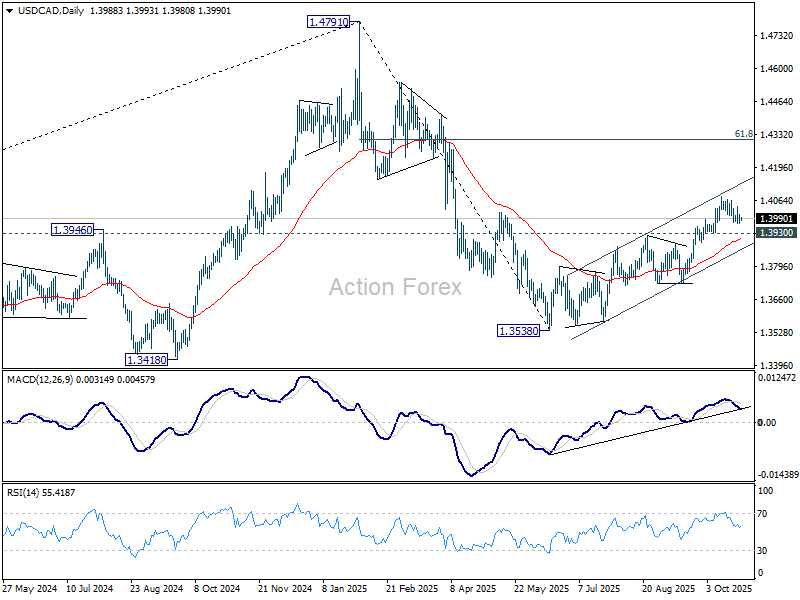
Intraday bias in USD/CAD remains neutral as consolidations from 1.4078 is still extending. Further rally is expected as long as 1.3930 support holds. Break of 1.4078 will resume the rise from 1.3538 to 61.8% retracement of 1.4791 to 1.3538 at 1.4312.
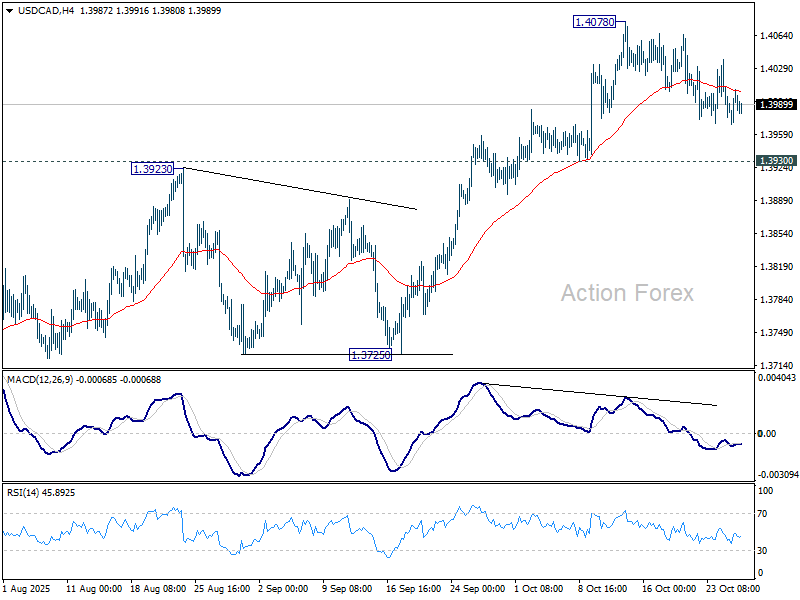
In the bigger picture, price actions from 1.4791 medium term top is likely just unfolding as a correction to up trend from 1.2005 (2021 low). Based on current momentum, rise from 1.3538 is the second leg, and a third leg should follow before up trend resumption. That is, range trading is set to extend for the medium term. For now, this will remain the favored case as long as 1.3725 support holds.
EUR/USD Daily Outlook
Daily Pivots: (S1) 1.1625; (P) 1.1638; (R1) 1.1659; More…
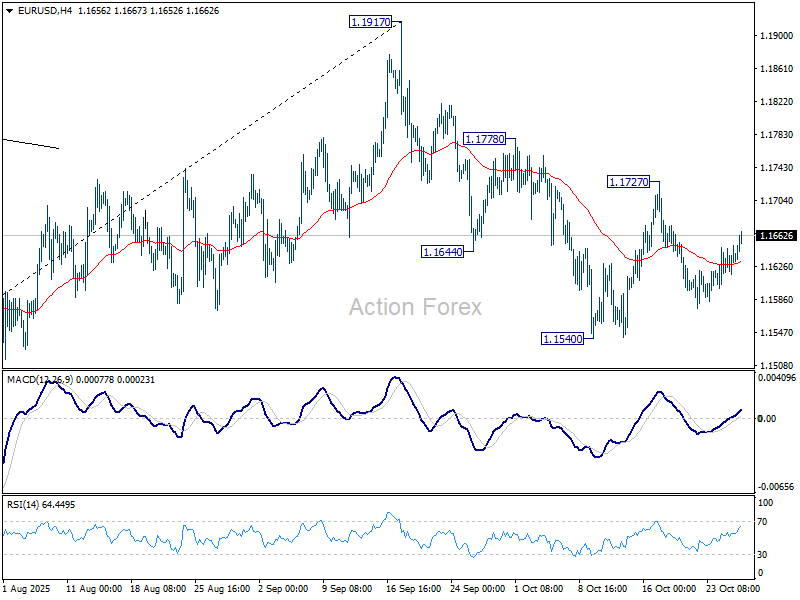
Intraday bias in EUR/USD stays neutral as range trading continues. On the downside, below 1.1540 will resume the fall from 1.1917 and target 1.1390 support, or even further to 38.2% retracement of 1.0176 to 1.1917 at 1.1252. On the upside, though, break of 1.1727 resistance will turn bias back to the upside for 1.1778, and then retest of 1.1917 high instead.
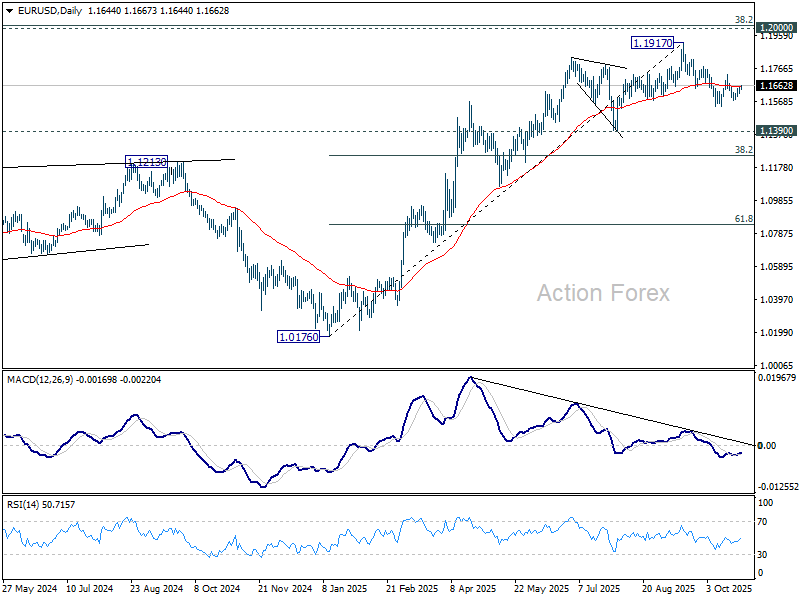
In the bigger picture, considering bearish divergence condition in D MACD, a medium term top is likely in place at 1.1917, just ahead of 1.2 key psychological level. As long as 55 W EMA (now at 1.1301) holds, the up trend from 0.9534 (2022 low) is still expected to continue. Decisive break of 1.2000 will carry larger bullish implications. However, sustained trading below 55 W EMA will argue that rise from 0.9534 has completed as a three wave corrective bounce, and keep outlook bearish.
GBP/USD Daily Outlook
Daily Pivots: (S1) 1.3314; (P) 1.3333; (R1) 1.3356; More...
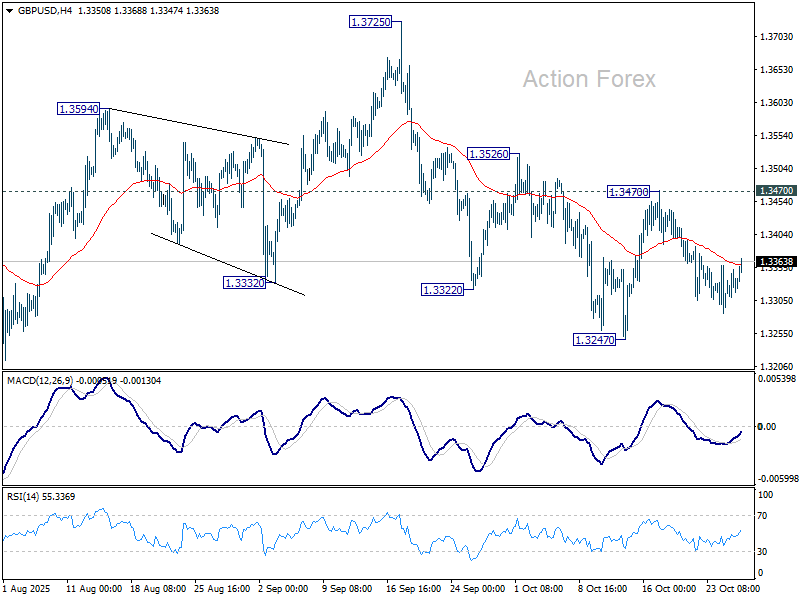
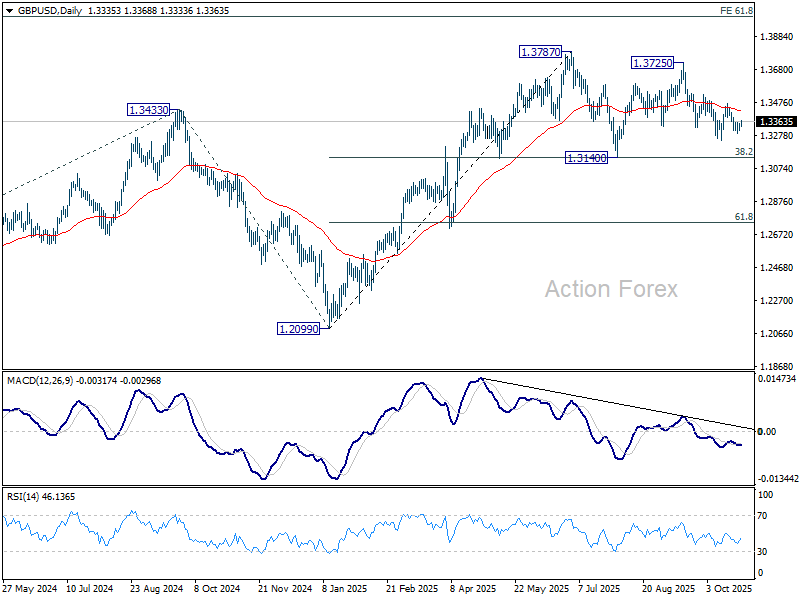
Intraday bias in GBP/USD remains neutral for the moment as range trading continues. On the downside, break of 1.3247 will target 1.3140 cluster (38.2% retracement of 1.2099 to 1.3787 at 1.3142). Strong support is expected there to contain downside to complete the corrective pattern from 1.3787. On the upside, break of 1.3470 resistance will turn bias back to the upside for 1.3526, and then 1.3725/87 resistance zone.
In the bigger picture, rise from 1.0351 (2022 low) is still seen as a corrective move. Further rally could be seen to 61.8% projection of 1.0351 to 1.3433 (2024 high) from 1.2099 (2025 low) at 1.4004. But strong resistance could emerge from 1.4248 (2021 high) to limit upside. Sustained break of 55 W EMA (now at 1.3191) will argue that a medium term top has already formed and bring deeper fall back to 1.2099.
USD/CHF Daily Outlook
Daily Pivots: (S1) 0.7942; (P) 0.7957; (R1) 0.7970; More…
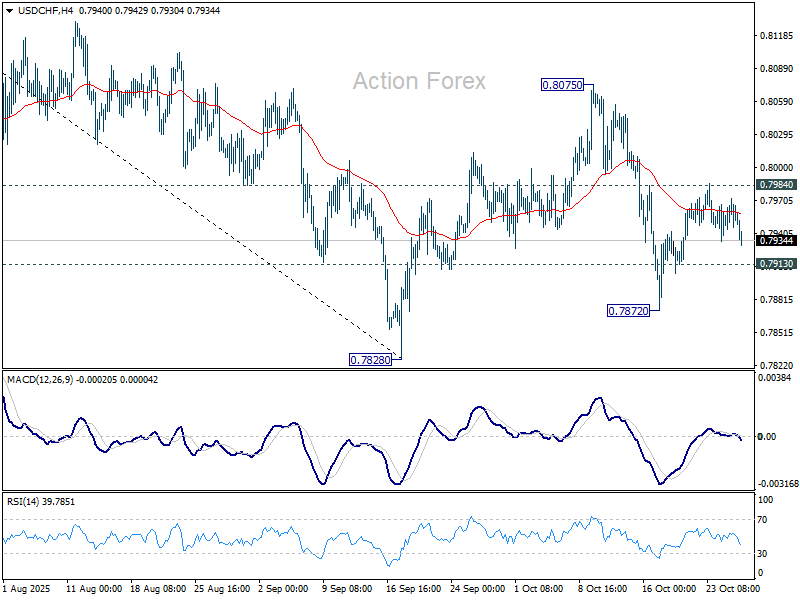
USD/CHF dips mildly today but stays in established range. Intraday bias stays neutral and deeper decline is still in favor with 0.7984 resistance intact. On the downside, below 0.7913 will turn bias to the downside for 0.7872 support, and then 0.7828 low. However, firm break of 0.7984 will suggest that corrective pattern from 0.7828 is extending with another rising leg, and target 0.8075 again.
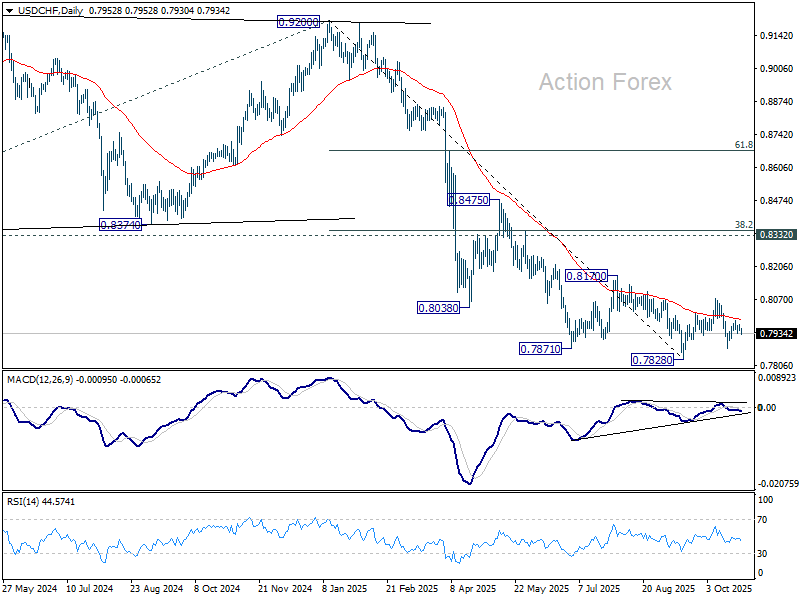
In the bigger picture, long term down trend from 1.0342 (2017 high) is still in progress. Next target is 100% projection of 1.0146 (2022 high) to 0.8332 from 0.9200 at 0.7382. In any case, outlook will stay bearish as long as 0.8332 support turned resistance holds (2023 low).
USD/JPY Daily Outlook
Daily Pivots: (S1) 152.54; (P) 152.90; (R1) 153.23; More...
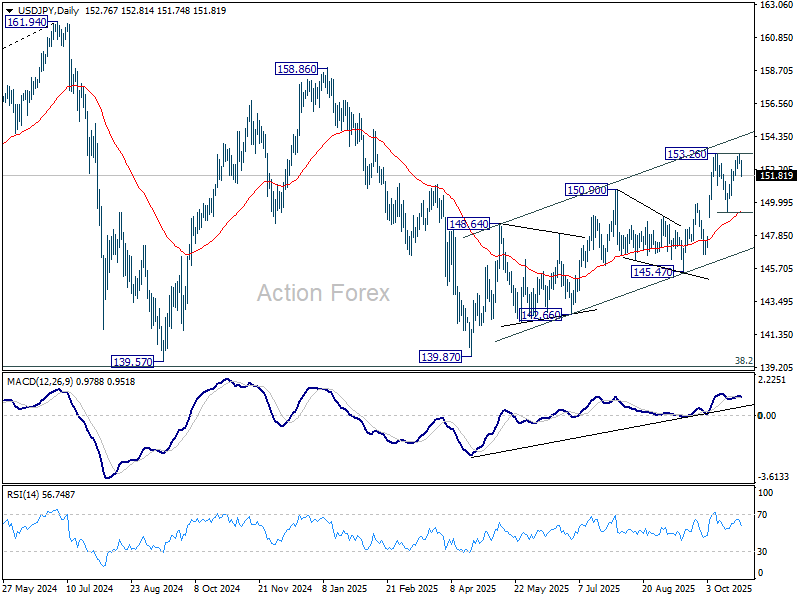
USD/JPY's break of 152.25 minor support and then 55 4H EMA (now at 151.95) suggests that rise from 149.37 has completed after rejection by 153.26 resistance. Fall from 153.24 should be then third leg of the corrective pattern from 153.26. Intraday bias is back on the downside for 149.37 support next. For now, risk will stay mildly on the downside as long as 153.24 holds, in case of recovery.
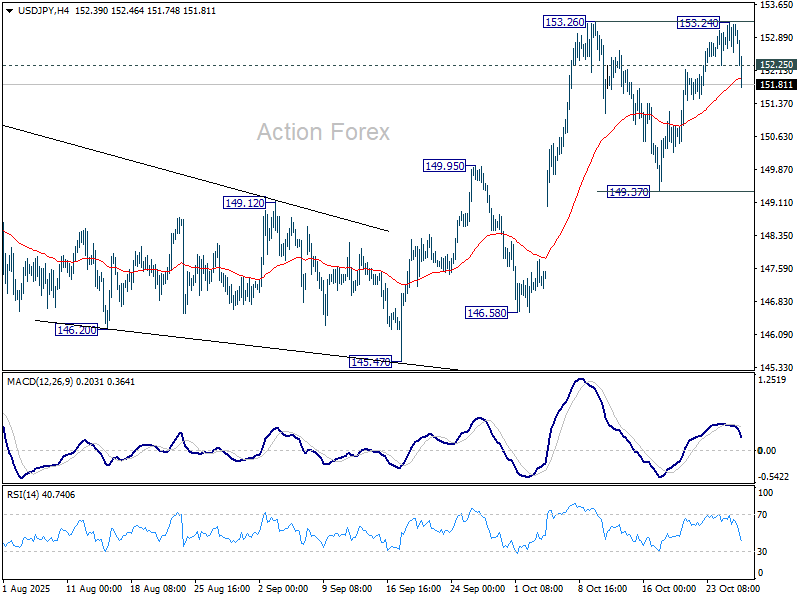
In the bigger picture, current development suggests that corrective pattern from 161.94 (2024 high) has completed with three waves at 139.87. Larger up trend from 102.58 (2021 low) could be ready to resume through 161.94 high. On the downside, break of 145.47 support will dampen this bullish view and extend the corrective pattern with another falling leg.
Smooth Trump–Takaichi Meeting Triggers Profit Taking in Nikkei and Yen Shorts
Yen rebounded notably today while Nikkei 225 cooled from its record highs, as investors took profits following a smooth meeting between U.S. President Donald Trump and Japan’s new Prime Minister Sanae Takaichi. The summit concluded with the signing of two new agreements that reaffirm the deep strategic and economic partnership between the two allies, while offering little in the way of market surprises.
The first accord — described by Trump as ushering in a “new golden age” of U.S.–Japan relations — builds on the series of bilateral deals signed earlier this year, emphasizing joint investments and defense cooperation. The second, more technical agreement focuses on critical minerals, outlining a framework to secure reliable supplies of rare earth elements essential to advanced manufacturing and clean energy production. Both leaders hailed the outcomes as proof of a durable alliance amid shifting regional dynamics.
For markets, however, the tone was less about fresh catalysts and more about consolidation. Japanese equities eased as traders locked in profits after an exceptional run. Yen’s rebound came as part of a broader defensive tilt across currency markets. With major risk events looming, investors shifted toward safe havens such as Yen and Swiss franc. The move also reflected short-term position adjustments after extended weakness in the Japanese currency.
In the U.S., political attention turned back to the Fed after Treasury Secretary Scott Bessent confirmed that the list of candidates to replace Chair Jerome Powell has been narrowed to five. The finalists include Fed Governors Christopher Waller and Michelle Bowman, National Economic Council Director Kevin Hassett, former Fed Governor Kevin Warsh, and BlackRock executive Rick Rieder.
Trump said he expects to announce his choice by the end of the year, even though Powell’s term doesn’t expire until May. The incumbent could remain as a Fed governor until 2028 if he chooses not to depart entirely. Markets took the news calmly, viewing the process as orderly but politically significant for the long-term direction of U.S. monetary policy.
For now, traders are tightening positions ahead of Wednesday’s FOMC decision, where a 25-basis-point cut to 3.75–4.00% is fully priced in. With the Fed staying in a data blackout due to the ongoing government shutdown, investors will focus heavily on Chair Powell’s tone for clues on whether another reduction in December remains on the table.
For the day so far, Yen leads the performance board, followed by Swiss Franc and Sterling. Dollar is the weakest major currency, trailed by Loonie and Aussie. Euro and Kiwi sit in the middle. The configuration reflects a cautious pre-FOMC tone.
In Asia, at the time of writing, Nikkei is down -0.78%. Hong Kong HSI is up 0.08%. China Shanghai SSE is up 0.14%. Singapore Strait Times is up 0.60%. Japan 10-year JGB yield is down -0.025 at 1.649. Overnight, DOW rose 0.71%. S&P 500 rose 1.23%. NASDAQ rose 1.86%. 10-year yield closed flat at 3.997. a
New record possibly delayed to 2026 as Gold and Silver enters extended consolidation phase
Gold and Silver came under renewed pressure at the start of the week. Gold briefly dropped below 4,000 mark before stabilizing, while Silver’s decline gathered pace after breaking key retracement support.
The timing of the selloff coincides with the announcement of a new U.S.–China framework deal designed to avert a major tariff escalation in November. The prospect of easing trade tensions has reduced demand for defensive assets, encouraging investors to rotate into equities and risk currencies. Optimism over the pending Trump–Xi summit has also supported broader market confidence.
Markets now await two pivotal events: Fed’s policy meeting tomorrow and the Trump–Xi summit on Thursday. These will likely set the near-term tone for the broader markets, including precious metals. Price behavior around these events will reveal whether the current pullback gathers further momentum.
So far, technical and macro signals both point to a more extended corrective phase than initially anticipated. Rather than a quick pause before resuming the uptrend, Gold and Silver may need to spend the rest of the year to form a base, laying the groundwork for a new leg higher in 2026.
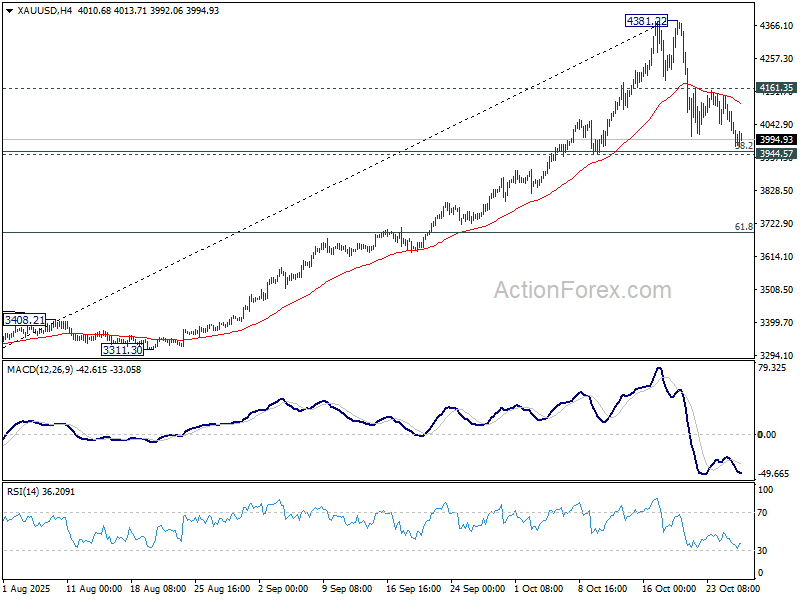
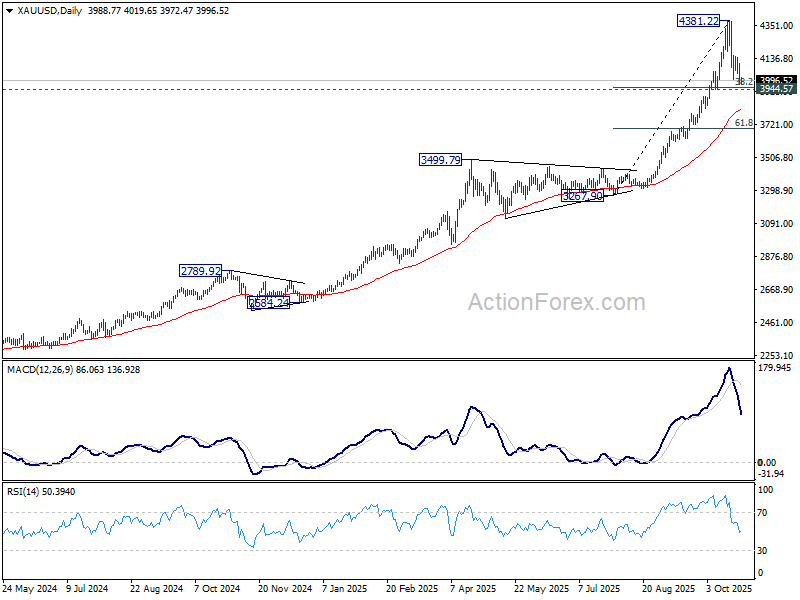
In Gold’s case, the decline still fits within a corrective structure to the rally from 3,267.90. The metal remains above 3,944.57 cluster support (38.2% retracement of 3267.90 to 4381.22 at 3955.93). A rebound from current level and break of 4,161.35 resistance would suggest the pullback from 4,381.22 is complete, targeting a retest of the record high. However, strong resistance is likely to cap gains near the previous peak, keeping Gold confined to a range between roughly 3,944 and 4,381.
However, decisive break below 3,944.57 would bring deeper correction to 55 D EMA (now at 3,818.40) where stronger demand should emerge to form a base.
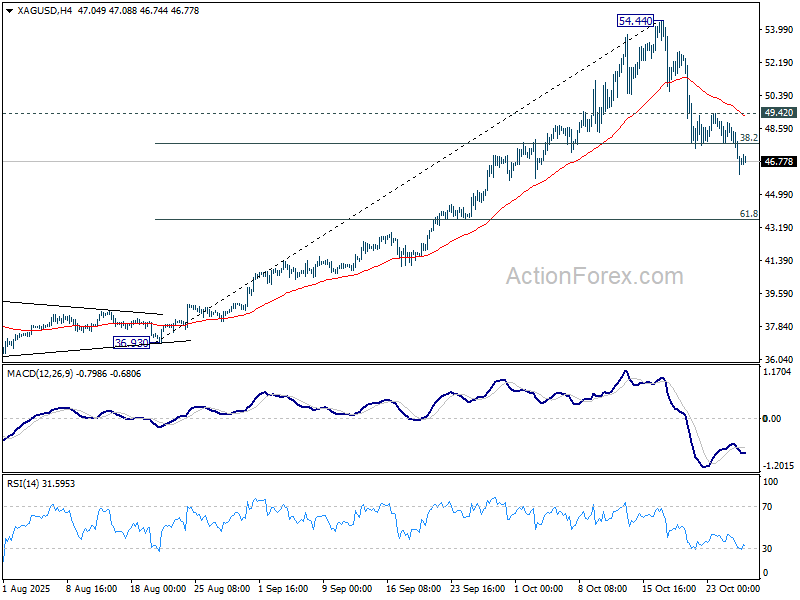
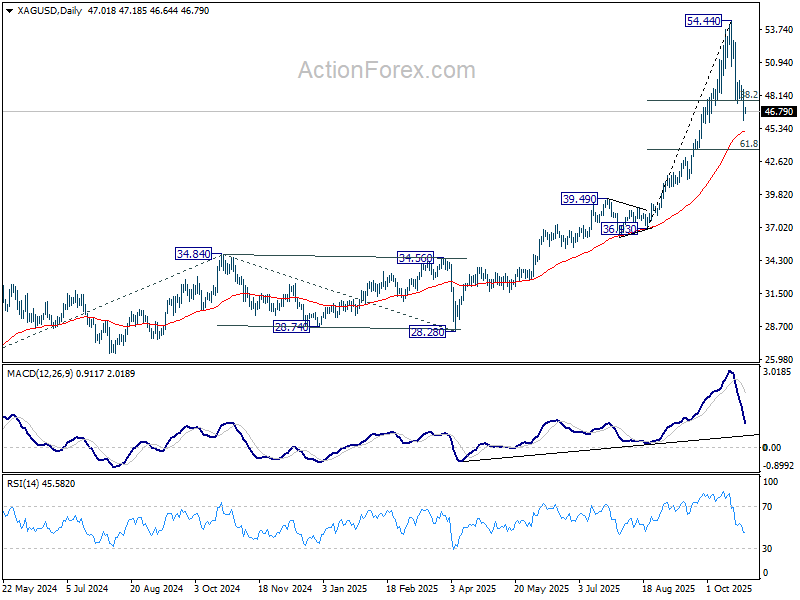
Silver’s decline has been more pronounced. The metal has already violated 38.2% retracement of 36.93 to 54.44 at 47.75. Still, it remains a correction of the rise from 36.93, rather than a larger one. A drop toward 55 D EMA (now at 45.16) is likely, but solid support is expected there. A rebound through 49.42 would mark the end of this corrective leg and bring stronger rise to retest 54.44.
However, sustained weakness below 55 Day EMA would imply Silver has entered a larger corrective phase to the rise from 28.28.
USD/JPY Daily Outlook
Daily Pivots: (S1) 152.54; (P) 152.90; (R1) 153.23; More...
USD/JPY's break of 152.25 minor support and then 55 4H EMA (now at 151.95) suggests that rise from 149.37 has completed after rejection by 153.26 resistance. Fall from 153.24 should be then third leg of the corrective pattern from 153.26. Intraday bias is back on the downside for 149.37 support next. For now, risk will stay mildly on the downside as long as 153.24 holds, in case of recovery.
In the bigger picture, current development suggests that corrective pattern from 161.94 (2024 high) has completed with three waves at 139.87. Larger up trend from 102.58 (2021 low) could be ready to resume through 161.94 high. On the downside, break of 145.47 support will dampen this bullish view and extend the corrective pattern with another falling leg.
Bitcoin Jumps, Breakout Above Resistance Reinforces Bullish Momentum
Key Highlights
- Bitcoin started a fresh surge above $113,000 and $114,000.
- BTC/USD cleared a key contracting triangle with resistance at $112,900 on the 4-hour chart.
- Ethereum also started a decent increase above $4,000.
- XRP price is back above $2.420 but faces hurdles near $2.6850.
Bitcoin Price Technical Analysis
Bitcoin price found support near $103,500 and started a fresh increase against the US Dollar. BTC climbed above $108,000 and $110,000 to enter a positive zone.
Looking at the 4-hour chart, the price surpassed the 50% Fib retracement level of the downward move from the $126,279 swing high to the $103,447 low. During the increase, the price broke a key contracting triangle with resistance at $112,900.
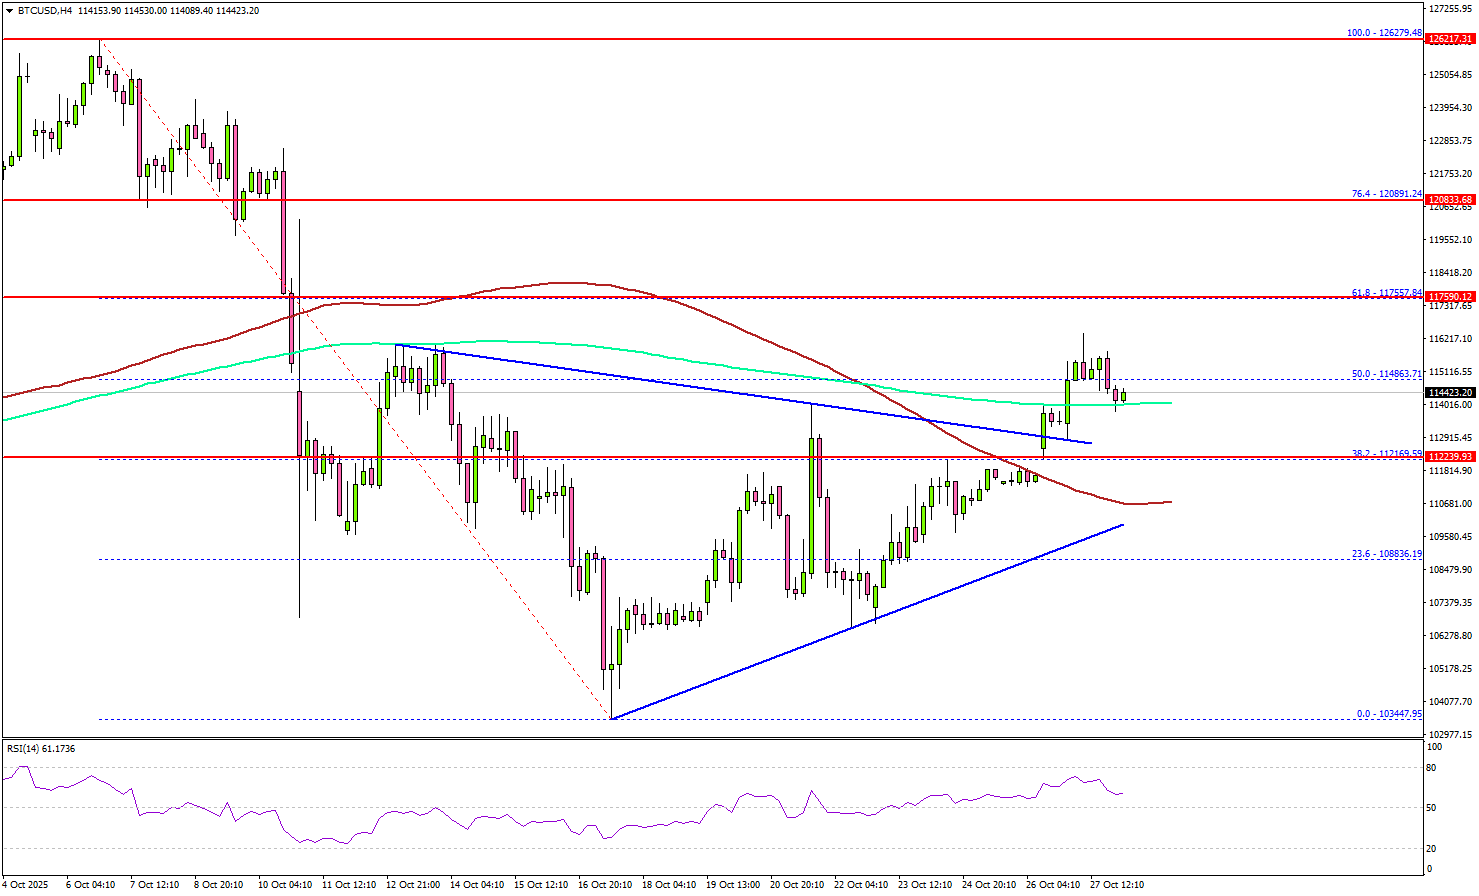
BTC settled above $113,000, the 100 simple moving average (red, 4-hour), and the 200 simple moving average (green, 4-hour). If the price extends gains, it could face resistance at $116,500.
The main hurdle is now forming near $117,550 and the 61.8% Fib retracement level of the downward move from the $126,279 swing high to the $103,447 low. A successful close above $117,550 might start another steady increase. In the stated case, the price may perhaps rise toward the $118,800 level. Any more gains might call for a test of $120,000.
Immediate support sits at $112,200. A downside break below $112,200 might start another decline. The next major support is $111,500. Any more losses might call for an extended decline toward the $108,800 support zone.
Looking at Ethereum, the price was able to follow Bitcoin and climbed above the $4,000 resistance region.
Today’s Key Economic Releases
- US House Pricing Index for August 2025 (MoM) - Forecast +0.1%, versus -0.1% previous.
- S&P/Case-Shiller Home Price Indices for August 2025 (YoY) - Forecast +1.9%, versus +1.8% previous.
New record possibly delayed to 2026 as Gold and Silver enters extended consolidation phase
Gold and Silver came under renewed pressure at the start of the week. Gold briefly dropped below 4,000 mark before stabilizing, while Silver’s decline gathered pace after breaking key retracement support.
The timing of the selloff coincides with the announcement of a new U.S.–China framework deal designed to avert a major tariff escalation in November. The prospect of easing trade tensions has reduced demand for defensive assets, encouraging investors to rotate into equities and risk currencies. Optimism over the pending Trump–Xi summit has also supported broader market confidence.
Markets now await two pivotal events: Fed’s policy meeting tomorrow and the Trump–Xi summit on Thursday. These will likely set the near-term tone for the broader markets, including precious metals. Price behavior around these events will reveal whether the current pullback gathers further momentum.
So far, technical and macro signals both point to a more extended corrective phase than initially anticipated. Rather than a quick pause before resuming the uptrend, Gold and Silver may need to spend the rest of the year to form a base, laying the groundwork for a new leg higher in 2026.
In Gold’s case, the decline still fits within a corrective structure to the rally from 3,267.90. The metal remains above 3,944.57 cluster support (38.2% retracement of 3267.90 to 4381.22 at 3955.93). A rebound from current level and break of 4,161.35 resistance would suggest the pullback from 4,381.22 is complete, targeting a retest of the record high. However, strong resistance is likely to cap gains near the previous peak, keeping Gold confined to a range between roughly 3,944 and 4,381.
However, decisive break below 3,944.57 would bring deeper correction to 55 D EMA (now at 3,818.40) where stronger demand should emerge to form a base.
Silver’s decline has been more pronounced. The metal has already violated 38.2% retracement of 36.93 to 54.44 at 47.75. Still, it remains a correction of the rise from 36.93, rather than a larger one. A drop toward 55 D EMA (now at 45.16) is likely, but solid support is expected there. A rebound through 49.42 would mark the end of this corrective leg and bring stronger rise to retest 54.44.
However, sustained weakness below 55 Day EMA would imply Silver has entered a larger corrective phase to the rise from 28.28.
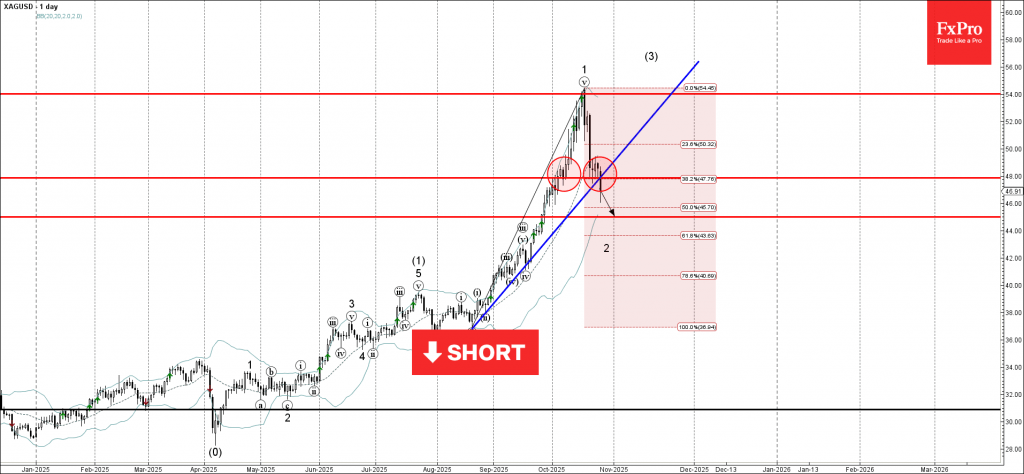
Silver Wave Analysis
Silver: ⬇️ Sell
- Silver broke support zone
- Likely to fall to support level 45.00
Silver recently broke the support zone between the support trendline from August, support level 48.00 and the 38.2% Fibonacci correction of the upward impulse from August.
The breakout of this support zone accelerated the active minor correction 2 of the extended impulse wave (3) from August.
Silver can be expected to fall further toward the next support level 45.00, the breakout of which can lead to further losses toward the round support level 40.00.