Sample Category Title
Gold (XAU/USD) Price Bounces 1.5% From Three-Week Lows. Will Bulls Reclaim the $4000/oz Handle?
Gold prices saw a sharp decline in early trade today breaching the $3900/oz handle and touching a three-week low. The selloff this week is down to a host of factors but the main one being increasing hopes of a US-China trade deal which has led to a risk-on environment.
There is also potential profit taking, a slightly stronger US Dollar and the upcoming Federal Reserve meeting which could all be contributing towards Gold's recent pullback.
The precious metal has risen around 1.5% since the European session lows to trade around the $3960/oz handle at the time of writing. The question now is, can bulls breach the $4000/oz handle once more?
Looking Ahead - Trump-Xi Meeting, FOMC Meeting
Two big events are coming up that will affect the markets, the US Dollar and Gold prices.
First, financial markets are preparing for the Federal Reserve's (Fed) announcement on Wednesday, where they are widely expected to cut the benchmark interest rate by 0.25%. The main focus for investors will be on what the Fed says about future rate cuts, as traders have already assumed there will be one more cut in December and one more in 2026.
Second, everyone is watching the expected meeting between US President Donald Trump and Chinese President Xi Jinping later this week, hoping the leaders will find a way to stop the trade tensions from getting worse and iron out a trade deal between the world's two largest economies.
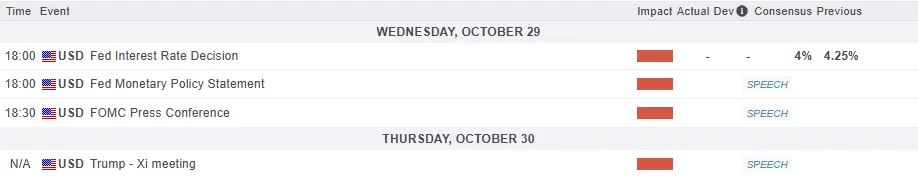
For all market-moving economic releases and events, see the MarketPulse Economic Calendar. (click to enlarge)
Technical Analysis - Gold (XAU/USD)
From a technical standpoint, Gold did follow through after last weeks double top pattern, with the precious metal declining a lot further with very little pullback.
The precious metal has broken below the 50 and 100-day MAs. This is the first time Gold trades below both of them since August 22, 2025 on the four-hour timeframe.
Gold has bounced aggressively off key support around the 3900 mark.
Immediate resistance rests at the 3975 handle before the 4000 handle comes back into focus.
Personally i would prefer a candle close above the 4013 handle which would be an indication that structure has changed. This would provide me with piece of mind regarding bullish interest in the precious metal remaining strong.
A break below the 3900 handle though opens up a retest of the 3875 handle before the 3850 and 3800 handles come into focus.
Gold (XAU/USD) Four-Hour Chart, October 28, 2025
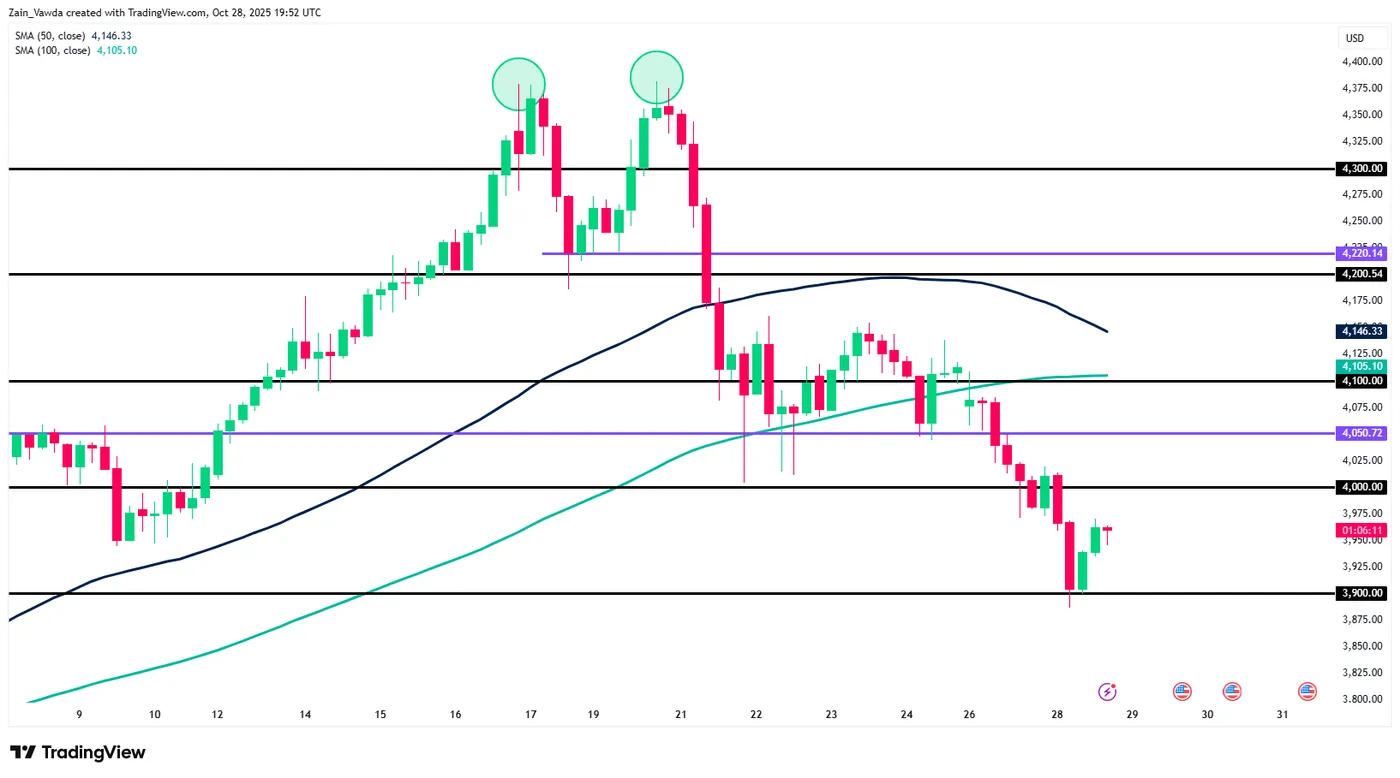
Source: TradingView (click to enlarge)
Client Sentiment Data - XAU/USD
Looking at OANDA client sentiment data and market participants are Long on Gold with 75% of traders net-long. I prefer to take a contrarian view toward crowd sentiment and thus the fact that the majority of traders are net-long suggests that Gold prices could continue to slide in the near-term.
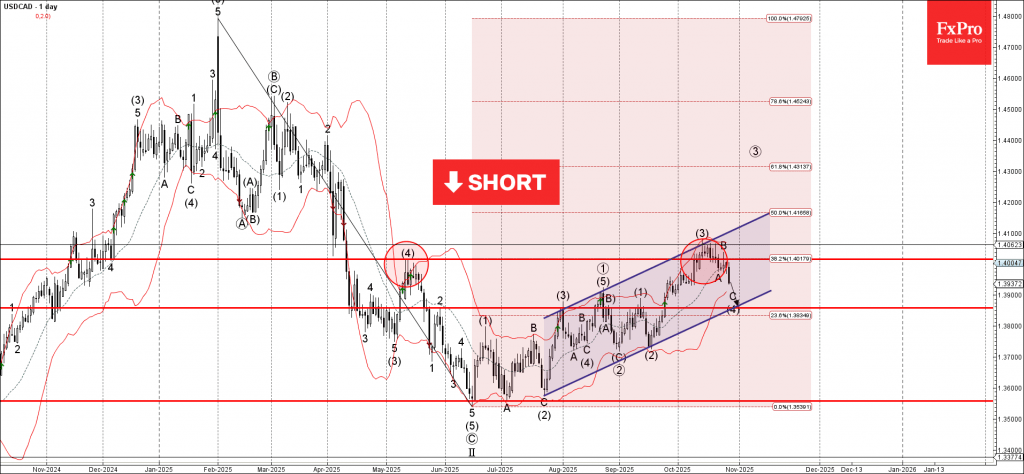
USDCAD Wave Analysis
USDCAD: ⬇️ Sell
- USDCAD falling inside wave C
- Likely to test support level 1.3860
USDCAD currency pair recently reversed down from the resistance zone between the key resistance level 1.4015 (former monthly high from May), upper daily Bollinger Band and the 38.2% Fibonacci correction of the downward impulse from January.
This resistance zone was further strengthened by the resistance trendline of the daily up channel from July.
Given the strongly bearish US dollar sentiment seen today, USDCAD currency pair can be expected to fall to the next support level 1.3860 (target for the completion of the active wave C).
USDJPY Wave Analysis
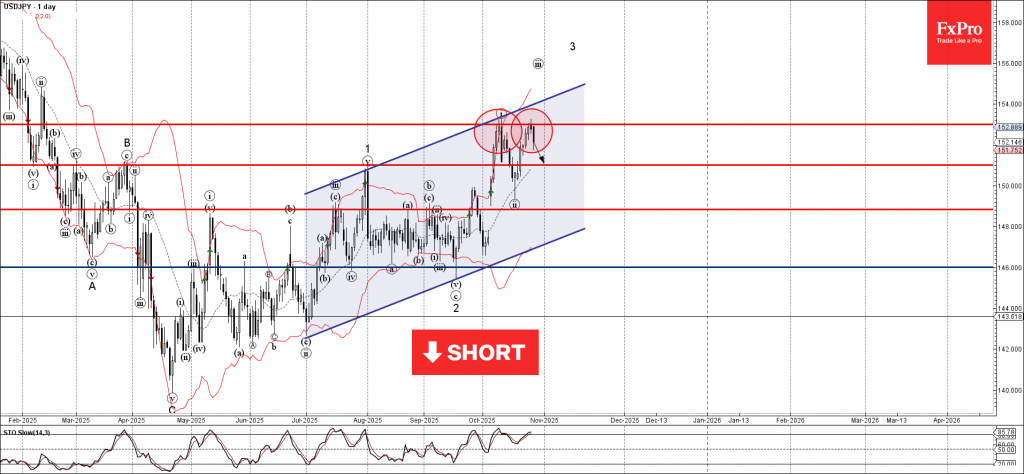
USDJPY: ⬇️ Sell
- USDJPY reversed from resistance area
- Likely to fall to support level 151.00
USDJPY currency pair recently reversed down from the resistance area between the strong resistance level 153.000 (which stopped the previous impulse wave i) and the upper daily Bollinger Band.
The downward reversal from this resistance zone is lily to form the daily Japanese candlesticks reversal pattern Evening Star.
Given the strength of the resistance level 153.00 and the overbought daily Stochastic, USDJPY currency pair can be expected to fall to the next support level 151.00.
EURAUD Wave Analysis
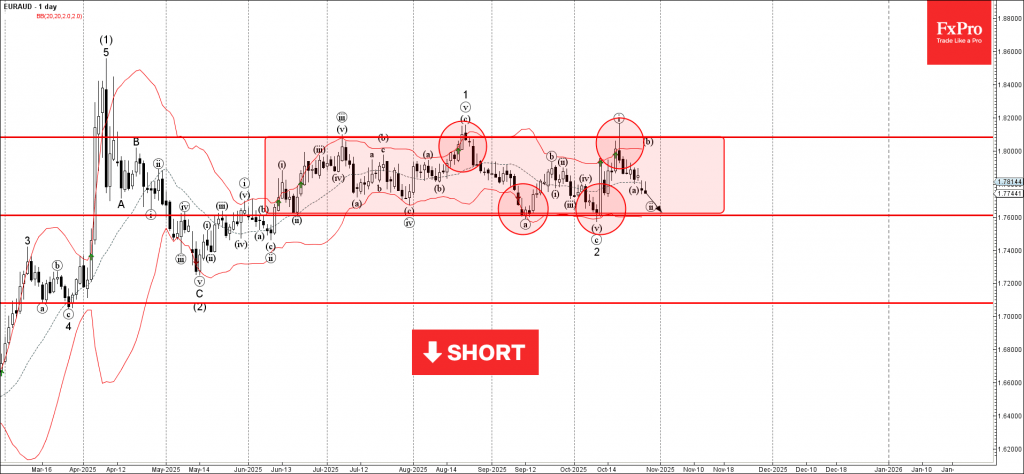
EURAUD: ⬇️ Sell
- EURAUD falling inside sideways price range
- Likely to fall to support level 1.7600
EURAUD currency pair continues to fall inside the minor correction ii, which started earlier from the resistance level 1.8080 (upper border of the narrow sideways price range inside which the pair has been moving from June).
The active correction ii belongs to the impulse wave 3 of the intermediate impulse sequence (3) from the middle of May.
Given the strongly bullish Australian dollar sentiment seen today, EURAUD currency pair can be expected to fall to the next support level 1.7600, lower border of the active sideways price range.
Sunset Market Commentary
Markets
ADP, the compiler of the unofficial/private labor market report ahead of the monthly payrolls, announced it’ll produce a four-week moving average of the latest total private employment change, starting today. The gauge will be published every Tuesday except in the week when its monthly jobs report is on tap. The inaugural release showed an average increase of 14 250 jobs in the four weeks ending on October 11. The bond market seems to approve with yields shortly after the release rising several basis points. Moves remain technically irrelevant though with current changes varying between +0.3 (30-yr) and 1.8 bps (5-yr). Other US data today included Conference Board consumer confidence easing from an upwardly revised 95.6 to 94.6. An improvement in the present situation was offset by a more downbeat future assessment (holding near the lows of the past three years ex. Liberation Day). European rates barely budget, unfazed by the newest Bank Lending Survey nor by the ECB consumer inflation expectations September questionnaire. The year ahead gauge eased to 2.7% from 2.8% while the longer-term ones remained unchanged at 2.5% (3-yr) and 2.2% (5-yr). Economic growth and unemployment expectations stabilized at -1.2% and 10.7% respectively. The latter is to be compared with the 10.2% consumers perceived the unemployment rate to be currently, indicating they hold a relatively stable labour market outlook. Stocks in Europe are slightly down on the day while those in the US hit new record highs again, powered by Big Tech (eg. Microsoft). Tomorrow’s and Thursday’s Q3 earnings from Alphabet, Microsoft, Meta, Amazon and Apple (which hit the $4tn market cap) may be pivotal in sustaining the risk rally.
The pound is suffering on FX markets. BRC October data this morning showed food prices dropping 0.4% m/m, the most since 2020. This followed last week’s reveal by the official CPI that food inflation already eased more than expected back in September. The ones at the Bank of England citing strongly rising food prices (and its critical role in shaping inflation expectations) as a reason not to lower rates see their argument weakened. UK money markets raise easing bets for the November 6 meeting to more than 30%. That kicked of initial GBP weakness with the technicals taking over afterwards. The topside EUR/GBP break out of a symmetrical triangle formation was followed by the pair piercing through the July 2025/November 2023 highs near the 0.877-zone. EUR/GBP 0.8867 serves as an intermediate resistance ahead of the symbolical 0.90 barrier. GBP/USD slides to its 200dMA around 1.323. The Japanese yen is at the other side of the spectrum, outperforming all major peers. USD/JPY trades around 152.25. We find the euro and dollar in between, keeping each other balanced. EUR/USD is going nowhere around 1.164 with all eyes now moving to the Fed and ECB. Aside from a rate cut, the former is expected to halt QT to ensure there’s still an ”ample” amount of liquidity in the system. The overnight bank lending rate (SOFR) meanwhile moved back above the Fed’s upper bound rate (4.25%).
News & Views
The ECB’s quarterly Bank Lending Survey (Q3) showed banks reporting a small, unexpected net tightening of credit standards (net percentage of banks 4%) amid perceived risks to the economic outlook. Credit standards remained unchanged for housing loans and tightened moderately for consumer credit (net 5%). Firms’ demand for loans increased slightly in net terms (2%) but remained weak amid geopolitical uncertainty and trade tensions. Demand for housing loans continued to increase substantially (net 28%), while demand for consumer credit was broadly unchanged (net 1%). EMU banks furthermore reported a small net tightening impact of NPL ratios and other credit quality indicators on their credit standards for loans to firms.
More details emerge from last week’s fourth plenum in China as the government publishes more documents of its plans for the next five years. The Communist Party will form an economic development model driven by domestic demand and powered by consumption. Together with significantly boosting consumption to become less reliant on exports they aim to keep tech and manufacturing as top priorities. Manufacturing should remain at a “reasonable” level as a share of GDP compared to 2020 guidance to keep it “basically stable”. Other highlights from the five-year plan include a vow to enhance fiscal sustainability but pursue a proactive fiscal policy and the earlier reported promotion of the internationalization of the Chinese renminbi.
WTI Oil Drops 2% on Signals of Further OPEC+ Production Increase
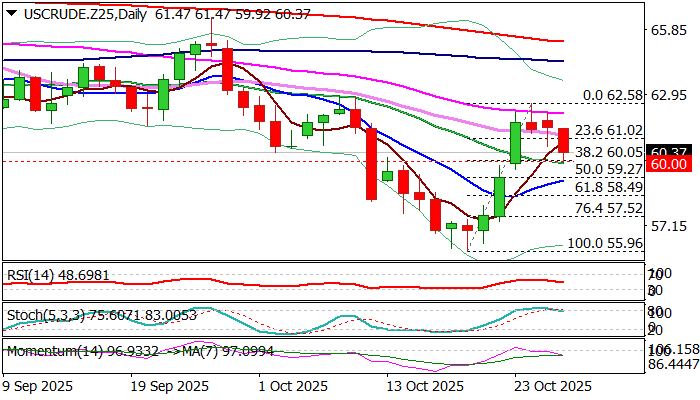
WTI oil price remains in red for the third consecutive day and accelerated lower on Tuesday, losing about 2% of its value during Asian / early European trading.
Oil price was initially deflated by optimism about potential US-China trade deal that stalled earlier strong rally sparked by US sanctions on two biggest Russian oil producers.
The latest signals that OPEC+ will further increase production in December (the cartel members will hold online meeting on Sunday), added to more pressure on oil prices.
Fresh bears cracked important support at $60 (psychological / Fibo 38.2% of $55.96/$62.58 upleg / 20 DMA) but faced headwinds at this zone that so far prevented break lower.
Significance of the support and oversold hourly studies contributed to slight bounce, which rather marks consolidation, as daily studies are predominantly bearish (negative momentum / stochastic emerging from oversold zone / MA’s in mixed setup) and likely points to bearish continuation scenario.
Firm break of $60 trigger to expose targets at $59.27/12 (50% retracement / 10 DMA).
Conversely, ability to hold above $60 to temporarily sideline bears, while bounce and close above $61.00 zone (broken Fibo 23.6% / 30DMA) would provide relief.
Res: 60.66; 61.02; 61.47; 62.15
Sup: 60.00; 59.65; 29.27; 59.12
US consumer confidence dips to 94.6 in October, inflation expectations tick higher to 5.9%
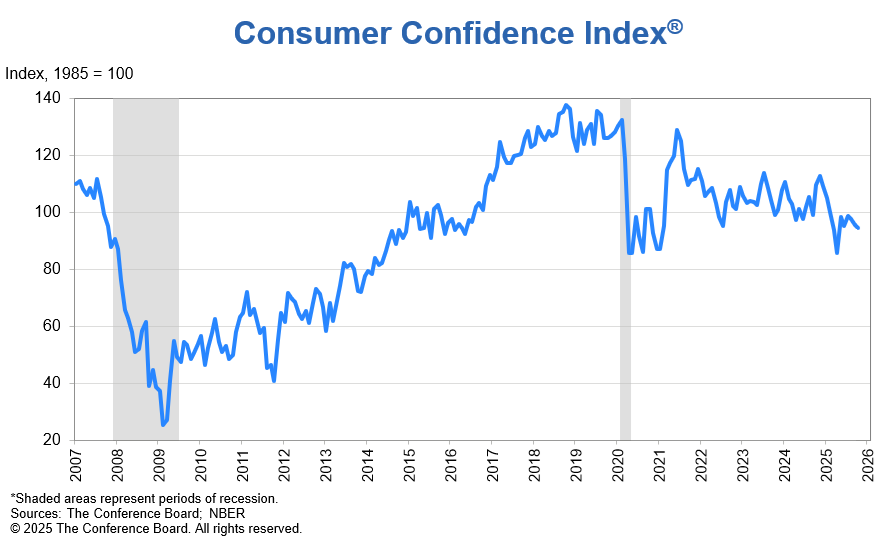
U.S. consumer confidence slipped modestly in October, with Conference Board’s headline index easing to 94.6 from 95.6, though still beating expectations of 93.9.
The breakdown showed mixed sentiment — Present Situation Index improved by 1.8 points to 129.3, while Expectations Index fell by 2.9 points to 71.9, remaining well below the 80 threshold that typically signals recession risks.
Inflation expectations ticked higher, with the average 12-month outlook rising to 5.9% from 5.8% in September.
Stephanie Guichard, Senior Economist at the Conference Board, said confidence “moved sideways in October,” with limited changes among subcomponents that largely offset each other. Consumers grew more cautious about job prospects and business conditions, while optimism toward future income also eased slightly.
Euro’s Second Chance
- Trade war de-escalation.
- The Fed will continue to cut rates.
- Politics is holding back the euro.
- Verbal interventions are helping the yen.
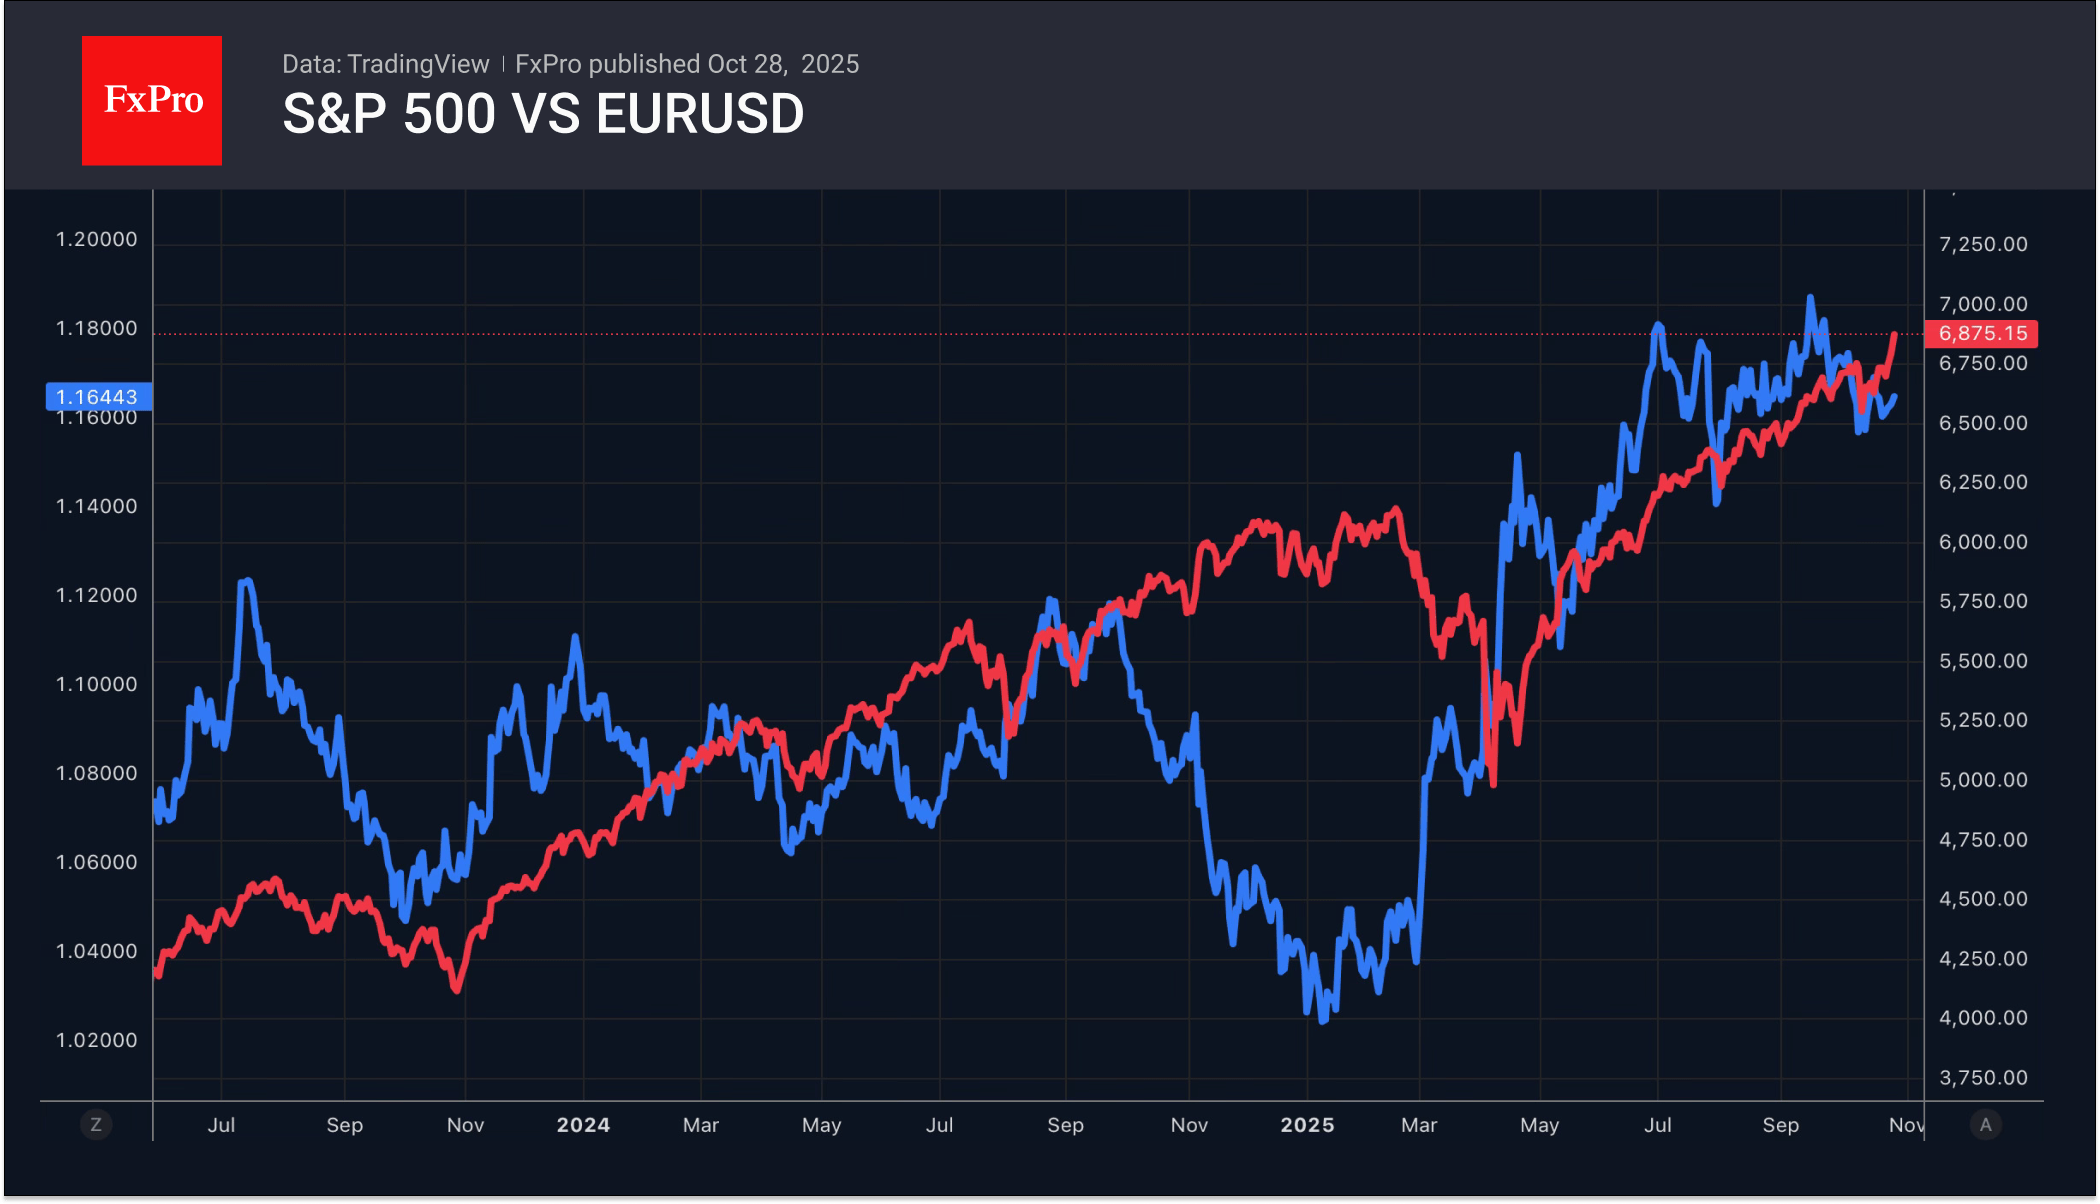
The de-escalation of the US-China trade conflict has shifted market attention to central bank monetary policy. Finance Minister Scott Bessent said that the negotiations had created a successful framework for the two countries’ leaders to sign a deal. Beijing says a preliminary consensus has been reached. The risks of a trade war have receded, US stock indices have hit new highs, global risk appetite has increased, and the EURUSD has risen.
The futures market gives a 98% probability of a cut in the federal funds rate to 4% in October and a 95% chance of a cut to 3.75% in December. Derivatives expect a further cut in March. The ECB is expected to pause rate cuts until 2027. The deposit rate last fell to 2% in June. Since the summer, Christine Lagarde said the European Central Bank feels comfortable.
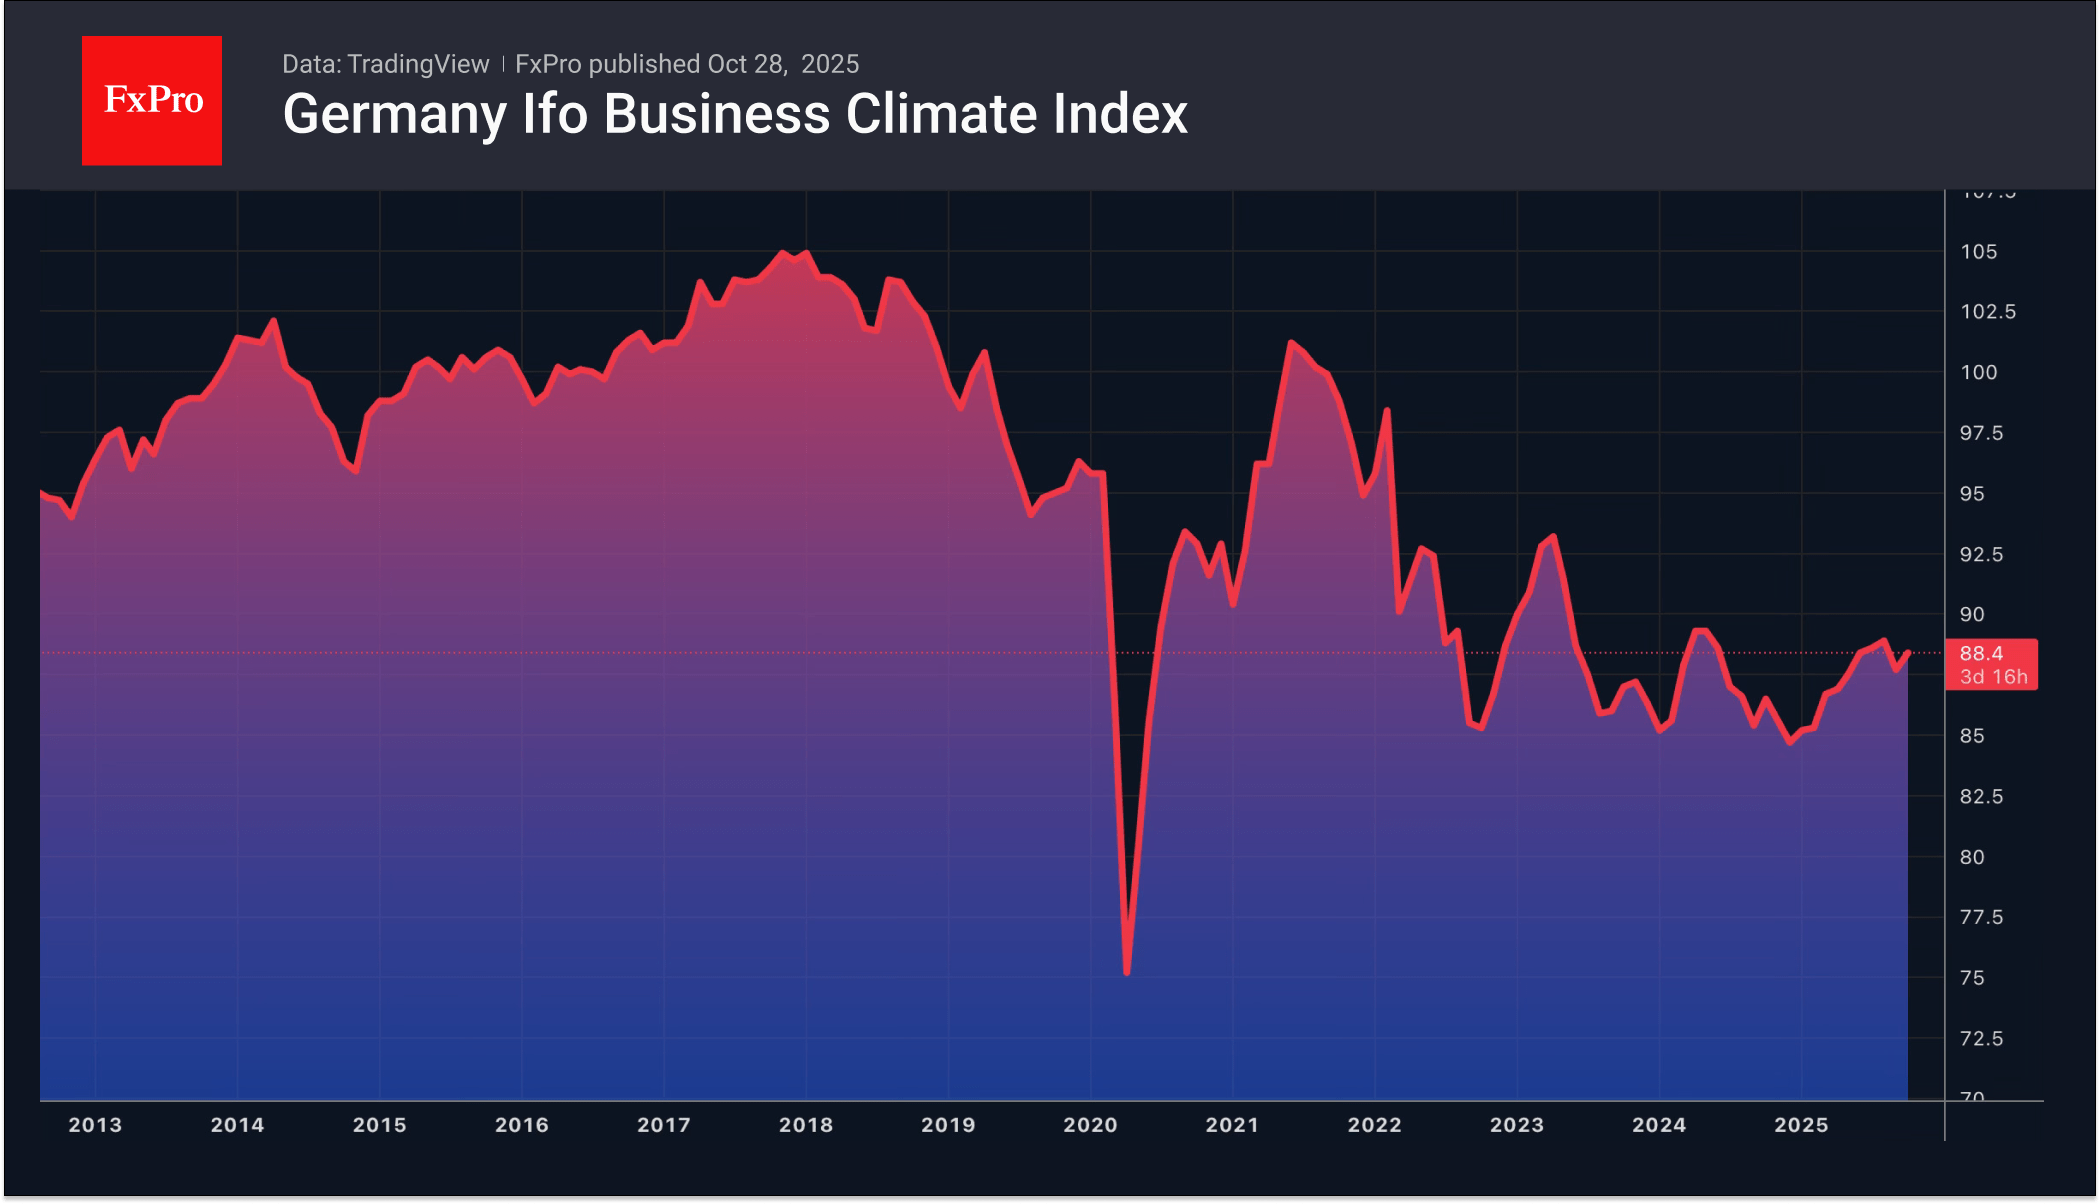
Some Bloomberg experts predict a rate hike in 2026. This would require an improvement in the European economy. Pleasant surprises from eurozone business activity and German business sentiment indicate positive GDP growth in the fourth quarter. In July-September, gross domestic product most likely grew by 0.1%.
The divergence in monetary policy between the ECB and the Fed, coupled with positive signals from the European economy, gives EURUSD bulls hope for a recovery in the uptrend. However, events in France continue to dampen the euro. The Socialists do not rule out a new vote of no confidence in the government if parliament do not accept their proposal to raise taxes on the rich to reduce the budget deficit.
While EURUSD awaits the results of the Fed and ECB meetings, the yen is strengthening thanks to verbal interventions. Government officials have stated that they will continue to closely monitor the dynamics of the yen on the international currency market. Finance Minister Satsuki Katayama noted that monetary policy issues were not directly discussed at the meeting with Scott Bessent. If they were discussed indirectly, the risks of currency intervention may increase. Investors preferred to play it safe and close some of their long positions on USDJPY.
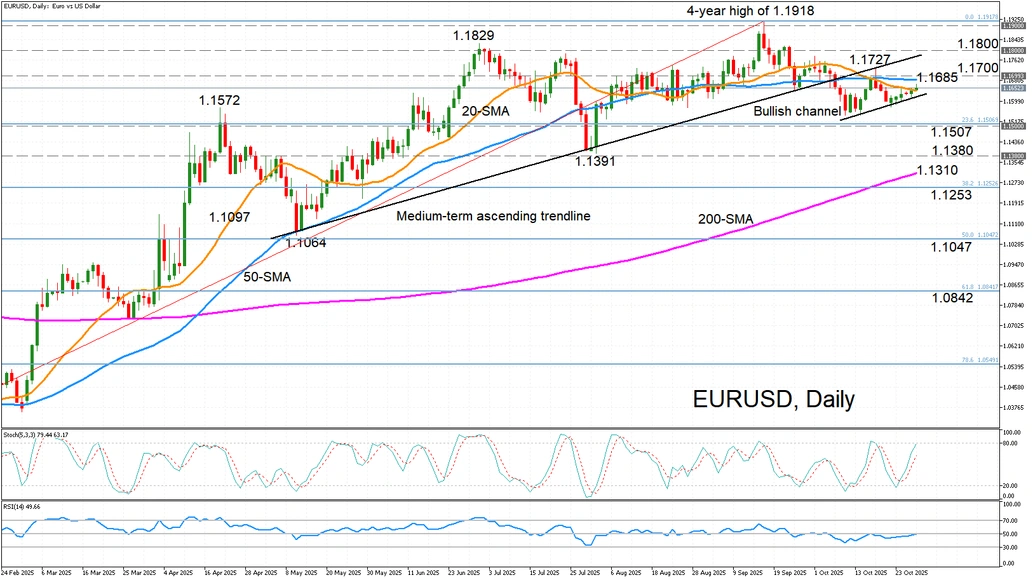
EUR/USD Maintains Tight Range in Ascending Channel
- EUR/USD edges higher within short-term ascending channel.
- But bulls struggle to build positive momentum.
EURUSD has been steadily crawling higher over the past week, holding near the lower bound of the upward trending channel that’s been developing since early October. The 20-day simple moving average (SMA) was capping the price action in the previous three sessions, but the pair managed to climb above it today. However, further increases will be challenging as the 50-day SMA is waiting to curb the advances not much higher at 1.1685.
The tight trading range is likely to continue at least until the Fed’s monetary policy meeting on Wednesday, with further volatility is anticipated on Thursday when the ECB is set to announce its rate decision. The odds are in favour of EURUSD heading into those major risk events, as the former is expected to cut rates and the latter to stay on pause.
The momentum indicators support the picture of strengthening upside in the short term. The stochastic oscillator is rising sharply and close to entering overbought territory, while the RSI is climbing steadily, reaching the 50-neutral level.
If the price is able to overcome the strong resistance region of the 50-day SMA and the 1.1700 level, the next test will be the upper bound of the bullish channel, which is approaching the 1.1800 handle. A successful break above 1.1800 would open the way for September’s four-year high of 1.1918, which if surpassed, would reinforce the longer-term uptrend.
However, in the event that the Fed and ECB meetings support a stronger US dollar and the price slips below the bullish channel, there’s unlikely to be any support until the 23.6% Fibonacci retracement of the January-September uptrend at 1.1507. Breaching this would accelerate the decline, with the next key support potentially coming from the 1.1380 zone, which has been a heavily congested area in the past and is near the August low of 1.1391.
Even lower, attention would turn to the 200-day SMA at 1.1310. Violating this would put the 2025 rally at risk, shifting the positive outlook to neutral.
All in all, EUR/USD is just about holding onto its bullish bias in the near term and desperately needs to reclaim the 1.1700 level to solidify the current upward momentum.