
Sample Category Title
USD/CHF Daily Outlook
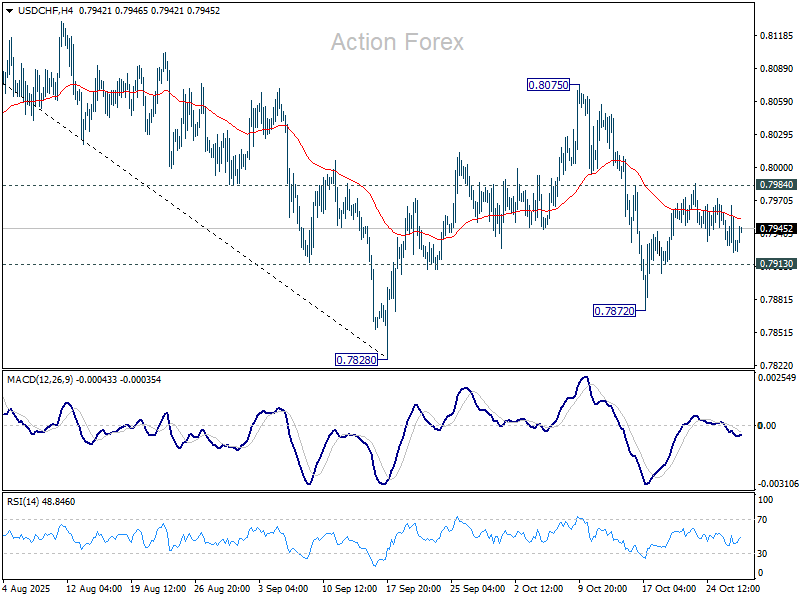
Daily Pivots: (S1) 0.7917; (P) 0.7942; (R1) 0.7959; More…
Range trading continues in USD/CHF and intraday bias stays neutral at this point. On the downside, below 0.7913 will turn bias to the downside for 0.7872 support, and then 0.7828 low. However, firm break of 0.7984 will suggest that corrective pattern from 0.7828 is extending with another rising leg, and target 0.8075 again.
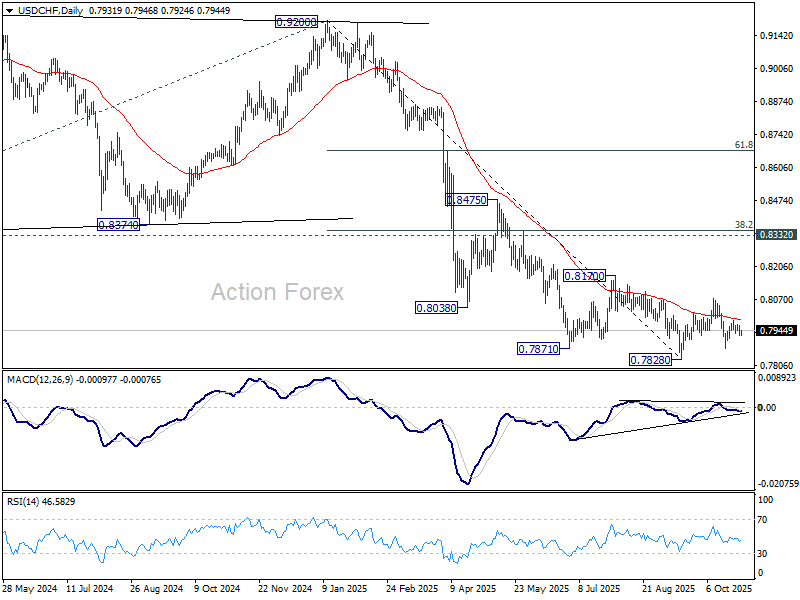
In the bigger picture, long term down trend from 1.0342 (2017 high) is still in progress. Next target is 100% projection of 1.0146 (2022 high) to 0.8332 from 0.9200 at 0.7382. In any case, outlook will stay bearish as long as 0.8332 support turned resistance holds (2023 low).
EUR/USD Daily Outlook
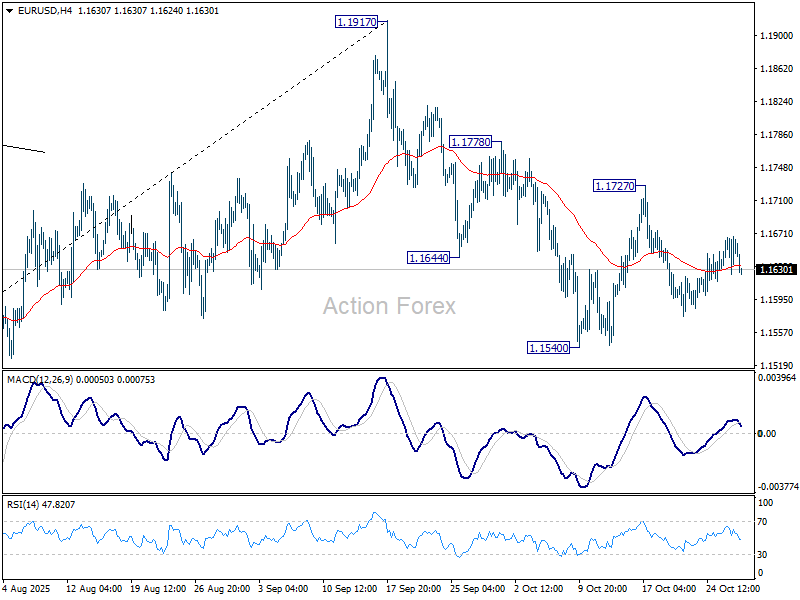
Daily Pivots: (S1) 1.1628; (P) 1.1648; (R1) 1.1672; More…
Range trading continues in EUR/USD and intraday remains neutral for the moment. On the downside, below 1.1540 will resume the fall from 1.1917 and target 1.1390 support, or even further to 38.2% retracement of 1.0176 to 1.1917 at 1.1252. On the upside, though, break of 1.1727 resistance will turn bias back to the upside for 1.1778, and then retest of 1.1917 high instead.
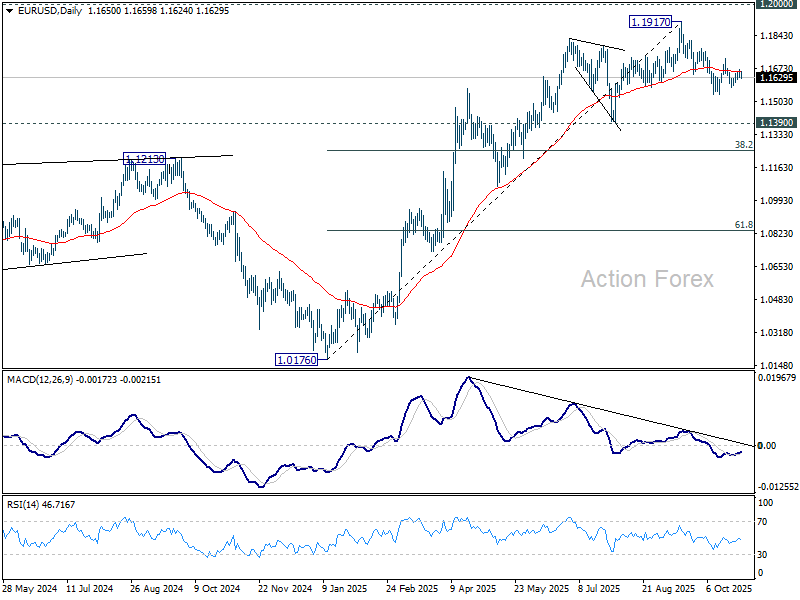
In the bigger picture, considering bearish divergence condition in D MACD, a medium term top is likely in place at 1.1917, just ahead of 1.2 key psychological level. As long as 55 W EMA (now at 1.1301) holds, the up trend from 0.9534 (2022 low) is still expected to continue. Decisive break of 1.2000 will carry larger bullish implications. However, sustained trading below 55 W EMA will argue that rise from 0.9534 has completed as a three wave corrective bounce, and keep outlook bearish.
GBP/USD Daily Outlook
Daily Pivots: (S1) 1.3223; (P) 1.3297; (R1) 1.3345; More...
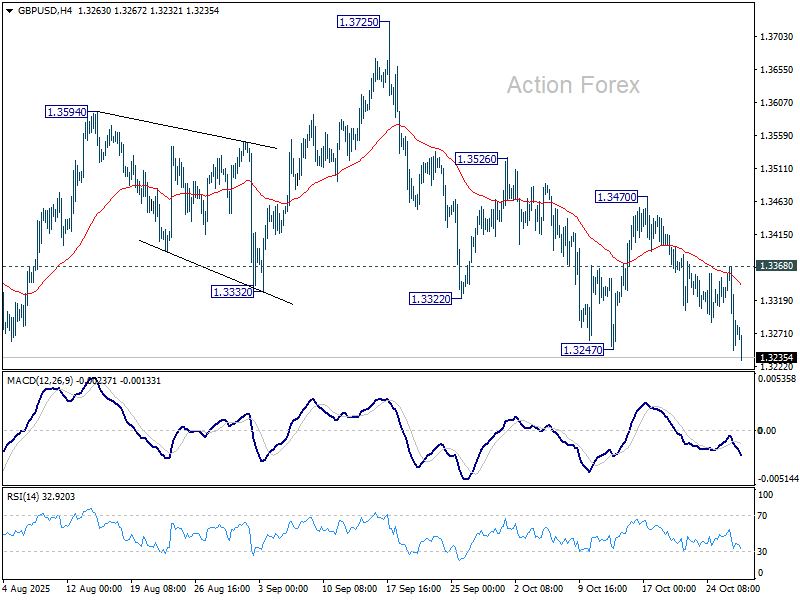
GBP/USD's fall from 1.3725 resumed by breaking through 1.3247 support today. Intraday bias is now on the downside for 1.3140 cluster (38.2% retracement of 1.2099 to 1.3787 at 1.3142). Strong support is expected there to contain downside to complete the corrective pattern from 1.3787. On the upside, above 1.3368 minor resistance will turn intraday bias neutral first. However, decisive break of 1.3140/2 will complete a double top pattern (1.3787/3725) and turn near term outlook bearish.
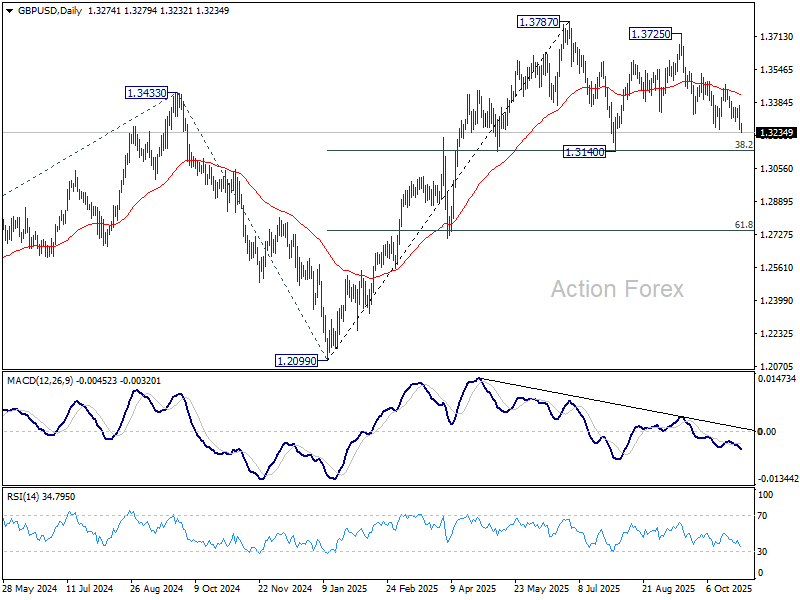
In the bigger picture, rise from 1.0351 (2022 low) is still seen as a corrective move. Further rally could be seen to 61.8% projection of 1.0351 to 1.3433 (2024 high) from 1.2099 (2025 low) at 1.4004. But strong resistance could emerge from 1.4248 (2021 high) to limit upside. Sustained break of 55 W EMA (now at 1.3191) will argue that a medium term top has already formed and bring deeper fall back to 1.2099.
Volatility Surges as Central Bank Bonanza Starts; BoC and Fed to Cut Today
Volatility picked up sharply as markets entered the first leg of a two-day central bank bonanza, with the BoC and the Fed set to announce policy decisions today, followed by the BoJ and European ECB tomorrow. Traders are bracing for a flurry of rate moves, guidance shifts, and potential surprises that could set the tone for global markets into November.
Aussie leads the weekly performance chart, bolstered by today’s stronger-than-expected CPI report that forced traders to rapidly unwind bets on a near-term RBA rate cut. The stronger inflation pulse, coupled with firmer activity data, reinforced the case for the RBA to hold rates steady for an extended period.
That view gained further traction after CBA became a major domestic bank to call for no more rate cuts in the current cycle. The bank’s economists emphasized that the RBA would need to see a “material” rise in unemployment and softer inflation before considering renewed easing.
Commodity-linked peers also benefited. Kiwi and Loonie advanced in tandem, buoyed by firm risk appetite as Wall Street hit new highs. Optimism that the U.S.–China tariff truce will be extended past November helped sustain the global equity rally, with DOW, S&P 500, and NASDAQ all closing at record levels overnight.
Meanwhile, Yen saw renewed buying interest after U.S. Treasury Secretary Scott Bessent voiced support for Japan’s monetary independence, urging Prime Minister Sanae Takaichi’s new government to allow the BoJ to decide its policy direction without political pressure. The remarks were widely interpreted as a signal that Washington would not object to a potential BoJ rate hike in coming months. Still, Yen’s strength failed to offset the broader strength in risk and commodity currencies. Yen is sitting mid-table along with Swiss Franc.
At the weaker end of the spectrum, Sterling remains under heavy pressure amid renewed fiscal worries. Reports of a GBP 20B deterioration in the UK’s public finances have dented confidence in Chancellor Rachel Reeves’ upcoming budget plans. Dollar is the second weakest major as traders await tonight’s Fed decision, where a 25bps cut is fully priced in, followed by Euro which rounds out the top three.
Focus now turns squarely to the BoC and Fed announcements later today. Both are expected to cut interest rates by 25bps, but forward guidance will be crucial. The BoC is likely nearing the end of its easing cycle, while the Fed’s tone will shape expectations for an additional cut in December.
In Asia, at the time of writing, Nikkei is up 2.21% at new record. Hong Kong is on holiday. China Shanghai SSE is up 0.41%. Singapore Strait Times is down -0.22%. Japan 10-year JGB yield is up 0.015 at 1.655. Overnight, DOW rose 0.34%. S&P 500 rose 0.23%. NASDAQ rose 0.80%. 10-year yield fell -0.014 to 3.983.
USD/CAD break or hold? 1.3930 support tested ahead of BoC–Fed double cuts
Global attention turns to North America today, with both the BoC and the Fed expected to deliver 25bps rate cuts. The BoC’s decision will come first at 13:45 GMT, followed by the Fed’s announcement later at 18:00 GMT.
The BoC’s overnight rate is widely expected to fall to 2.25%, reflecting the bank’s persistent concern about growth despite recent resilience in jobs and inflation data. Policymakers remain uneasy about the impact of U.S. tariffs and weak domestic demand, even as headline inflation overshoots target. For Governor Tiff Macklem and his team, the near-term goal remains cushioning the economy without reigniting price pressures.
Most analysts expect today’s cut to be the final one of this cycle, with the BoC likely to enter a prolonged pause. A Reuters poll showed 21 of 34 economists forecasting rates at 2.25% by the end of 2026, implying stability for an extended period. Only eight respondents saw further easing to 2.00% or below.
Still, the balance of risks leans dovish, as agreed by most, and a terminal rate at 2.00% is a real possibility. Growth remains soft, exports are vulnerable to trade restrictions, and business confidence has yet to rebound. Policymakers are likely to leave the door open for further cuts without explicitly signaling another move.
Attention will then shift to the Fed, which is widely expected to lower the federal funds rate to 3.75–4.00%. Futures markets also price in a 90% probability of another 25bps cut in December, taking the target range to 3.50–3.75%.
However, the 2026 policy path remains clouded by diverging risks — inflation could reaccelerate if tariffs bite harder, even as the labor market shows signs of fatigue. A recent Reuters survey reflected this uncertainty, showing economists split seven ways on where rates might stand by the end of next year — anywhere between 2.25%–2.50% and 3.75%–4.00%.
The debate has been complicated further by speculation over who will replace Chair Jerome Powell when his term ends in May. Treasury Secretary Scott Bessent confirmed earlier this week that the shortlist includes Fed Governors Christopher Waller and Michelle Bowman, National Economic Council Director Kevin Hassett, former Fed Governor Kevin Warsh, and BlackRock executive Rick Rieder, all representing slightly different shades of monetary philosophy.
Given that backdrop, Powell is unlikely to make any firm commitments on policy beyond today’s meeting. Markets will instead look to the December Summary of Economic Projections and updated dot plot for clarity on the 2026 rate path.
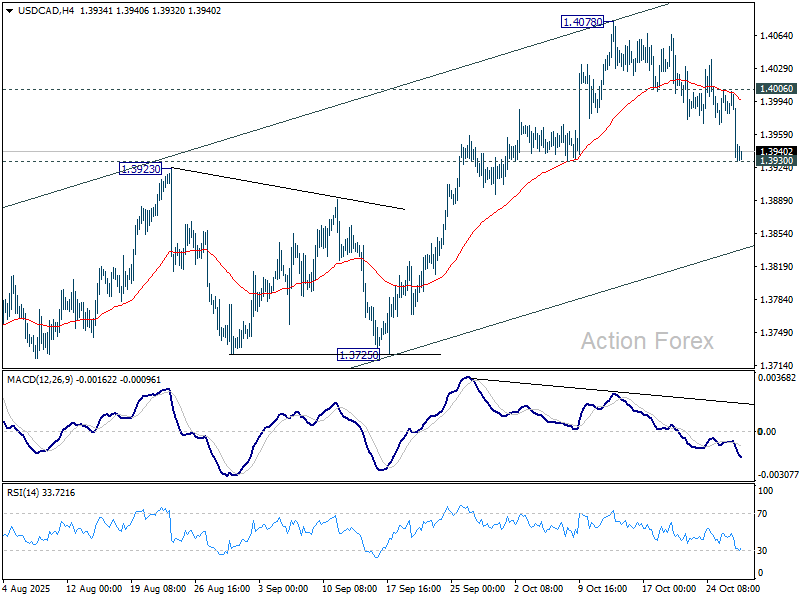
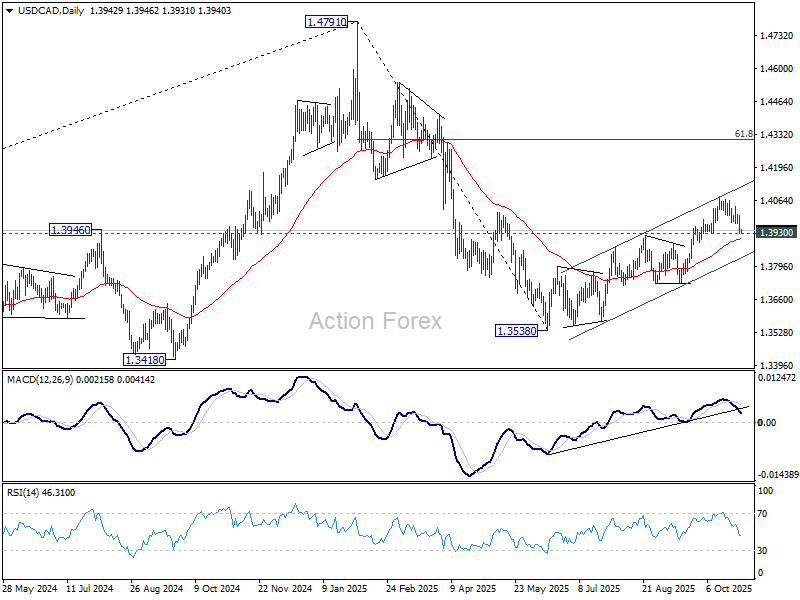
In the currency markets, USD/CAD has weakened sharply just ahead of the twin policy events, hovering just above 1.3930 support after yesterday’s selloff. A rebound from current levels would keep the broader uptrend from 1.3538 intact, with a break above 1.4006 suggesting the rally’s resumption through 1.4078.
Conversely, decisive break below 1.3930 would signal that the advance has likely topped, opening the way for a deeper pullback toward the channel floor near 1.3829, where the next key directional cue will emerge.
Australia inflation shock: CPI surges to 3.2%, core re-accelerates
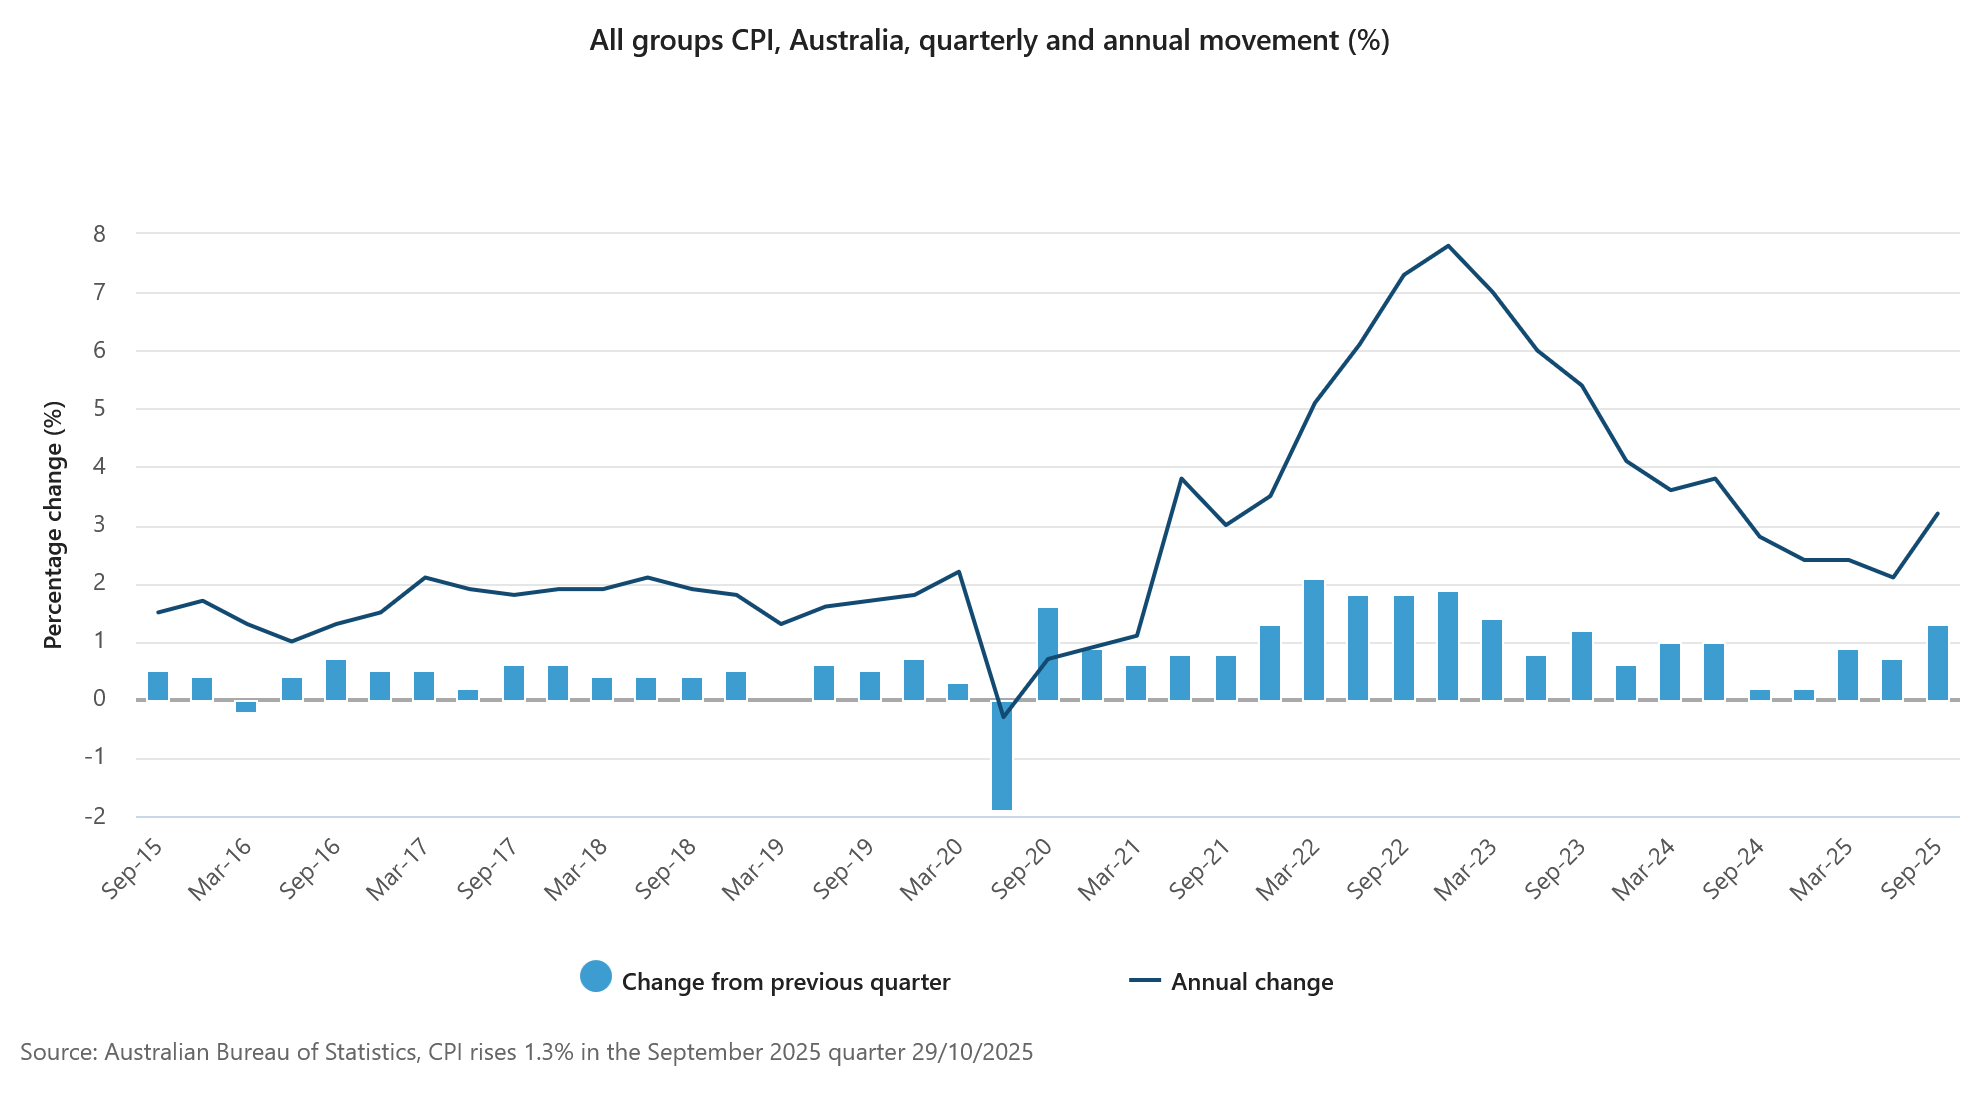
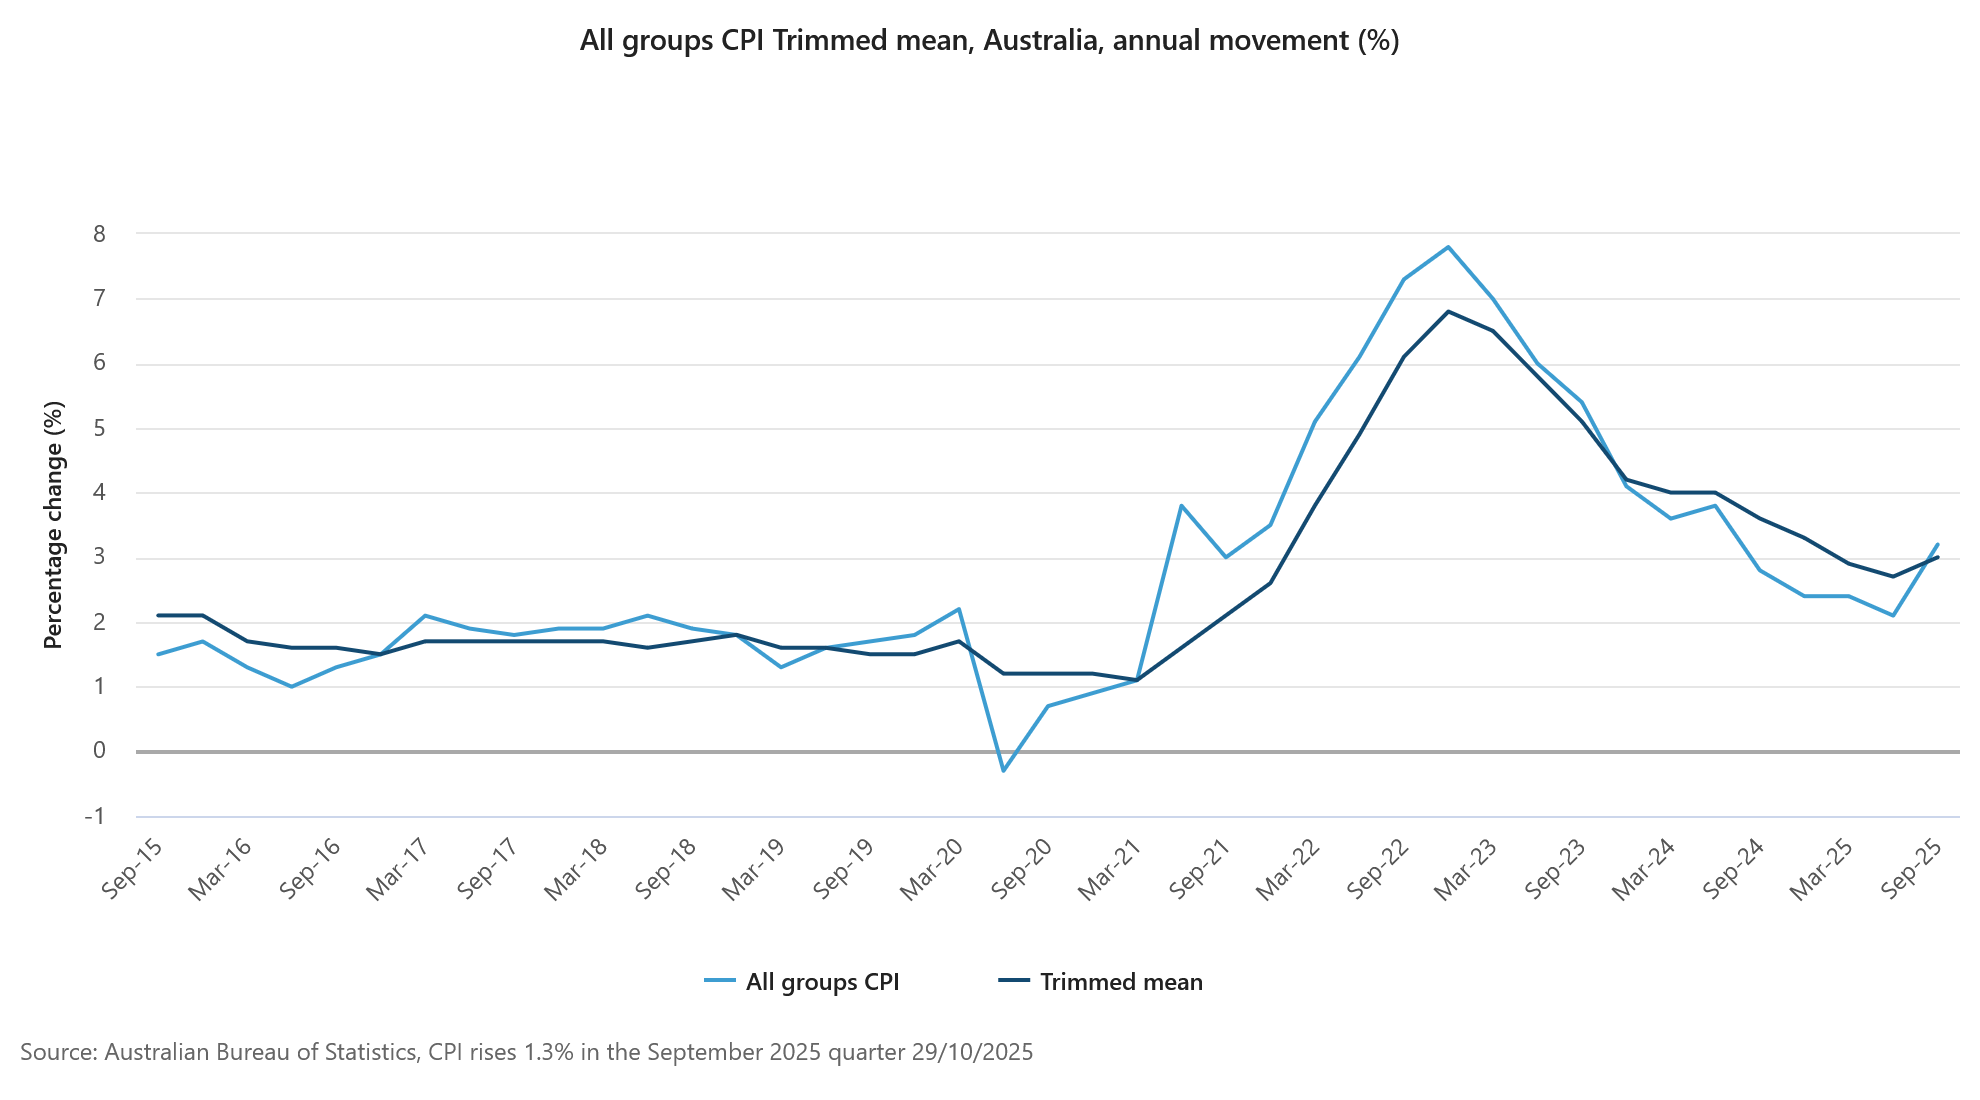
Australia’s inflation surprised sharply to the upside in Q3, reigniting concerns that price pressures are proving stickier than expected. Headline CPI jumped 1.3% qoq, accelerating from 0.7% in Q2 and beating expectations of 1.1% — marking the strongest quarterly increase since Q1 2023. The Australian Bureau of Statistics said the largest contributor was a 9.0% rise in electricity costs, which alone drove much of the headline surge.
On an annual basis, CPI rose to 3.2% yoy, sharply higher than the previous 2.1% yoy and above forecasts of 3.0%. That marks the fastest pace of annual inflation since Q2 2024. Electricity costs were again the main driver, soaring 23.6% from a year earlier despite targeted government relief measures.
Core inflation was equally strong. Trimmed mean CPI — the RBA’s preferred measure — rose 1.0% qoq, up from 0.7% and above expectations of 0.8%. Annually, core inflation accelerated to 3.0% yoy from 2.7%, underlining persistent price pressures across utilities and essential services, exceeding the RBA’s 2–3% target range again. This marks the first uptick in the trimmed mean since Q4 2022, confirming that underlying price momentum remains firm.
The data strengthen the case for the RBA to delay or even reconsider rate-cut expectations for the near term.
Aussie soars, Sterling slumps, GBP/AUD confirms medium term bearish turn
Aussie surged sharply on after the hotter-than-expected inflation print shattered hopes for a RBA rate cut next week. Crucially, the upside surprise wasn’t confined to energy-driven headline gains. The broad-based acceleration in core inflation confirmed that price pressures have become more entrenched.
RBA Governor Michele Bullock had warned earlier this week that any 0.9% or higher quarterly increase in the trimmed mean would constitute a “material miss.” The 1.0% outcome squarely fits that definition, virtually guaranteeing the central bank will keep rates unchanged at next week’s policy meeting. With economic activity showing tentative signs of recovery, the balance of risks has shifted decisively toward fewer rate cuts over the next year.
In the currency markets, Aussie’s rally coincided with broad-based weakness in the British pound, which remains weighed down by fiscal concerns following reports of a worsening UK budget shortfall. As a result, GBP/AUD has become the week’s standout mover for now, falling more than 1.5% to its lowest levels in months.
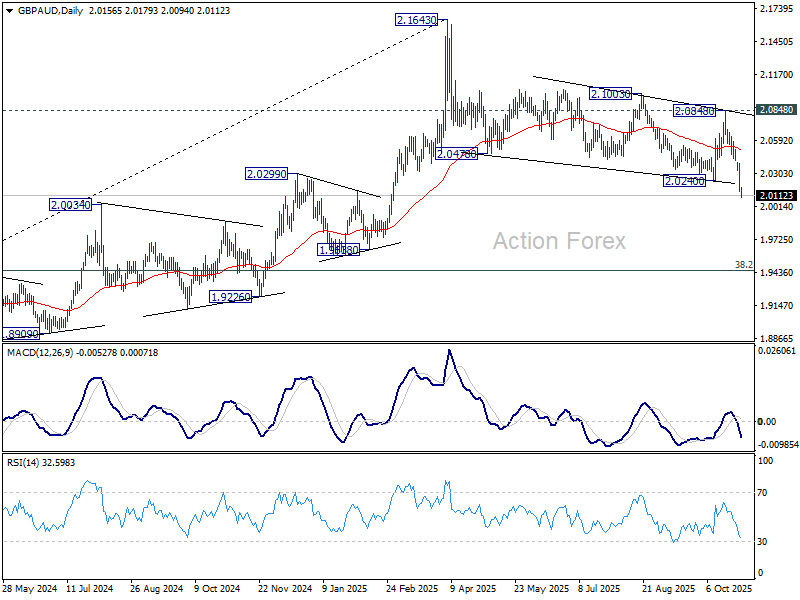
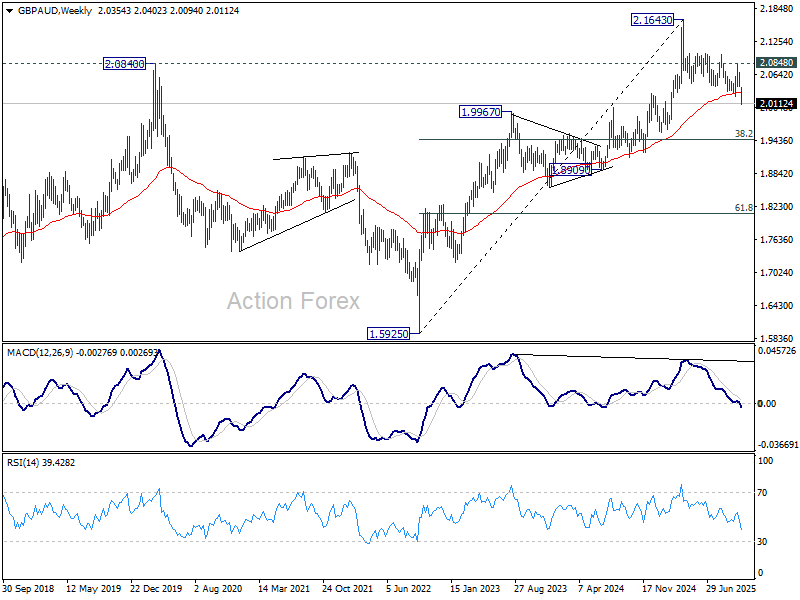
Technically, GBP/AUD's break of 2.0240 support confirms resumption of the decline from 2.1643. More importantly, the decisive break below the 55 W EMA (now at 2.0309) reinforces a bearish bias, confirming a medium-term top at 2.1643 under bearish MACD divergence conditions.
The fall from 2.1643 high is viewed as at least correcting the entire rise from 1.5925 (2022 low), with scope to even reversing the whole move.
In either case, as long as 2.0858 resistance holds, the outlook remains bearish with the next target at 38.2% retracement of 1.5925 to 2.1643 at 1.9459.
GBP/USD Daily Outlook
Daily Pivots: (S1) 1.3223; (P) 1.3297; (R1) 1.3345; More...
GBP/USD's fall from 1.3725 resumed by breaking through 1.3247 support today. Intraday bias is now on the downside for 1.3140 cluster (38.2% retracement of 1.2099 to 1.3787 at 1.3142). Strong support is expected there to contain downside to complete the corrective pattern from 1.3787. On the upside, above 1.3368 minor resistance will turn intraday bias neutral first. However, decisive break of 1.3140/2 will complete a double top pattern (1.3787/3725) and turn near term outlook bearish.
In the bigger picture, rise from 1.0351 (2022 low) is still seen as a corrective move. Further rally could be seen to 61.8% projection of 1.0351 to 1.3433 (2024 high) from 1.2099 (2025 low) at 1.4004. But strong resistance could emerge from 1.4248 (2021 high) to limit upside. Sustained break of 55 W EMA (now at 1.3191) will argue that a medium term top has already formed and bring deeper fall back to 1.2099.
USD/CAD break or hold? 1.3930 support tested ahead of BoC–Fed double cuts
Global attention turns to North America today, with both the BoC and the Fed expected to deliver 25bps rate cuts. The BoC’s decision will come first at 13:45 GMT, followed by the Fed’s announcement later at 18:00 GMT.
The BoC’s overnight rate is widely expected to fall to 2.25%, reflecting the bank’s persistent concern about growth despite recent resilience in jobs and inflation data. Policymakers remain uneasy about the impact of U.S. tariffs and weak domestic demand, even as headline inflation overshoots target. For Governor Tiff Macklem and his team, the near-term goal remains cushioning the economy without reigniting price pressures.
Most analysts expect today’s cut to be the final one of this cycle, with the BoC likely to enter a prolonged pause. A Reuters poll showed 21 of 34 economists forecasting rates at 2.25% by the end of 2026, implying stability for an extended period. Only eight respondents saw further easing to 2.00% or below.
Still, the balance of risks leans dovish, as agreed by most, and a terminal rate at 2.00% is a real possibility. Growth remains soft, exports are vulnerable to trade restrictions, and business confidence has yet to rebound. Policymakers are likely to leave the door open for further cuts without explicitly signaling another move.
Attention will then shift to the Fed, which is widely expected to lower the federal funds rate to 3.75–4.00%. Futures markets also price in a 90% probability of another 25bps cut in December, taking the target range to 3.50–3.75%.
However, the 2026 policy path remains clouded by diverging risks — inflation could reaccelerate if tariffs bite harder, even as the labor market shows signs of fatigue. A recent Reuters survey reflected this uncertainty, showing economists split seven ways on where rates might stand by the end of next year — anywhere between 2.25%–2.50% and 3.75%–4.00%.
The debate has been complicated further by speculation over who will replace Chair Jerome Powell when his term ends in May. Treasury Secretary Scott Bessent confirmed earlier this week that the shortlist includes Fed Governors Christopher Waller and Michelle Bowman, National Economic Council Director Kevin Hassett, former Fed Governor Kevin Warsh, and BlackRock executive Rick Rieder, all representing slightly different shades of monetary philosophy.
Given that backdrop, Powell is unlikely to make any firm commitments on policy beyond today’s meeting. Markets will instead look to the December Summary of Economic Projections and updated dot plot for clarity on the 2026 rate path.
In the currency markets, USD/CAD has weakened sharply just ahead of the twin policy events, hovering just above 1.3930 support after yesterday’s selloff. A rebound from current levels would keep the broader uptrend from 1.3538 intact, with a break above 1.4006 suggesting the rally’s resumption through 1.4078.
Conversely, decisive break below 1.3930 would signal that the advance has likely topped, opening the way for a deeper pullback toward the channel floor near 1.3829, where the next key directional cue will emerge.
GBP/USD Drops Further As Traders Brace For Crucial Fed Rate Signal
Key Highlights
- GBP/USD started a fresh decline below 1.3350 and 1.3320.
- A major bearish trend line is forming with resistance at 1.3355 on the 4-hour chart.
- Gold price declined below $4,020 and $4,000.
- Bitcoin is trimming gains below the $114,000 resistance.
GBP/USD Technical Analysis
The British Pound failed to stay above 1.3400 against the US Dollar. GBP/USD started a fresh decline and traded below the key support at 1.3350.
Looking at the 4-hour chart, the pair settled below 1.3350, the 100 simple moving average (red, 4-hour), and the 200 simple moving average (green, 4-hour). The decline gained pace below 1.3320 and the pair even spiked below 1.3280.
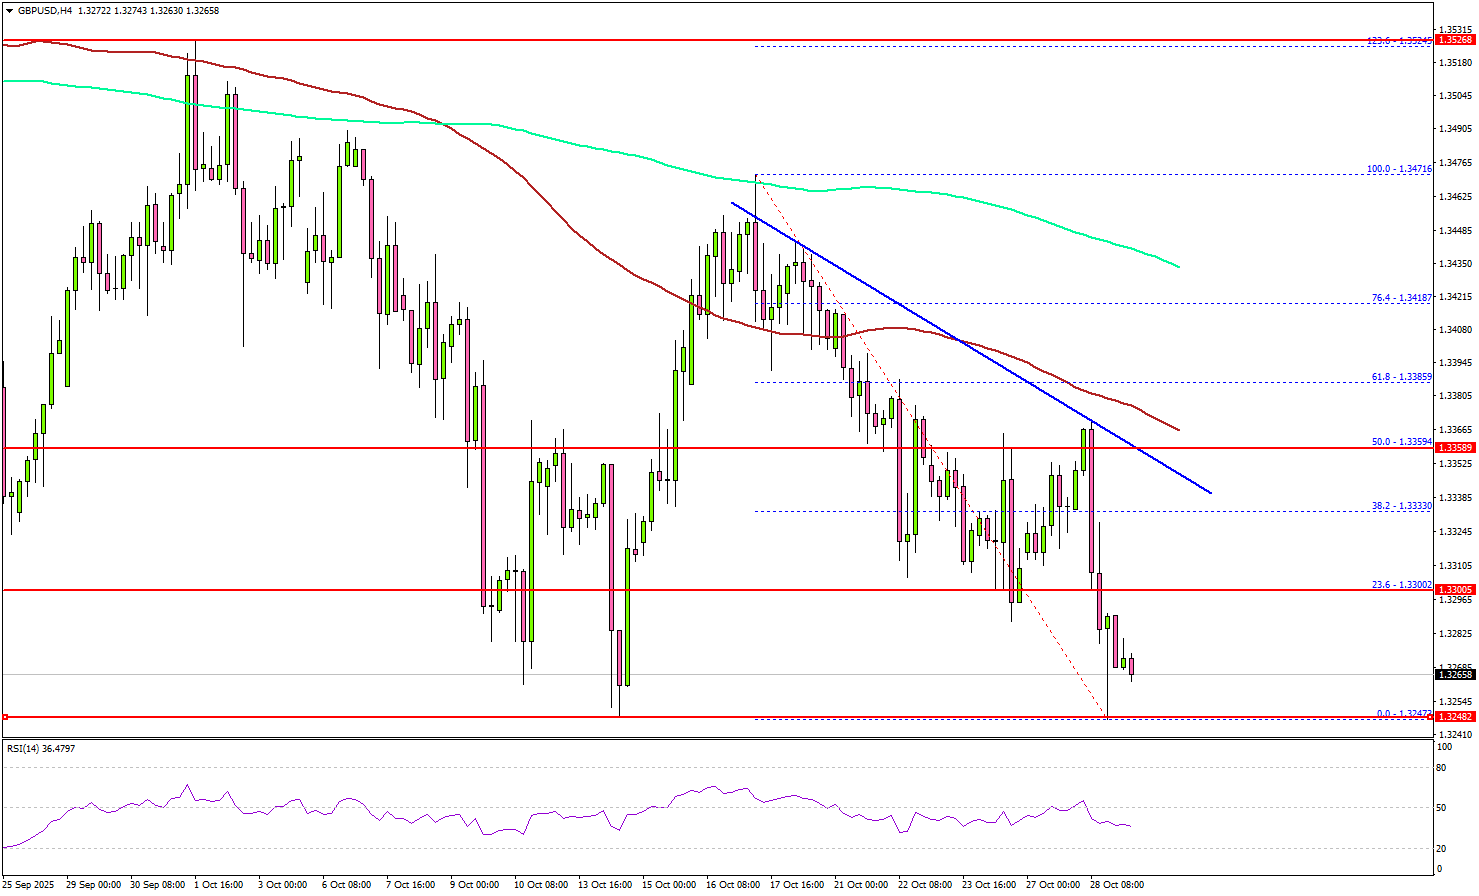
On the downside, the pair might find support at 1.3240. The main support might be 1.3200. A close below the 1.3200 zone could start a major pullback toward 1.3050. Any more losses might open the doors for a test of 1.3000.
On the upside, the pair faces resistance near the 1.3300 level. The next hurdle could be near 1.3330. There is also a major bearish trend line forming with resistance at 1.3355 on the same chart.
A close above 1.3355 resistance might push the pair to 1.3400. Any more gains could set the pace for a steady increase toward 1.3450 and 1.3465.
Looking at EUR/USD, the pair is consolidating, but the bulls need to push the pair above 1.1700 to start a steady increase.
Upcoming Key Economic Events:
- Fed Interest Rate Decision - Forecast 4%, versus 4.25% previous.
- BoC Interest Rate Decision - Forecast 2.25%, versus 2.5% previous.
RBA to Hold in November, Inflation Too Hot to Handle
September quarter inflation materially above RBA’s August forecast drives a hold decision at November meeting. But delay now adds to the chances of more cuts next year.
- Inflation data implies a “material miss” to the upside on inflation. RBA Monetary Policy Board will therefore keep the cash rate on hold at its November meeting. The upside surprise and emerging consumer recovery also count against a December move.
- Even a February cut is far from certain now, given the size of the upside surprise this quarter. We are conducting a full reassessment for the cash rate outlook in light of both the inflation outcome and the evolving picture on domestic demand.
- However, with the starting point for the unemployment rate now also higher, and a higher assumed track for the cash rate in the forecasts, there are downward pressures on inflation further out. The RBA is focussed on inflation risks now, but could be surprised in 2026 by the gradual labour market softening.
Again it comes down to the CPI data. A trimmed mean reading of 1.0%qtr, 3.0%yr is too high for the RBA’s comfort. Indeed, earlier this week the RBA governor characterised an outcome of 0.9% on the quarter as “a material miss”. The Monetary Policy Board (MPB) will therefore opt to be cautious and wait and see inflation approach closer to the midpoint of the target range before considering further cuts. The RBA will instead keep the cash rate on hold at its November meeting next week. There were possible outcomes today that would have pointed to a different decision, but not this one.
The earliest the MPB will be in a position to get more comfort on inflation is with the next quarterly print ahead of the February 2026 meeting. It will only have one read of the new full monthly CPI ahead of the December meeting and will be reluctant to take too much signal from this new measure. Even a February cut is far from certain now, given the size of the upside surprise this quarter. We are conducting a full reassessment for the cash rate outlook in light of both the inflation outcome and the evolving picture on domestic demand.
Another factor counting against a December rate cut is that the consumption outlook has brightened. Our own internal data had previously (and correctly) been showing that the recovery in household spending was slow to come through. However, these data now suggest solid gains in Q3 and into Q4. We therefore upgraded our forecast for Q3 consumption growth in our October Market Outlook. We now think it is likely that the national accounts will report stronger consumption growth than the RBA’s August forecasts, and this will factor into the RBA’s decisions in December – and, quite possibly, early 2026 as well.
Some caution on a strongly hawkish interpretation of these data is warranted, though. There is recent past experience of a September quarter CPI surprising on the upside, only for the December quarter result to reverse much of the surprise. Recall that even with our own nowcast for September quarter trimmed mean inflation (a “big” 0.8%qtr with upside risk), the year-ended figure still stood at 2.6%yr for calendar 2025 because December quarter was seen as likely to print at 0.5%qtr. The near-term does look higher now, even with some payback, but it would be an over-interpretation of the data to carry the September quarterly outcomes forward as a new trend.
There is also the difficulty of how this plays out in the RBA’s forecasts, which will be updated next week alongside the policy announcement. The starting point for the labour market is weaker and the implied trough for the cash rate was 3.2% as of this morning, rather than the 2.9% that was priced in at the time of the August SMP. Both factors should weigh on the RBA’s inflation forecast relative to August, at least beyond the next couple of quarters.
While the starting point for inflation is also materially higher, and the near-term consumption outlook also strong, the forecasts would need to take a lot of signal from this to completely offset the downward pressure further out from these other sources. At her speech earlier this week, the Governor pointed to “stickiness” in services inflation in selected other countries. The data in Australia a bit more mixed, with some components of personal and financial services inflation still slowing. But given where the RBA’s attention is directed, we think it will keep rates on hold until it is satisfied that inflation from this quarter is contained.
Granted, there is month-to-month noise in the labour market data and, like the RBA, we expect a partial reversal of September’s kick up in the unemployment rate over the next month or two. Even at 4.4%, though, the unemployment rate would be starting the forecast period above the rate that the RBA forecast for the entire period back in August. We think it is significant that the RBA chose to be so dismissive of the monthly labour data despite a gradual easing also being evident in job vacancies and other measures, while apparently taking so much signal from higher inflation prints.
Over 2026, though, we expect the RBA to be surprised by the gradual softening in the labour market, and the resulting benign wages growth. Recall that the RBA has been working on the assumption that a flat trend in forecast participation rates is consistent with a balanced labour market. By contrast, we would view such an outcome as implying latent labour market slack as the upward trend in participation rates for female and older workers continues. That easing in conditions should fade in 2027 assuming private sector demand growth does pick up as we are currently forecasting. By that point, though, inflation could be below the target midpoint, which would point to scope for less restrictive monetary policy.
Aussie soars, Sterling slumps, GBP/AUD confirms medium term bearish turn
Aussie surged sharply on after the hotter-than-expected inflation print shattered hopes for a RBA rate cut next week. Crucially, the upside surprise wasn’t confined to energy-driven headline gains. The broad-based acceleration in core inflation confirmed that price pressures have become more entrenched.
RBA Governor Michele Bullock had warned earlier this week that any 0.9% or higher quarterly increase in the trimmed mean would constitute a “material miss.” The 1.0% outcome squarely fits that definition, virtually guaranteeing the central bank will keep rates unchanged at next week’s policy meeting. With economic activity showing tentative signs of recovery, the balance of risks has shifted decisively toward fewer rate cuts over the next year.
In the currency markets, Aussie’s rally coincided with broad-based weakness in the British pound, which remains weighed down by fiscal concerns following reports of a worsening UK budget shortfall. As a result, GBP/AUD has become the week’s standout mover for now, falling more than 1.5% to its lowest levels in months.
Technically, GBP/AUD's break of 2.0240 support confirms resumption of the decline from 2.1643. More importantly, the decisive break below the 55 W EMA (now at 2.0309) reinforces a bearish bias, confirming a medium-term top at 2.1643 under bearish MACD divergence conditions.
The fall from 2.1643 high is viewed as at least correcting the entire rise from 1.5925 (2022 low), with scope to even reversing the whole move.
In either case, as long as 2.0858 resistance holds, the outlook remains bearish with the next target at 38.2% retracement of 1.5925 to 2.1643 at 1.9459.
Australia inflation shock: CPI surges to 3.2%, core re-accelerates
Australia’s inflation surprised sharply to the upside in Q3, reigniting concerns that price pressures are proving stickier than expected. Headline CPI jumped 1.3% qoq, accelerating from 0.7% in Q2 and beating expectations of 1.1% — marking the strongest quarterly increase since Q1 2023. The Australian Bureau of Statistics said the largest contributor was a 9.0% rise in electricity costs, which alone drove much of the headline surge.
On an annual basis, CPI rose to 3.2% yoy, sharply higher than the previous 2.1% yoy and above forecasts of 3.0%. That marks the fastest pace of annual inflation since Q2 2024. Electricity costs were again the main driver, soaring 23.6% from a year earlier despite targeted government relief measures.
Core inflation was equally strong. Trimmed mean CPI — the RBA’s preferred measure — rose 1.0% qoq, up from 0.7% and above expectations of 0.8%. Annually, core inflation accelerated to 3.0% yoy from 2.7%, underlining persistent price pressures across utilities and essential services, exceeding the RBA’s 2–3% target range again. This marks the first uptick in the trimmed mean since Q4 2022, confirming that underlying price momentum remains firm.
The data strengthen the case for the RBA to delay or even reconsider rate-cut expectations for the near term.
Bank of Canada Preview: Rate Cut Expected
Summary
As we highlighted in our October International Economic Outlook, our views on the Bank of Canada (BoC) have changed. We now expect the BoC to cut its policy rate by 25 bps to 2.25% at October's meeting, marking a shift from our prior forecast of a hold through December and through all of 2026. While we view tomorrow's action to ease as the final cut in the BoC's easing cycle, we believe the balance of risk is tilted toward more easing as uncertainty is elevated and growth prospects are subdued.
Bank of Canada Preview
In our October International Economic Outlook, we made an explicit adjustment to our Bank of Canada (BoC) forecast profile. To that point, we adjusted our view on the BoC's October monetary policy decision, and we now expect BoC policymakers to deliver a 25 bps rate cut at this month's meeting. Our revised view stems from our assessment of overall BoC monetary policy space, but also, in our view, policymakers' seemingly stronger preference to support economic activity rather than control inflation.
As far as monetary policy space, our forward-looking framework—which aggregates indicators including real interest rates, inflation trajectory, economic growth momentum and output gap—suggests that the Bank of Canada has room for additional interest rate cuts. In fairness, our framework says cutting rates is a close call as indicators are split. Split in the sense that policy settings and inflation indicators suggest the BoC should keep rates unchanged, but growth-related indicators say monetary policy should continue to be adjusted in a more accommodative direction, at least when all indicators are evenly weighted when assessed. However, as mentioned, we believe policymakers have communicated more of a bias toward supporting growth and are not overly concerned with inflation. Evidence can be found in the BoC's prior official statement where policymakers were rather clear in that inflation risks have settled, but the economic outlook was deteriorating amid elevated uncertainty.
While recent inflation and jobs data surprised to the upside, we have yet to detect a change in sentiment on inflation from policymakers and the unemployment rate remains elevated. At the same time, uncertainty has increased as the Trump administration has signaled an additional 10% tariff will be imposed on Canadian exports to the United States. Reinforcing an elevated degree of uncertainty was a Q3 business outlook survey that painted a pessimistic picture of forward-looking growth prospects. This growth concern is compounded by mixed signals on consumer spending. Retail sales showed positive momentum in August, but Statistics Canada’s advance retail estimate points to a September contraction that will further complicate Q3 consumption and overall growth. Point being, when we adjust our framework to weigh growth momentum and growth prospects more heavily, we believe BoC policymakers have incentive to ease monetary policy in October rather than keep interest rates steady (Figure 1).
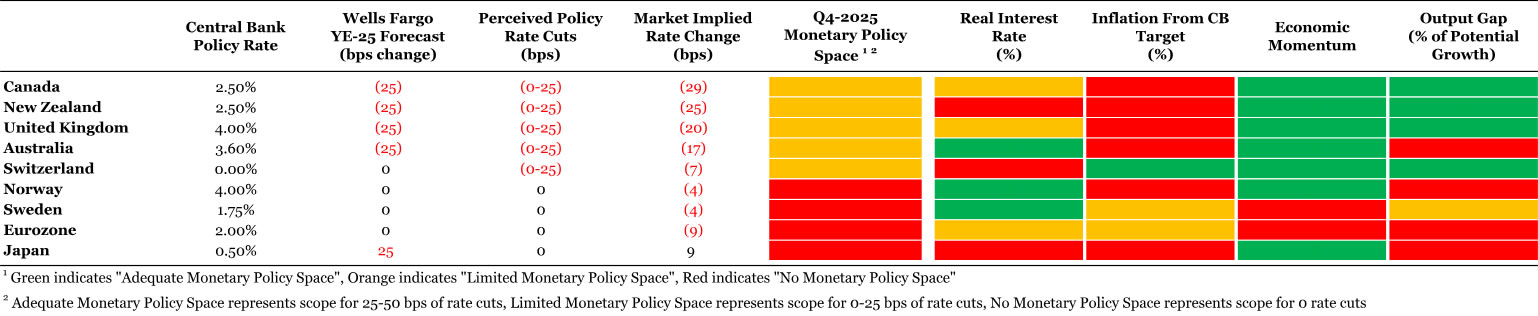
Source: Bloomberg Finance L.P. and Wells Fargo Economics
For now, we believe the October cut will be the final rate reduction in the Bank of Canada's easing cycle. A cut this month would mean a terminal BoC rate of 2.25%; however, we believe the balance of risk is tilted toward more easing, with a terminal rate of 2.00% certainly a possibility. Leading indicators suggest growth is set to be sluggish for at least another quarter and possibly longer should latest tariff threats be imposed and should Canada opt to reinstate retaliatory tariffs amid the latest trade spat. A Federal Reserve that is also likely to be lowering policy rates into 2026 could also generate additional policy space for BoC policymakers to continue easing past October. To emphasize downside risks to our terminal rate forecast, our monetary policy framework, even after accounting for a cut in October, still screens that the BoC can deliver further easing, easing that financial markets are not fully priced for. Our framework also flags the BoC as having the most space of G10 central banks to continue easing past October, although similar to the dynamics around the October rate decision, there is a fine line between opting for more easing and holding rates steady. And finally, in addition to risks being skewed toward further easing beyond October, we do not anticipate Bank of Canada policymakers shifting toward rate hikes any time over our forecast horizon. Perhaps this longer-term BoC outlook can change over time, but for now, we do not see the evolution of Canada's economy as consistent with tighter monetary policy through Q1-2027.