Sample Category Title
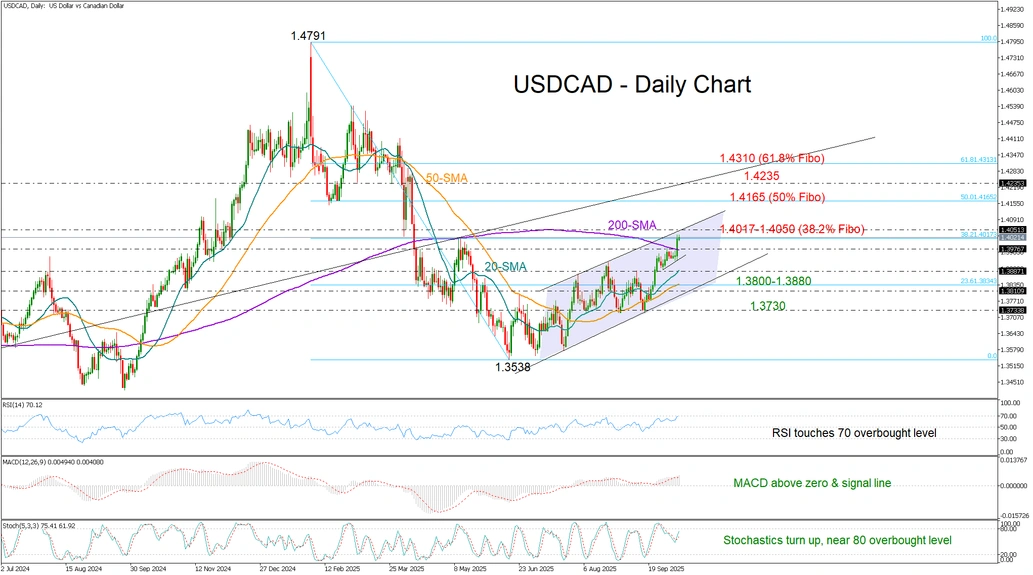
USD/CAD Closes Above 1.400 After Six Months
- USD/CAD bulls win battle with 200-SMA, mark six-month high.
- Technical risk bias remains bullish, though caution is warranted below 1.4050.
USD/CAD returned to its bullish path on Thursday after an almost two-week period of consolidation around the 1.3900 area, as rising political uncertainty outside the U.S. fueled safe-haven demand for the greenback.
The price broke above its 200-day simple moving average (SMA) and extended the uptrend that began from June’s low of 1.3538 to a six-month high of 1.4032. Notably, the pair appears to have exited a symmetrical triangle to the upside on the four-hour chart, signaling potential for further gains as the simple moving averages (SMAs) remain positively aligned.
Still, some caution is warranted given the congestion around the 38.2% Fibonacci retracement level of the January–June downleg, which previously capped upside pressures in May near 1.4017. The upper boundary of the upward-sloping channel is also within close range, raising the risk of a pullback as the RSI on the daily chart is hanging near its 70 overbought level.
Hence, a decisive close above 1.4050 could be key to extending the advance towards the 50% Fibonacci retracement at 1.4165. Beyond that, the pair could challenge the long-term ascending line drawn from the pandemic lows around 1.4230 before testing the 61.8% Fibonacci level at 1.4313.
In the bearish scenario, if the pair falls back below the 200-day SMA at 1.3976, attention will shift to the 20- and 50-day SMAs at 1.3887 and 1.3830, respectively. Should selling pressures intensify there, pushing the price below the channel at 1.3800, support could emerge around the double-bottom area near 1.3730.
Overall, the latest spike in USD/CAD has improved its bullish potential, though the pair may remain vulnerable unless it decisively breaks above the 1.4050 barrier. Canadian employment figures could trigger the next round of volatility at 12:30 GMT in the absence of key U.S. data releases.
EUR/USD Plummets as Investors Shun Risk
The EUR/USD pair tumbled to 1.1569 on Friday, propelling the US dollar to a two-month high. The rally comes as investors retreat from both the euro and the yen, which have lost their appeal.
The yen has depreciated roughly 4.0% against the dollar since Sanae Takaichi won the race to become Japan's next prime minister. Markets are anticipating an expansion of fiscal stimulus and a continuation of accommodative monetary policy under the new leadership.
Meanwhile, the euro has weakened by approximately 1.5%, pressured by political instability in France. President Emmanuel Macron is now seeking his sixth prime minister in just two years, creating significant uncertainty.
In the United States, the government shutdown has entered its ninth day. This has delayed the release of key macroeconomic data, leaving markets without crucial information to assess the Federal Reserve's policy outlook.
Market pricing currently indicates a 95% probability of a 0.25 percentage point interest rate cut in October. However, the likelihood of a subsequent easing in December has fallen to 80%, down from 90% a week ago.
Technical Analysis: EUR/USD
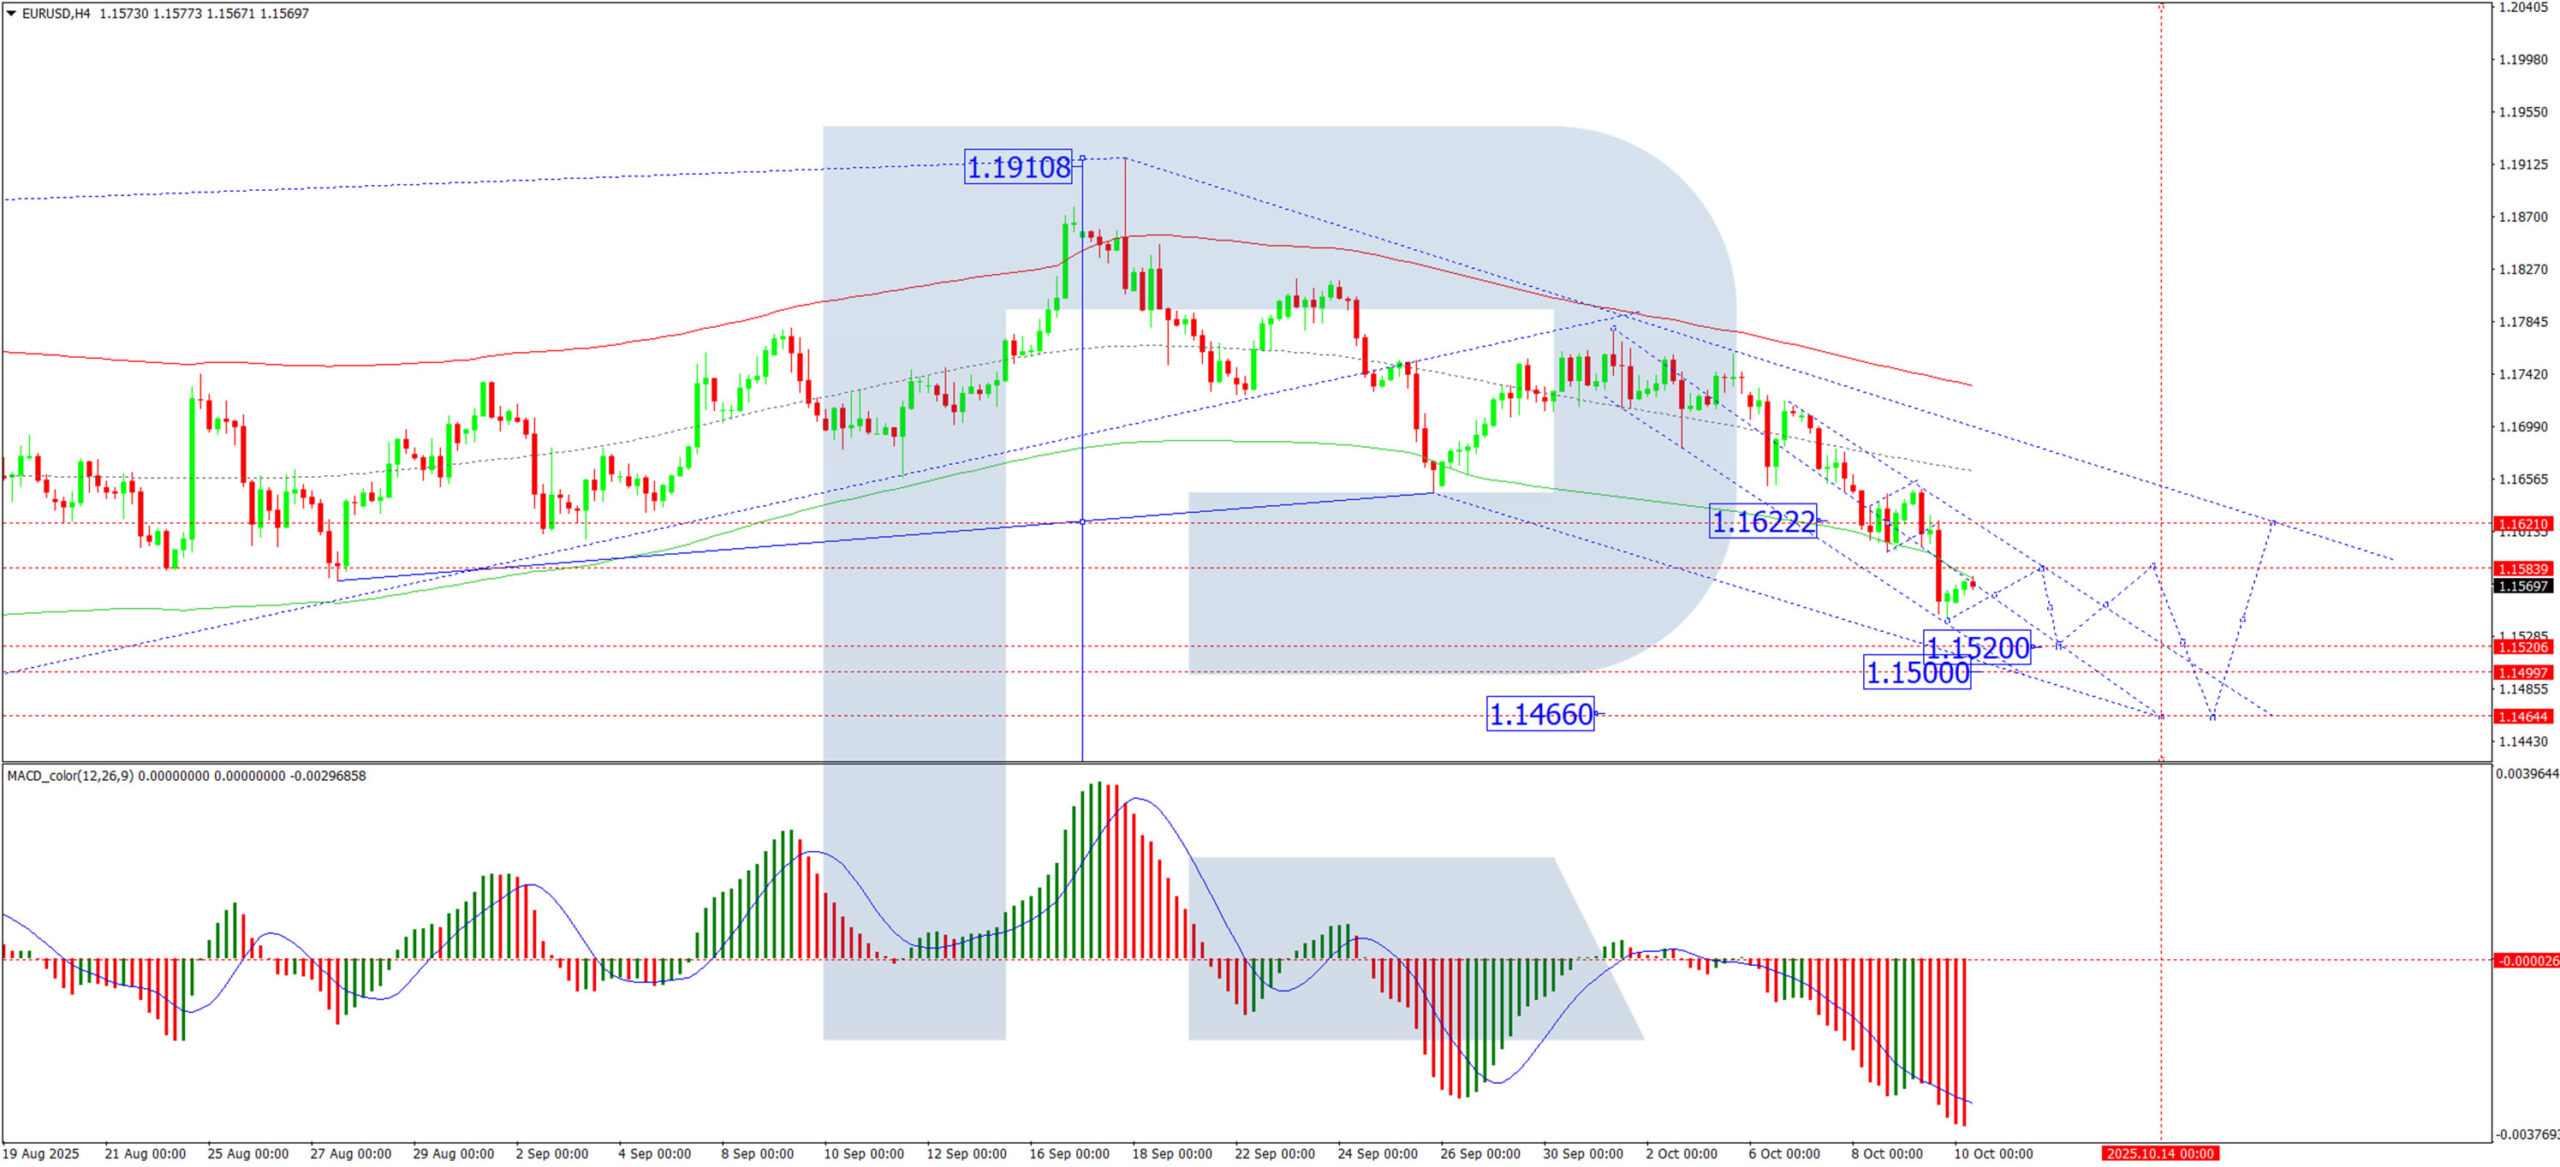
H4 Chart:
The pair completed a downward wave to 1.1622 and subsequently formed a consolidation range around this level. Today's downward breakout from this range has completed a further decline to 1.1542. A corrective pullback to 1.1584 is now possible. Following this, a decline towards 1.1520 is expected, with the potential to extend the downtrend to 1.1500. This bearish scenario is technically confirmed by the MACD indicator, whose signal line is below zero and pointing firmly downward.
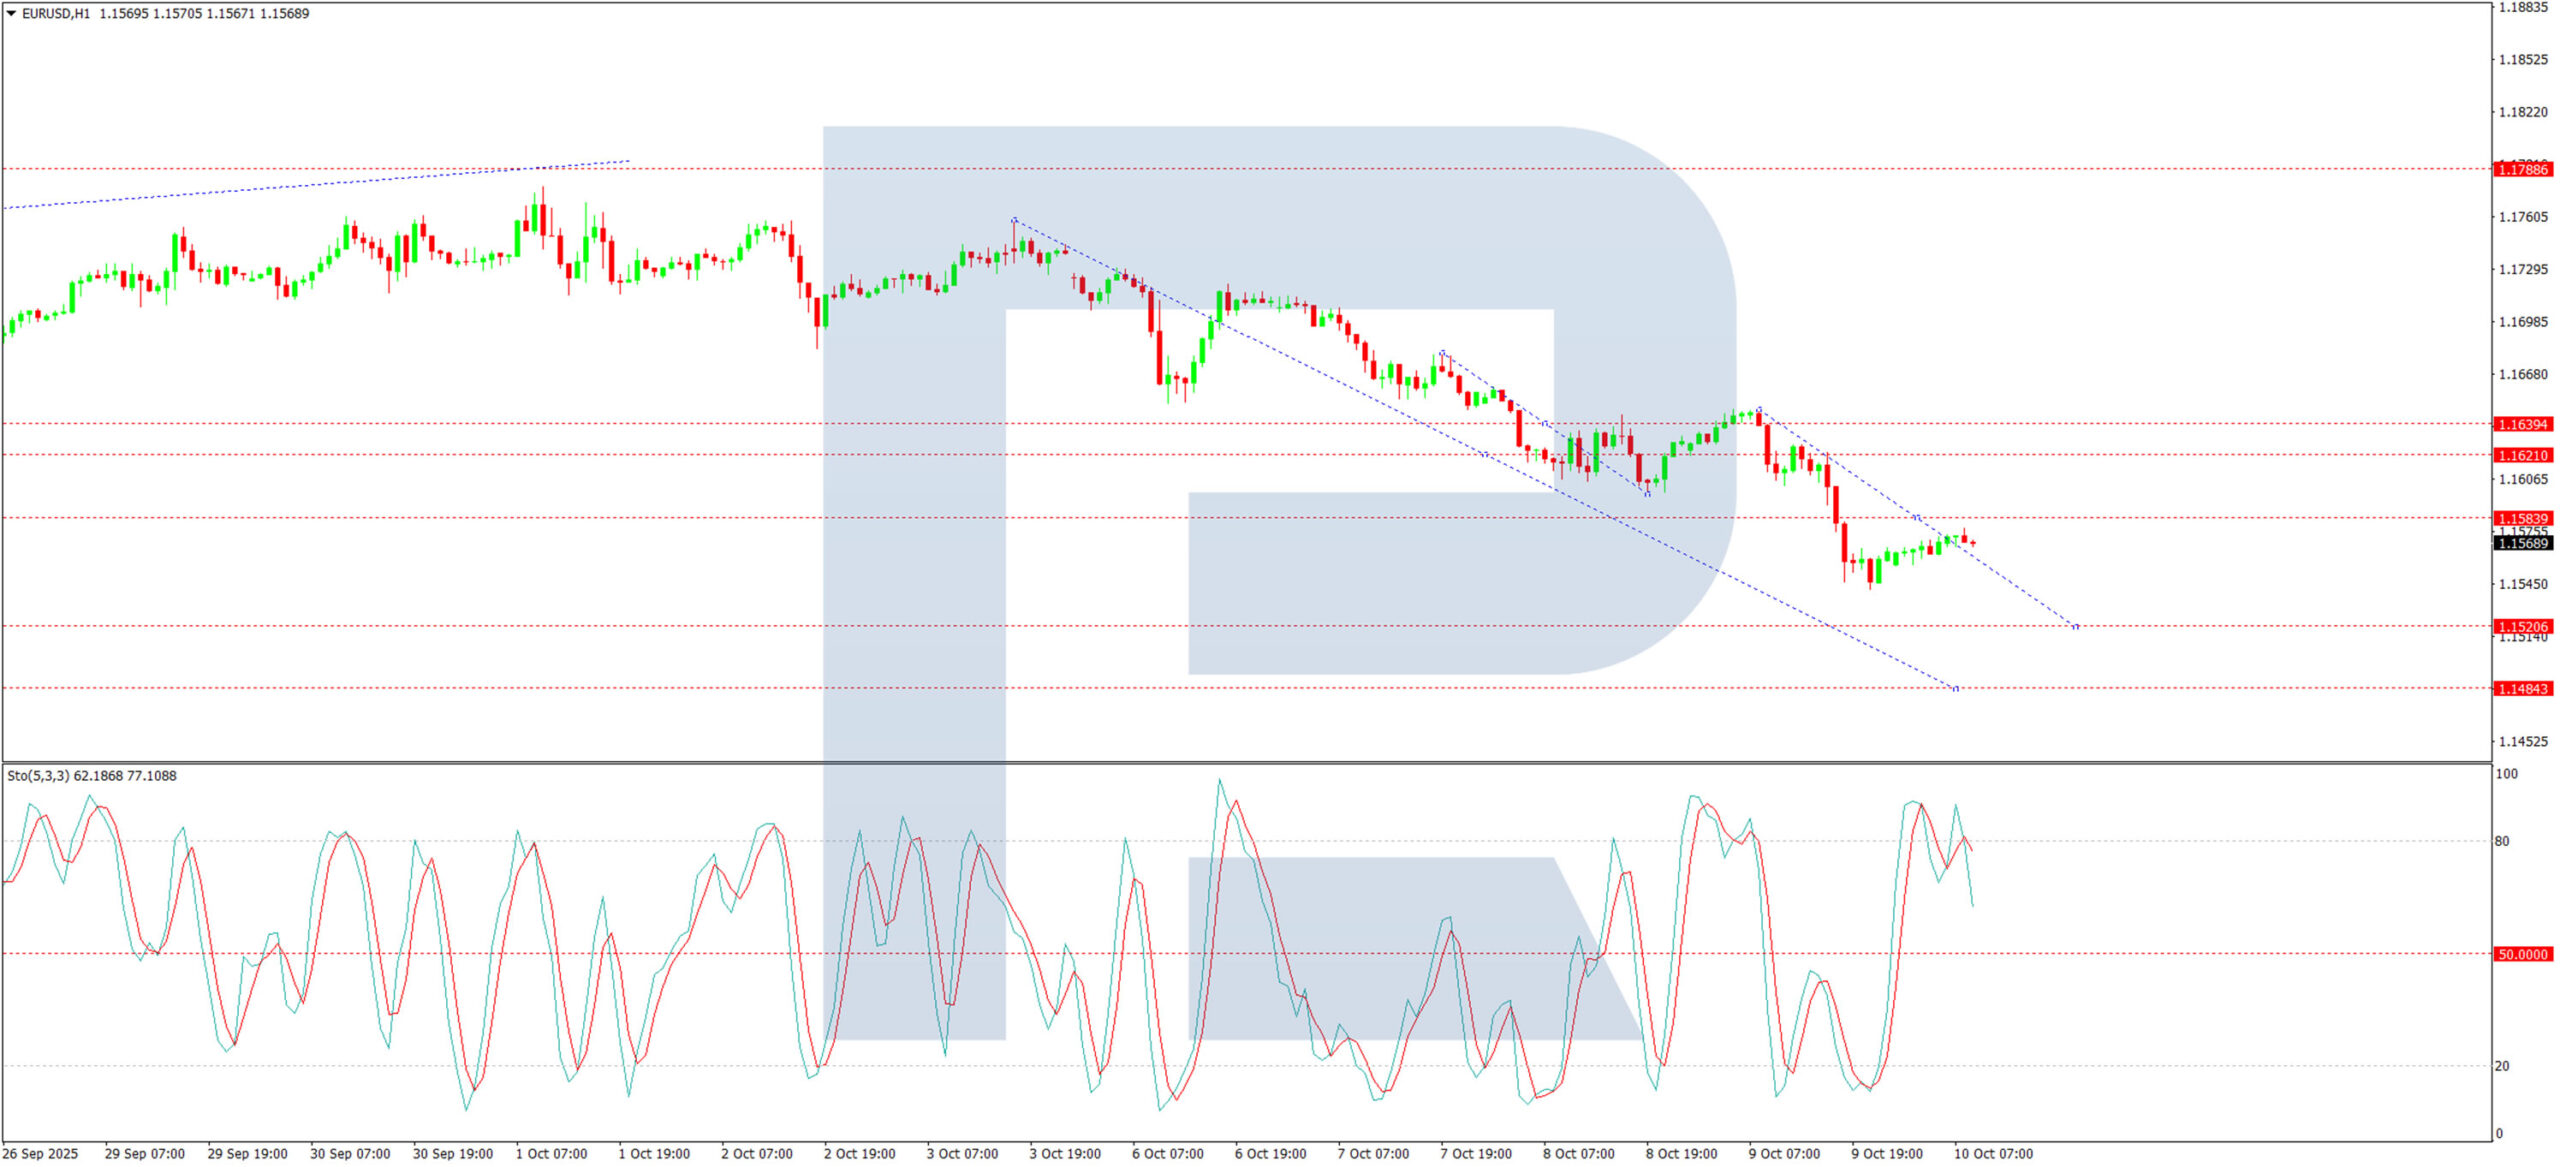
H1 Chart:
A decline to 1.1640 was followed by the formation of a consolidation range below this level. The subsequent downward movement culminated in a wave reaching 1.1542. A short-term correction to 1.1580 is possible today. Upon its completion, a further decline to 1.1520 is anticipated, with the local target for the downward wave structure seen at 1.1500. Technically, this outlook is supported by the Stochastic oscillator, with its signal line below 80 and pointing sharply downward towards 20.
Conclusion
The EUR/USD is firmly on the back foot, driven by a stronger US dollar and distinct weaknesses in both the euro and yen. The technical structure is overwhelmingly bearish, pointing towards a continued decline with key targets at 1.1520 and 1.1500.
EUR/USD Falls to Two-Month Low
As shown on the EUR/USD chart today, the euro has dropped below 1.1550 against the US dollar — its lowest level since early August. The main driver of pressure on the single currency remains the political crisis in France:
President Emmanuel Macron is currently seeking a candidate for the position of prime minister. The situation is complicated by the fact that:
→ the government needs to quickly approve a rather tight budget reflecting the country’s significant deficit;
→ media reports highlight unrest in the streets;
→ financial market turbulence is intensifying amid uncertainty surrounding the ongoing US government shutdown.
Technical Analysis of the EUR/USD Chart
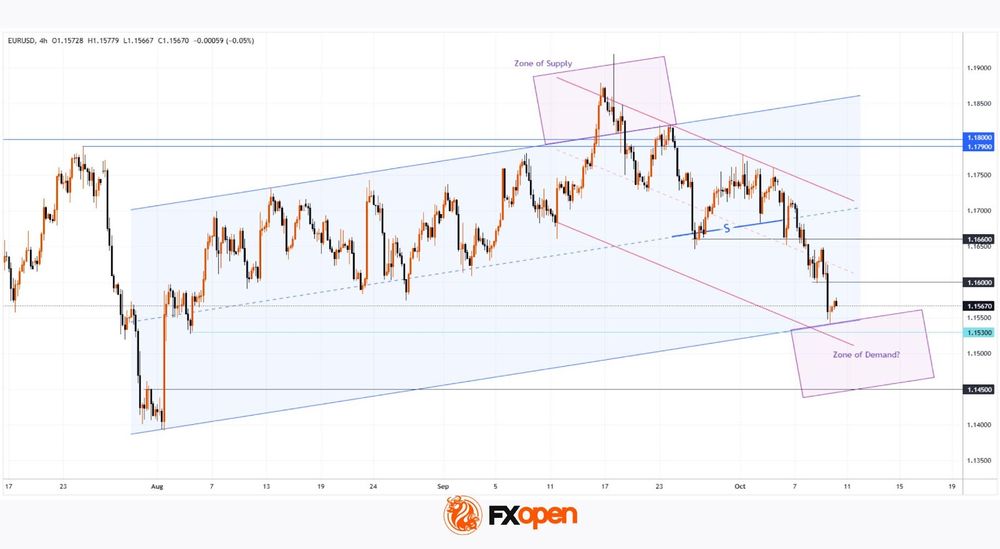
On 6 October, we noted that:
→ fluctuations in EUR/USD over recent months had formed an upward channel (shown in blue);
→ we highlighted a break below line S;
→ and suggested that a bearish break below 1.16600 would pave the way for a decline towards key support at 1.14500.
Indeed, following the break of 1.16600, the downtrend continued. How might the situation develop from here? To explore this, we extended the ascending channel and proposed a hypothesis that in mid-September, the price entered a supply zone (marked in purple) above the previous peak near 1.1790 and the psychological level of 1.1800. In other words, smart money appeared to be forming short positions, as described by the Liquidity Sweep pattern.
Since then, the market has been moving in search of liquidity on the opposite side. On the EUR/USD chart, we have identified a potential demand zone around key levels:
→ the lower boundary of the blue channel;
→ the 1.1530 level, where buyers’ stop-losses may be located;
→ and the mentioned support at 1.14500.
From a bearish perspective:
→ the market is moving within a descending channel (shown in red);
→ resistance may be provided by both its median line and the former local support at 1.1600.
In light of the above:
→ in the short term, the market remains bearish;
→ in the medium term, bearish pressure may ease, and EUR/USD could begin to consolidate.
Whether this scenario unfolds — and in what configuration — will largely depend on the news flow and political developments in both the US and France.
Trade over 50 forex markets 24 hours a day with FXOpen. Take advantage of low commissions, deep liquidity, and spreads from 0.0 pips. Open your FXOpen account now or learn more about trading forex with FXOpen.
This article represents the opinion of the Companies operating under the FXOpen brand only. It is not to be construed as an offer, solicitation, or recommendation with respect to products and services provided by the Companies operating under the FXOpen brand, nor is it to be considered financial advice.
Gold (XAU/USD): Overstretched Uptrend, Risk of Minor Pull-back Below $4,012
Key takeaways
- Gold (XAU/USD) surged 8.5% since late September, breaking above US$4,000 to hit a new all-time high of US$4,059.
- The rally is driven by demand for inflation hedges and fears of fiat currency debasement amid fiscal concerns.
- Technical indicators show an overstretched uptrend, raising the risk of a short-term pullback below US$4,012.
- The medium-term uptrend remains intact, as Gold stays above its key 20-day and 50-day moving averages.
The price actions of Gold (XAU/USD) have indeed shaped the expected bullish impulsive up move sequence and rallied by 8.5% since 26 September 2025, broke above the US$3,865 resistance highlighted in our previous analysis, and hit a fresh all-time intraday high of US$4,059 on Wednesday, 8 October 2025.
Interestingly, the US dollar also rebounded over the same period, where the US Dollar Index rose by 1.4% to hit a two-month high.
Inflation hedge and debasement trade are supporting the major uptrend in Gold
The macro narrative that is supporting the ongoing major bullish trend in the previous yellow metal that surpassed the key US$4,000 psychological level has been a sticky inflation trend in the US (as an inflationary hedge), and “debasement trade” where growing fiscal concerns in the world’s biggest economies, such as the US, led to a bet against (distrust) fiat currencies.
Macro factors drive the medium-term and longer-term trends, but within such trends, there will be mean-reversion price action behaviours that can last for multiple days as leveraged speculators adjust their positions.
At this juncture, the current seven-week of bullish acceleration in Gold (XAU/USD) has reached a potential tipping point for a multi-day mean reversion decline within its medium-term uptrend phase.
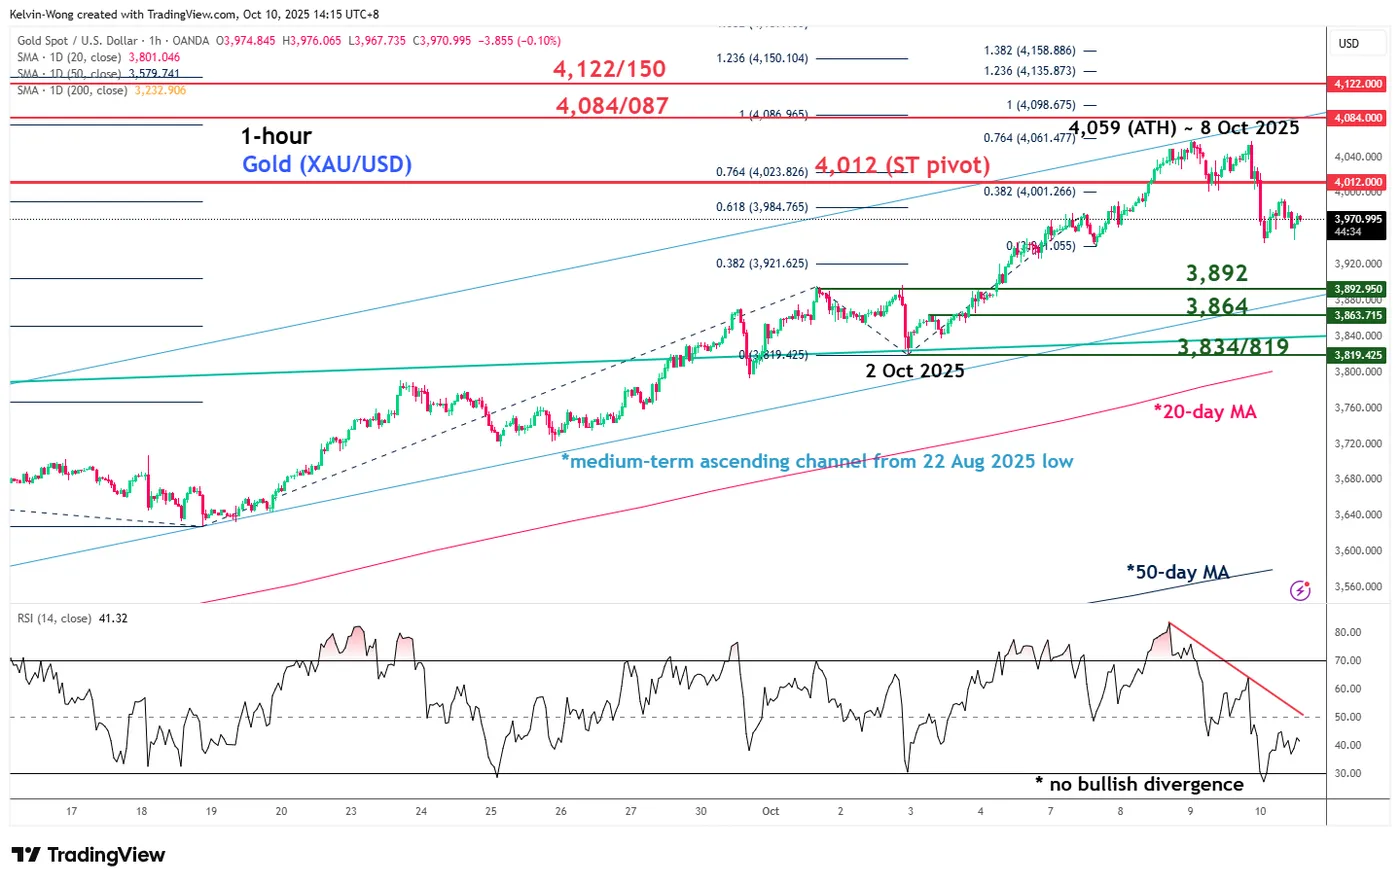
Fig. 1: Gold (XAU/USD) minor trend as of 10 Oct 2025 (Source: TradingView)
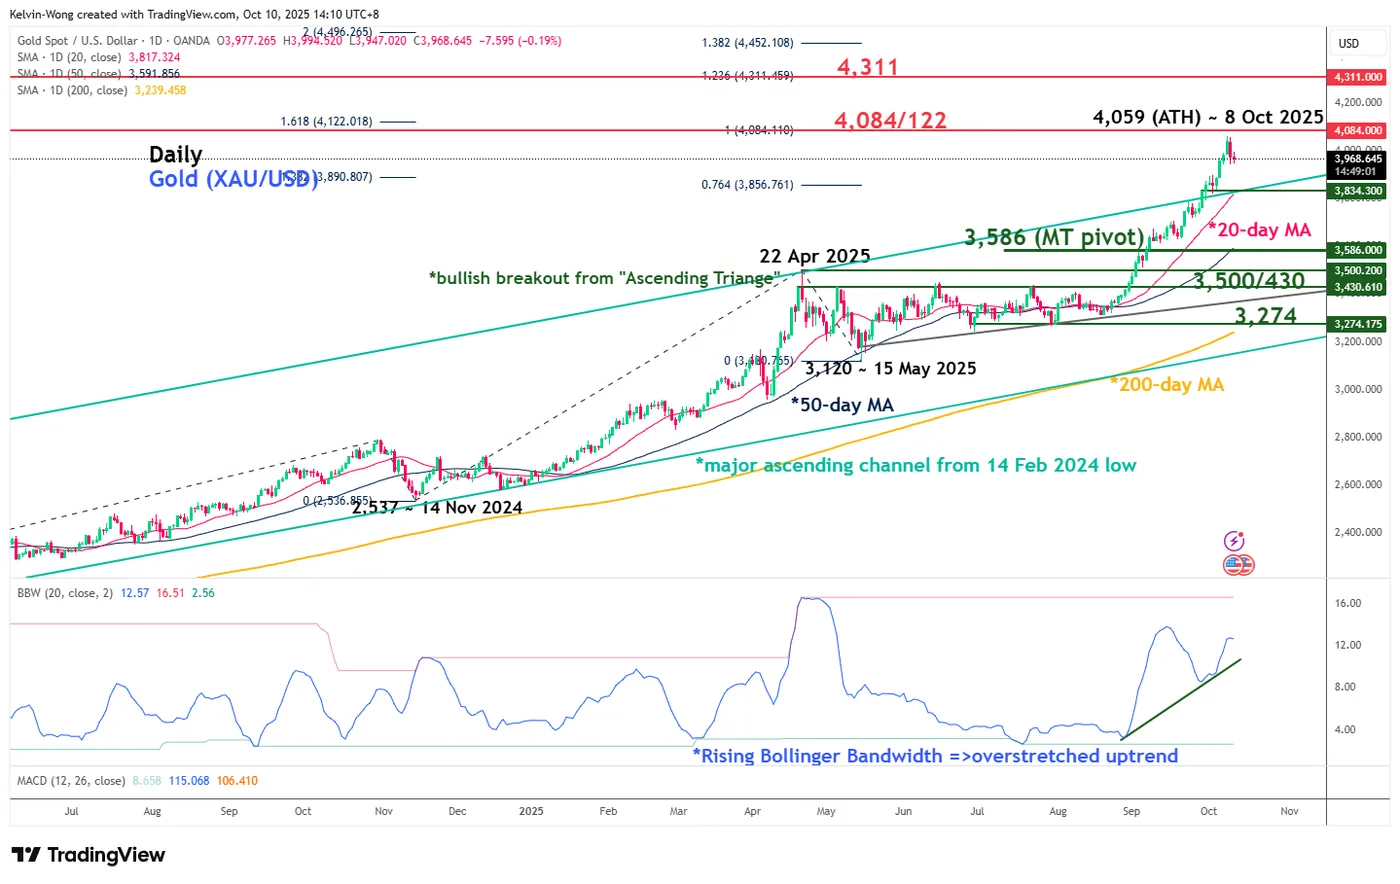
Fig. 2: Gold (XAU/USD) medium-term & major trends as of 10 Oct 2025 (Source: TradingView)
Preferred trend bias (1-3 days)
Bearish bias below US$4,012 for a potential mean reversion decline scenario to unfold for Gold (XAU/USD) within its medium-term uptrend to expose the intermediate supports at US$3,892, US$3,864, and US$3,834/3,819 (also the rising 20-day moving average) (see Fig. 1)
Key elements
- The medium-term uptrend phase for Gold (XAU/USD) since the bullish breakout of its “Ascending Triangle” range resistance on 29 August 2025 remains intact as price actions remain above its 20-day and 50-day moving averages (see Fig. 2)
- The daily Bollinger Bandwidth of Gold (XAU/USD), a measurement of the volatility of its trend, has jumped significantly from 26 September 2025’s value of 8.6 to 9 October 2025’s value of 12.7 (see Fig. 2).
- This observation, seen in the Bollinger Bandwidth, suggests the current medium-term uptrend phase has reached an overstretched condition that increases the risk of a mean reversion decline scenario for Gold (XAU/USD) (see Fig. 2).
- The hourly RSI momentum indicator of Gold (XAU/USD) has continued to flash out a short-term bearish momentum condition as it remained capped below a descending resistance at the 50 level, in turn supporting a mean reversion decline scenario (see Fig. 1).
Alternative trend bias (1 to 3 days)
A clearance above the US$4,012 key short-term resistance on Gold (XAU/USD) invalidates the mean reversion decline scenario to kickstart a new bullish impulsive up move sequence for the next intermediate resistances to come in at US$4,084/4,087 and US$4,122/4,150.
USDJPY’s Impulsive Bullish Pattern Points to Continued Upside
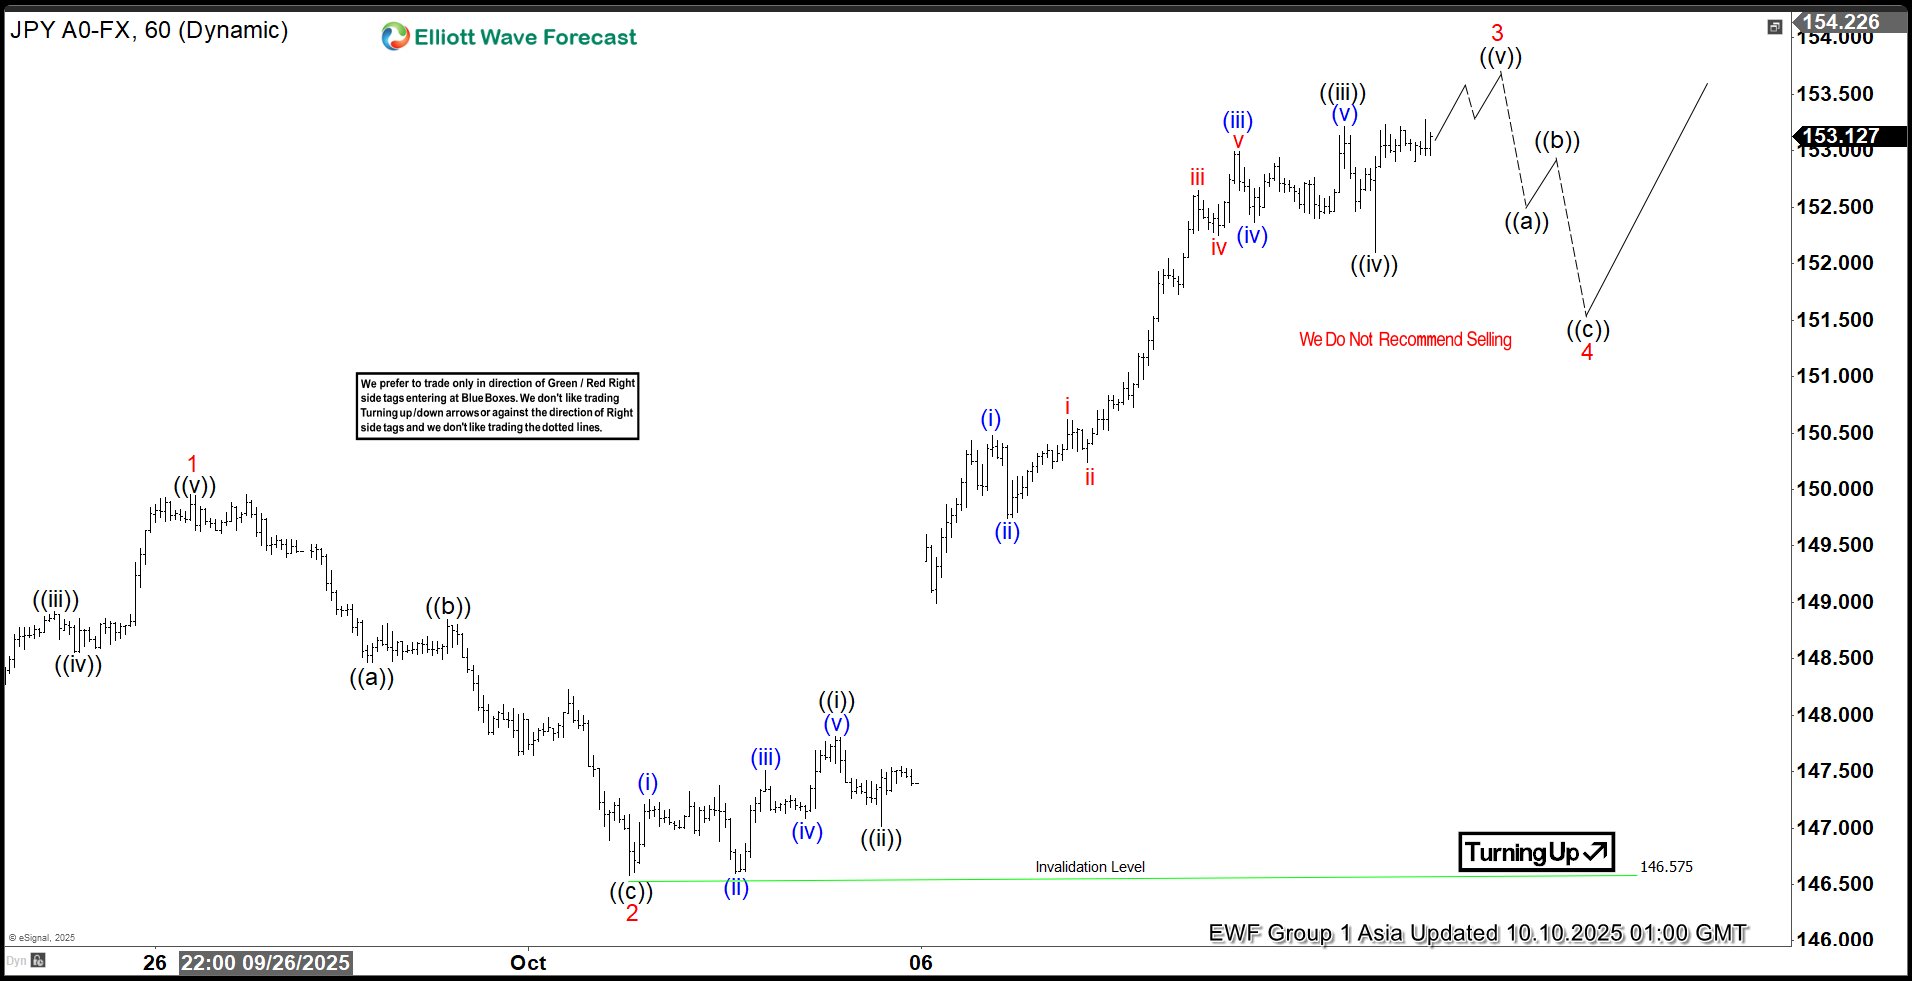
The short-term Elliott Wave analysis for USDJPY indicates that the cycle starting from the September 18, 2025 low is unfolding as a five-wave impulse. From that low, wave 1 peaked at 149.956, followed by a wave 2 pullback structured as a zigzag. In this correction, wave ((a)) declined to 148.467, wave ((b)) rallied to 148.85, and wave ((c)) concluded at 146.57, finalizing wave 2 at a higher degree.
The pair has since resumed its upward trajectory in wave 3. From the wave 2 low, wave ((i)) reached 147.81, followed by a brief pullback in wave ((ii)) to 147.01. The pair then advanced in wave ((iii)) to 153.21, with a minor dip in wave ((iv)) concluding at 152.09. Analysts anticipate the pair will extend higher in wave ((v)) to complete wave 3. Following this, a wave 4 pullback is expected to correct the cycle from the October 1, 2025 low before the pair resumes its upward movement. In the near term, as long as the pivot low at 146.57 holds, any wave 4 pullback should attract buyers in a 3, 7, or 11 swing pattern, supporting further upside. This analysis suggests a bullish outlook with key support levels intact.
USDJPY – 60 Minute Elliott Wave Technical Chart:
USDJPY – Elliott Wave Technical Video:
https://www.youtube.com/watch?v=9qCGoeZzI1s
Greenback Enjoys Life Without Eco Releases
Markets
EUR/USD’s technical break outside the upward sloping trend channel since US Liberation day met with follow-up action yesterday. News that French President Macron will name a new PM tonight didn’t stop the pair from sliding from a start at 1.1629 to a close at 1.1564. Markets have little confidence that the next, technocrat, PM will be able to steer next year’s budget through parliament without having to face motions of no confidence which whatever the government looks like, it is likely to lose. A modest risk correction (up to 0.5% for key European and US benchmark indices), simultaneously played in the advantage of the dollar. We eye a further decline, in first instance to 1.1392 support. The trade-weighted greenback accelerated his ascent since the start of the month, with the best close (99.56) since the end of July. First support (upper bound sideways trading channel) is coming close at DXY 100.26. The greenback enjoys life without eco releases, though the BLS yesterday announced that it would recall some furloughed workers in order to get the September CPI report ready by the end of the month. Apart from that, there’s still little rush in US Congress to end the government shutdown which started early this month. The US Treasury concluded its mid-month refinancing operation with a solid $22bn 30-yr Bond auction which didn’t leave trace on markets. USD/JPY closed (153.07) at the highest level since mid-February with JPY still feeling some pain from the outcome of LDP-leadership elections. Newly-elected leader Takaichi yesterday tried to stem worries about Abenomics 2.0 by saying that shed doesn’t intent to trigger excessive JPY-weakness and that there’s no immediate need to revise the BoJ-government accord. We stick with our call that Japanese money markets went too far in pricing out a rate hike (0.50% to 0.75%) at the end of October BoJ policy meeting.
Asian stock markets remain in correction mode this morning. Apart from the French PM nomination, we keep a close eye on Moody’s rating review of Belgium’s Aa3 credit rating (negative outlook). Recall that Fitch cut the Belgian rating in June from AA- to A+, a first ever drop into single A category, as budgets concerns linger. In light with the French political/budgetary crisis and given limit progress in sustainable tackling outsized budget deficits, there’s a risk of another rating downgrade. University of Michigan consumer confidence (October) is one of the sole US data points we get these week.
News & Views
In his press conference commenting on the National Bank of Poland’s policy decision (NBP), governor Glapinski kept the door open for further easing. The NBP on Wednesday cut the policy rate by 25 bps to 4.5%, a move that was only expected by part of the market/analysts. The governor said that “there is not a lot of room, but there is some” for further erasing. Glapinski indicated that the central bank favours to the cut the policy rate by steps of 25 bps and that it isn’t targeting any specific terminal rate for the cycle. Even so, he suggested that the policy rate can be lowered to 4% if inflation remains at current levels. The NBP sees inflation holding near 3% in Q4, a level the governor indicates as being satisfactory, but core inflation remains sticky above 3%. A slowdown in wage growth supports the case for further easing. On the other hand, the NBP mentions (a too stimulative) fiscal policy as a risk to stability and limiting the scope for policy easing. Even as the tone of the press conference was rather dovish, the zloty again hardly reacted. EUR/PLN is still locked in a tight range near 4.25.
A monthly survey of the UK Recruitment and Employment Confederation (REC) and KPMG showed a further decline of recruitment of permanent staff in the UK at the end of the third quarter, but the pace of the decline slowed. The survey still sees low employer confidence and casts concerns weighing in staff hiring. Vacancies data still highlight a marked drop in demand for staff that was similar to that seen in August. The sustained fall in hiring and reports of redundancies drove a further rapid increase in candidate numbers for both permanent and temporary positions. The shift in demand and supply for workers placed downward pressure on pay, with both permanent salaries and temp pay rates up only marginally.
Tech, Politics and Geopolitics
What a week it has been, right! There was no time to get bored despite the lack of US economic data — the tech sector kept us busy with a string of mega deals. Nvidia and AMD kicked things off with a major AI-related partnership that sent AMD — and other tech names — sharply higher on Monday. Just hours later, Elon Musk’s xAI announced a $20 billion funding round backed by investors including Nvidia. Then came news that SoftBank is buying ABB’s robotics division, sending ABB shares to record highs. The group also confirmed this morning it’s in talks for a $5 billion margin loan backed by Arm to help fund investments in OpenAI. Meanwhile, Dell doubled its sales and profit forecasts, admitting it had got its AI demand projections ‘wrong’ last year — demand is much stronger than expected. Add in renewed appetite from Jamie Dimon for the AI story, and it’s clear the enthusiasm is still building.
The AI bubble debate remains a hot topic: some argue this is the new internet bubble 2.0 waiting to burst, others think it’s a bubble that still has room to inflate, and many point out that as long as earnings growth holds, the market can keep going. The upcoming earnings season will be the real test. Tech firms in the S&P 500 are expected to post around 21 % earnings growth, with Nvidia forecast to generate roughly $54 billion in quarterly revenue — excluding China.
Valuations remain elevated but not extreme: the Bloomberg Magnificent 7 trade at about 39 times earnings, high but not outrageous given the profit momentum. So the ball is in the earnings camp — and early signs are encouraging. Nvidia’s key partners are already showing strength: Hon Hai (Foxconn) reported an 11 % increase in quarterly sales, and TSMC posted a 30 % jump in Q3 revenue.
Speaking of earnings, yesterday’s first batch leaned on the optimistic side: PepsiCo and Delta both beat expectations with solid results and upbeat outlooks, while Levi’s beat on revenue and profit but offered softer full-year guidance. Overall, no red flags yet on the corporate front.
On the economic data side, the US government shutdown means we’re flying half-blind, but the New York Federal Reserve’s (Fed) inflation expectations survey wasn’t exactly soothing for doves: both the one-year and five-year expectations ticked to and above 3%. Earlier this week, the FOMC minutes hinted at more rate cuts ahead, though policymakers are clearly balancing that with ongoing inflation risks. Markets still price in roughly a 95 % chance of another rate cut by the end of this month — good news for risk assets, though the lack of official data means expectations could shift abruptly once the government reopens and fresh figures arrive. That risk should keep the 2-year Treasury yield and the US dollar supported.
Speaking of which, the dollar index climbed to its highest since August, not because of US strength but because of weakness in the euro and yen. France’s political impasse helped drag the EURUSD below 1.16, compounded by a surprise drop in German exports. Meanwhile, the yen weakened again as markets bet that incoming PM Sanae Takaichi will favour looser fiscal and monetary policies — though many (myself included) think that’s far from certain given Japan’s rising inflation and high debt levels, and the Bank of Japan’s (BoJ) ongoing normalization. Still, the USDJPY is testing the 153 handle, with a potential move toward 155–160 not off the table.
As mentioned after the last FOMC meeting, the US dollar faces a hawkish readjustment. The two main risks to that view are the US government shutdown, which clouds visibility, and trade tensions — China reportedly halted soybean purchases from the US and curbed rare-earth exports ahead of the next bilateral trade summit. The latter helped keep VanEck’s Rare Earth & Strategic Metals ETF well bid, with Trilogy Metals surging over 200 % on Tuesday amid political tailwinds for US miners.
On the geopolitical side, a ceasefire in Gaza kept U.S. crude below $62 per barrel, while gold eased back under $4,000 per ounce and silver slipped below $50 after briefly topping $51 yesterday. The dollar rebound and easing Middle East tensions may encourage some near-term profit-taking in gold, but the medium-term outlook remains positive — supported by central-bank buying, lingering inflation concerns and waning faith in traditional currencies.
One last thought before we go: for those worried that the S&P 500 looks expensive, it hasn’t been as impressive in gold terms. The index has lost about 70 % of its value relative to gold since 2000. In fact, buying and holding gold over the past 20 years would have outperformed the S&P 500. That said, gold has also seen deep pullbacks — and another one could be forming. Would that derail enthusiasm? To be seen. Many fund managers still argue that keeping 10–15 % of a portfolio in gold remains a wise hedge.
The Week Wraps Up with US Consumer Sentiment and Inflation Outlook
In focus today
In the US, the University of Michigan's preliminary October consumer sentiment survey is set for release this afternoon, with focus on consumers' inflation expectations. In September, 1-year inflation expectations remained elevated at 4.8%, while 5-year expectations rose to 3.9%, both exceeding the Fed's target. Amid delays in other economic data due to the government shutdown, today's release will provide key insights to markets. If inflation expectations remain elevated, it could support the case for a more cautious and gradual approach to monetary policy adjustments.
In Sweden, key economic indicators will be released today at 8.00am, including flash estimates for GDP, production (PVI), and the consumption indicator for August. Retail sales have improved, suggesting a somewhat positive consumption figure, despite occasional discrepancies between the measures. Monthly GDP is highly volatile, whereas production and consumption data tend to provide a more reliable guide.
In Norway, we get the inflation figures for September where we believe the core inflation (CPI-ATE) was unchanged at 3.1 %, in line with consensus but marginally lower than Norges Bank expected in the September MPR at 3.2 %.
Economic and market news
What happened overnight
In the FX space, the US Treasury has finalised a $20 bn currency swap framework with Argentina and begun purchasing pesos in the open market, fulfilling President Trump's pledge to support the struggling country. Following the breakdown of Bretton Woods, such interventions have occurred only four times since 1996, according to the New York Fed. The announcement modestly strengthened the peso and sent Argentine dollar bonds higher.
What happened yesterday
In the Israel-Palestine conflict, Israel's cabinet approved the first phase of Trump's 20-point plan to end the Gaza war in the early hours of Friday, marking the formal confirmation from both Israel and Hamas. The ceasefire is set to take effect within 24 hours of the deal's signing, and hostages are expected to be released within 72 hours. The greater challenge now lies in implementing the second phase, as Israel has not committed to a full troop withdrawal or a definitive end to the conflict. On the other side, Hamas has agreed not to govern Gaza but seeks further negotiations on disarmament, troop redeployment, and the role of an international stabilisation force.
Equities: Equities edged slightly lower yesterday, with defensive sectors outperforming in what was otherwise a calm session.
We've entered a classic wait-and-see mode ahead of the upcoming U.S. data flow and the reopening of U.S. markets after the holiday. The Q3 earnings season will kick off in earnest next Tuesday, which is likely to re-energize sentiment.
In the US yesterday, Dow -0.5%, S&P 500 -0.3%), Nasdaq -0.1%, and Russell 2000 -0.6%.
In Asia this morning, equities trade modestly lower after a strong run earlier in the week. South Korea stands out as an exception, rising after reopening from its Golden Week holidays.
U.S. futures are marginally higher, while European futures are broadly unchanged.
FI and FX: Markets are adopting a more optimistic stance on France, as reflected in the tightening of the 10Y Oat-Bund spread during yesterday's session. Despite this positive sentiment on France, EURUSD continued its downward trajectory, potentially influenced by the somewhat dovish ECB minutes released yesterday. Today our focus is on Norway's inflation release and several key economic indicators out of Sweden.
EUR/USD Daily Outlook
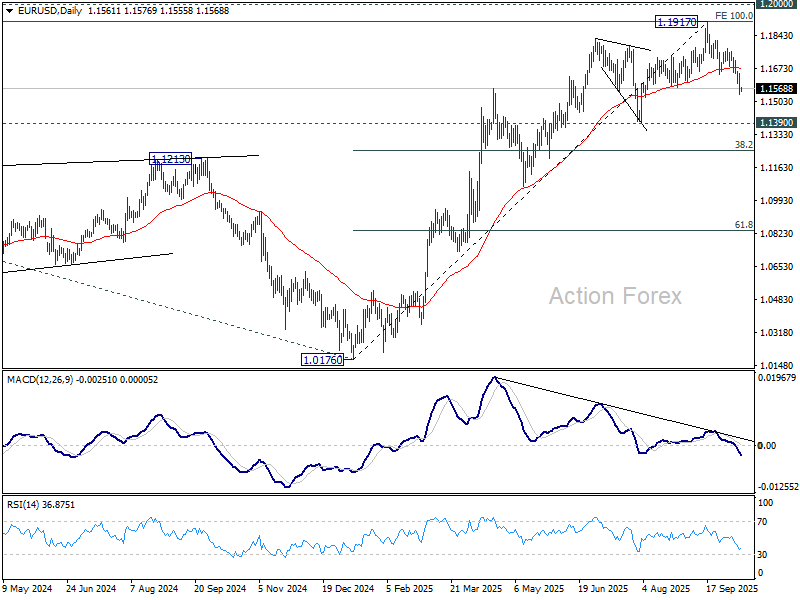
Daily Pivots: (S1) 1.1521; (P) 1.1585; (R1) 1.1627; More...
Intraday bias in EUR/USD stays on the downside, as fall from 1.1917 is in progress for 1.1390 support. Break there will target 38.2% retracement of 1.0176 to 1.1917 at 1.1252. On the upside, above 1.1647 minor resistance will turn intraday bias neutral first. But risk will stay on the downside as long as 1.1778 resistance holds, in case of recovery.
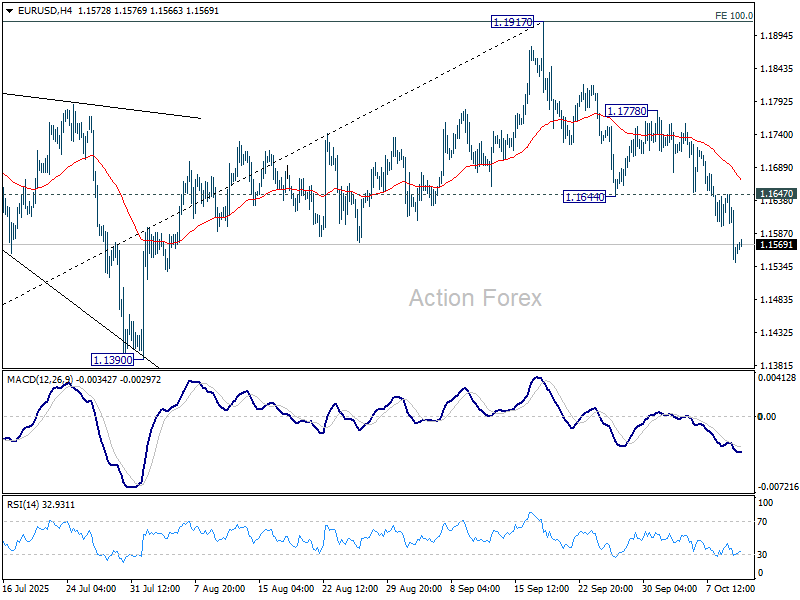
In the bigger picture, rise from 1.0176 (2025 low) is seen as the third leg of the pattern from 0.9534 (2022 low). 100% projection of 0.9534 to 1.1274 from 1.0176 at 1.1916 was already met. For now, further rally will remain in favor as long as 1.1390 support holds, and firm break of 1.2000 psychological level will carry larger bullish implications. However, firm break of 1.1390 will suggest that rise from 1.0176 has already completed and bring deeper fall to 55 W EMA (now at 1.1265) and below.
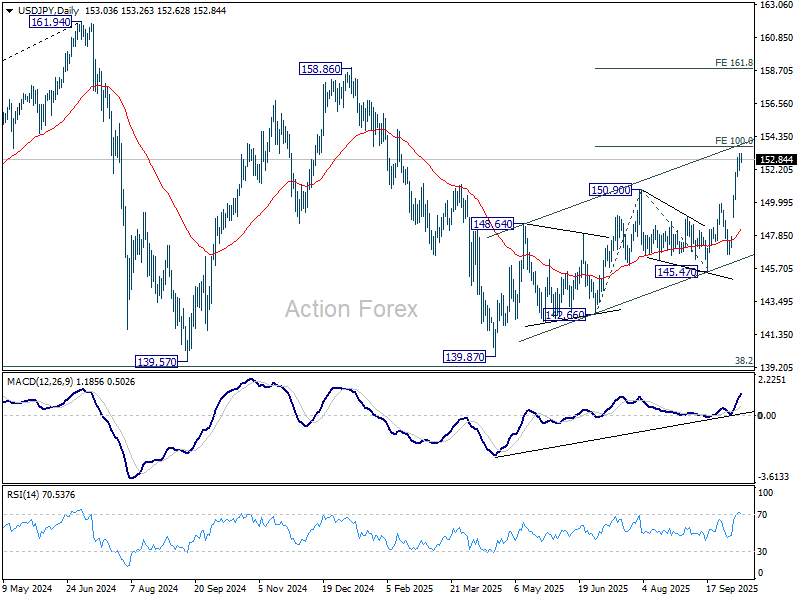
USD/JPY Daily Outlook
Daily Pivots: (S1) 152.40; (P) 152.81; (R1) 153.51; More...
USD/JPY edged higher to 153.26 but quickly retreated. Intraday bias stays neutral first and some more consolidations could be seen. Downside should be contained above 149.95 resistance turned support to bring another rally. On the upside, above 153.26 will resume larger rise to 100% projection of 142.66 to 150.90 from 145.47 at 153.71. Firm break there will pave the way to 161.8% projection at 158.80.
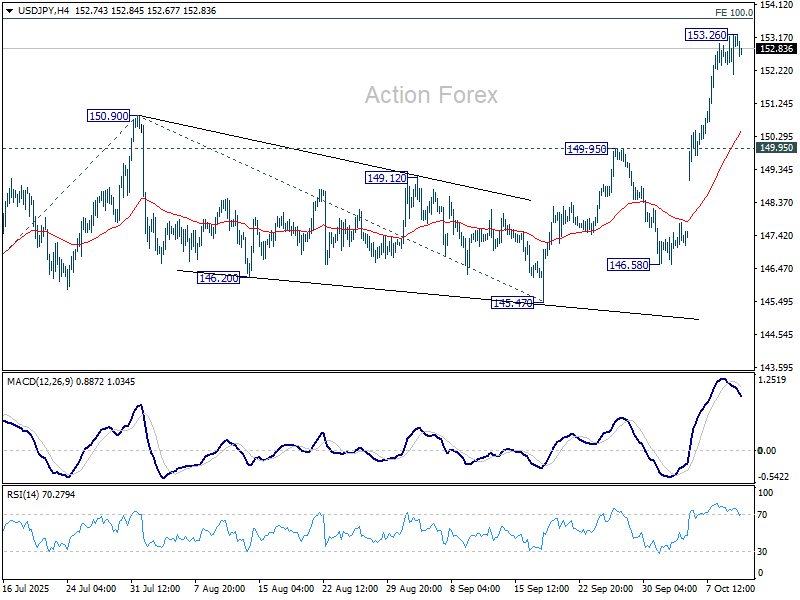
In the bigger picture, current development suggests that corrective pattern from 161.94 (2024 high) has completed with three waves at 139.87. Larger up trend from 102.58 (2021 low) could be ready to resume through 161.94 high. On the downside, break of 145.47 support will dampen this bullish view and extend the corrective pattern with another falling leg.