
Sample Category Title
Sunset Market Commentary
Markets
Investors on both sides of the Atlantic are facing a deep eco radio silence these days. The Minutes of the September Fed meeting yesterday indicated that a large majority of governors subscribed chair Powell assessement that downside risks to the labour market warranted a scaling back monetary restriction. However, the document showed little guidance on the timing/pace of additional steps on which governors had highly divergent views. With the policy rate still above neutral, markets for now have little reason to change their positioning, pricing about two additional steps 25 bps cuts end October and in December. NY Fed President Williams puts himself on the dovish side, indicating he will support lower rates this year of the economic evolves as expected (including inflation moving up to around 3% and the unemployment rate inching up beyond its current level of 4.3%). Even so, markets understand that even his (influential) position is only one ‘dot’ in a highly dispersed map. US yields today are ‘raising’ between about 1.5-2.5 bps across the curve. The focus now turns to this evening’s $22 bln 30-y Treasury action. Yesterday’s 10-y sale only met mediocre buying interest. How much will the fiscal stability topic still affects the 30-y sale? EMU/German yields also are holding very tight ranges (0.5 -2 bp higher). The Minutes of the September ECB policy meeting as expected indicated little reason for the bank to react to short-term deviations (cf infra). Even France today isn’t able to provide some directional bias. Outgoing Prime Minister Lecornu yesterday informed President Macron that a basis of lawmakers is prepared to provide a ‘platform of stability’ to help fabricating a 2026 budget. Even so, it currently is far from clear who will be prepared/able to finalized this Herculean task. (French) bonds at least don’t aggressively front run on a positive outcome yet. The 10-y spread of French bonds over swap still trades near 84 bps, compared to peak levels of near 88/90 earlier this week. European equity markets show no clear trend (Eurostoxx unchanged, CAC40 +0.4%). US indices open mixed/little changed.
In FX markets, the dollar remains the ‘by-default’ outperformer, but also here the ‘conviction’ of the move is fading a bit. DXY surpassed 99, but struggles to hold on. Over the previous days, the dollar mainly profited from (political) uncertainty haunting the euro and the yen. EUR/USD, despite current calm on/in France, is still fighting an uphill battle (currently 1.161). A break below 1.1574 brings the 1.1392 August low on the radar. With respect the yen, we have to impression that the decline at least might slow. The pair still touched an new ST peak north of 153. However, the question gradually looms how far the yen can weaken before the BOJ will be ‘forced‘ to still raise its policy rate, whatever the ‘guidance’ from a new government.
News & Views
Portugal’s 2026 budget bill has stronger growth penciled in as well as a small surplus for the fourth consecutive year. The center-right minority government expects the economy to grow at a 2.3% clip next year, compared to an anticipated 2% in 2025. The projected budget surplus of 0.1% comes even as Portugal plans tax cuts for companies and families, allowing the public debt ratio fall further from a peak of more than 134% in 2020 to 90.2% this year and 87.8% in 2026. The bill marks once more the stark and growing contrast between the southern European periphery (remember PIGS) that used to underperform the semi-core. The likes of France and Belgium are currently facing a daunting budget task with the former not even having a stable government in place to take up the gauntlet.
"The current level of interest rates should be seen as sufficiently robust in managing shocks, in view of two-sided inflation risks and taking into account a broad range of possible scenarios.” The conclusion in the ECB’s meeting minutes was a pretty straightforward one. "Several" thought inflation was at risk of undershooting the bank's 2% target and a "few" feared for the opposite to happen. But with ECB’s Lagarde in recent comments noting that the range of risk around the inflation was narrowing, there is little reason to expect much changes to the policy rate short-term. The ECB acknowledged, however, that the current situation was likely to change materially at some point, but it it’s difficult to know when and in which direction. That makes waiting for more information the best option for the time being. ECB policymakers agreed that their June forecast was largely materializing, resulting in a rates status quo at 2% and more or less unchanged September projections.
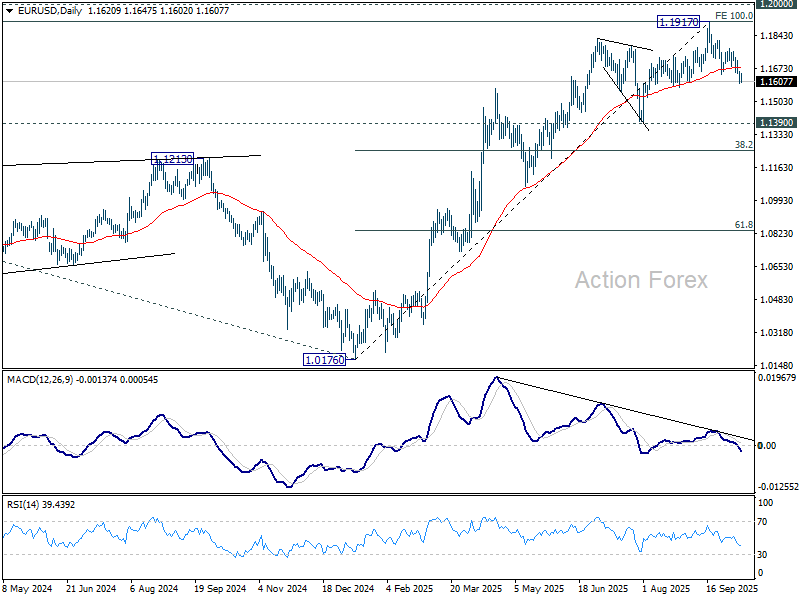
EUR/USD Mid-Day Outlook
Daily Pivots: (S1) 1.1598; (P) 1.1631; (R1) 1.1662; More...
Intraday bias in EUR/USD remains on the downside for the moment. Fall from 1.1917 is in progress and deeper decline should be seen to 1.1390 support, or even further to 38.2% retracement of 1.0176 to 1.1917 at 1.1252. On the upside, above 1.1682 minor resistance will turn intraday bias neutral first. But risk will stay on the downside as long as 1.1778 resistance holds, in case of recovery.
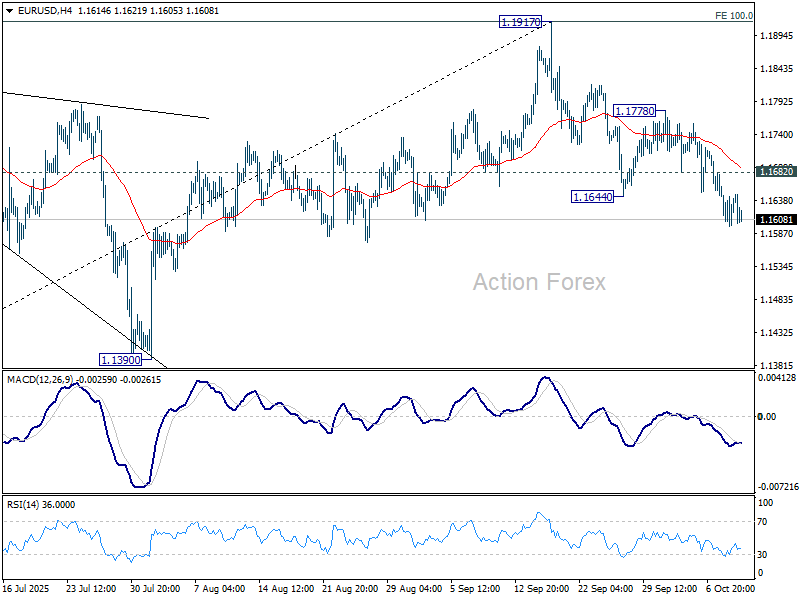
In the bigger picture, rise from 1.0176 (2025 low) is seen as the third leg of the pattern from 0.9534 (2022 low). 100% projection of 0.9534 to 1.1274 from 1.0176 at 1.1916 was already met. For now, further rally will remain in favor as long as 1.1390 support holds, and firm break of 1.2000 psychological level will carry larger bullish implications. However, firm break of 1.1390 will suggest that rise from 1.0176 has already completed and bring deeper fall to 55 W EMA (now at 1.1265) and below.
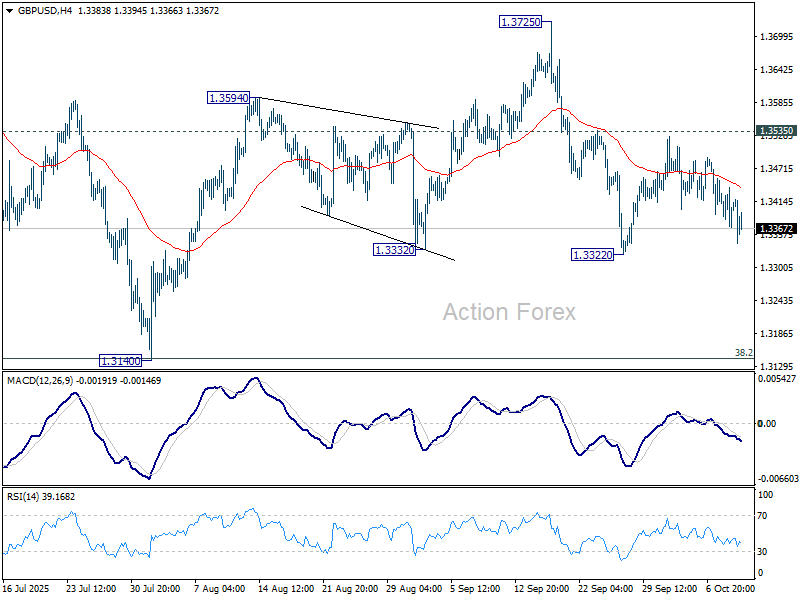
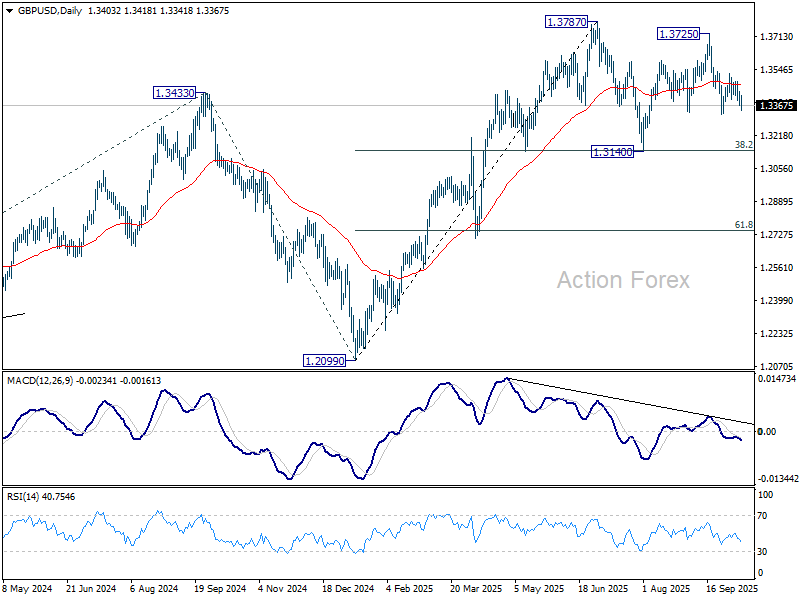
GBP/USD Mid-Day Outlook
Daily Pivots: (S1) 1.3369; (P) 1.3407; (R1) 1.3442; More...
GBP/USD is still bounded in range above 1.3322 and intraday bias remains neutral. With 1.3535 resistance intact, further decline is mildly in favor. On the downside, break of 1.3322 will resume the fall from 1.3725 to 1.3140 support. On the upside, though, firm break of 1.3535 will argue that pullback from 1.3725 has already completed, and bring stronger rise to retest 1.3725/87 key resistance zone.
In the bigger picture, rise from 1.0351 (2022 low) is still seen as a corrective move. Further rally could be seen to 61.8% projection of 1.0351 to 1.3433 (2024 high) from 1.2099 (2025 low) at 1.4004. But strong resistance could be seen from 1.4248 (2021 high) to limit upside. Sustained break of 55 W EMA (now at 1.3176) will argue that a medium term top has already formed and bring deeper fall back to 1.2099.
USD/CHF Mid-Day Outlook
Daily Pivots: (S1) 0.7988; (P) 0.8008; (R1) 0.8040; More…
USD/CHF's rise from 0.7828 is still in progress and intraday bias stays on the upside. Sustained trading above 55 D EMA (now at 0.8004) will suggest that rise from 0.7828 is already correcting whole fall from 0.9200. Further rally should the be seen to 0.8170 resistance and possibly above. For now, risk will stay on the upside as long as 0.7944 support holds, in case of retreat.
In the bigger picture, long term down trend from 1.0342 (2017 high) is still in progress. Next target is 100% projection of 1.0146 (2022 high) to 0.8332 from 0.9200 at 0.7382. In any case, outlook will stay bearish as long as 0.8332 support turned resistance holds (2023 low).
USD/JPY Mid-Day Outlook
Daily Pivots: (S1) 151.96; (P) 152.48; (R1) 153.22; More...
Intraday bias in USD/JPY is turned neutral with current retreat, and some consolidations would be seen below 153.20 temporary top first. But downside should be contained above 149.95 resistance turned support to bring another rally. On the upside, above 153.20 will resume larger rise to 100% projection of 142.66 to 150.90 from 145.47 at 153.71. Firm break there will pave the way to 161.8% projection at 158.80.
In the bigger picture, current development suggests that corrective pattern from 161.94 (2024 high) has completed with three waves at 139.87. Larger up trend from 102.58 (2021 low) could be ready to resume through 161.94 high. On the downside, break of 145.47 support will dampen this bullish view and extend the corrective pattern with another falling leg.
EUR/JPY Mid-Day Outlook
Daily Pivots: (S1) 177.03; (P) 177.44; (R1) 177.99; More...
Intraday bias in EUR/JPY is turned neutral first with current retreat, and some consolidations would be seen below 177.91 temporary top. Downside should be contained above 175.03 resistance turned support to bring another rally. On the upside, above 177.91 will resume larger up trend to 61.8% projection of 161.06 to 173.87 from 172.24 at 180.15 next.
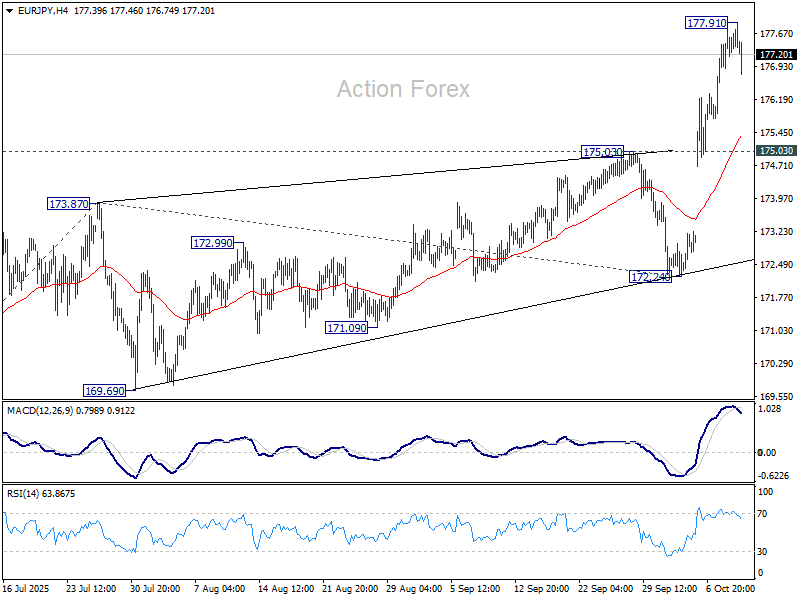
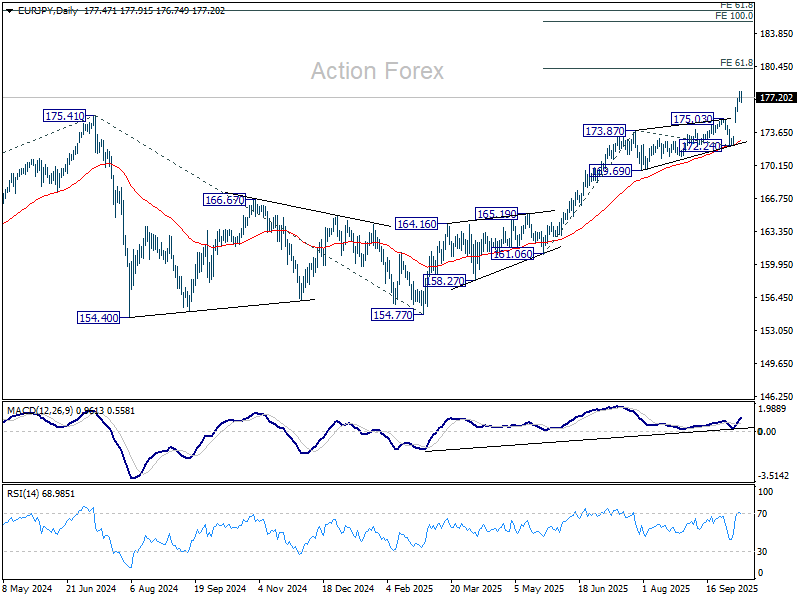
In the bigger picture, up trend from 114.42 (2020 low) is resuming with break of 175.41 (2024 high). Next target is 61.8% projection of 124.37 to 175.41 from 154.77 at 186.31. Outlook will continue to stay bullish as long as 55 W EMA (now at 166.82) holds, even in case of deep pullback.
EUR/AUD Mid-Day Outlook
Daily Pivots: (S1) 1.7612; (P) 1.7667; (R1) 1.7703; More...
EUR/AUD's break of 1.7588 support confirms resumption of the fall from 1.8155. Such decline is seen as the third leg of the corrective pattern from 1.8554 high. Intraday bias is back on the downside for 100% projection of 1.8155 to 1.7588 from 1.7929 at 1.7362. On the upside, above 1.7672 minor resistance will turn intraday bias neutral again first.
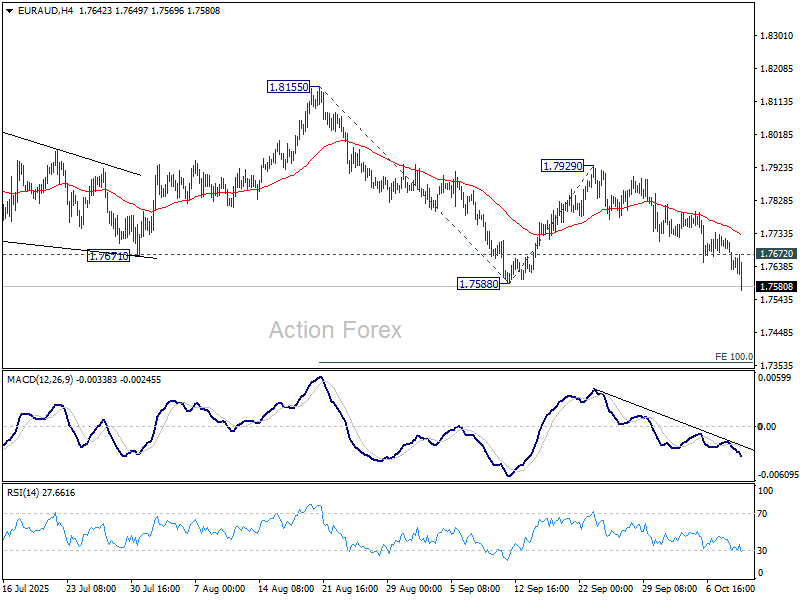
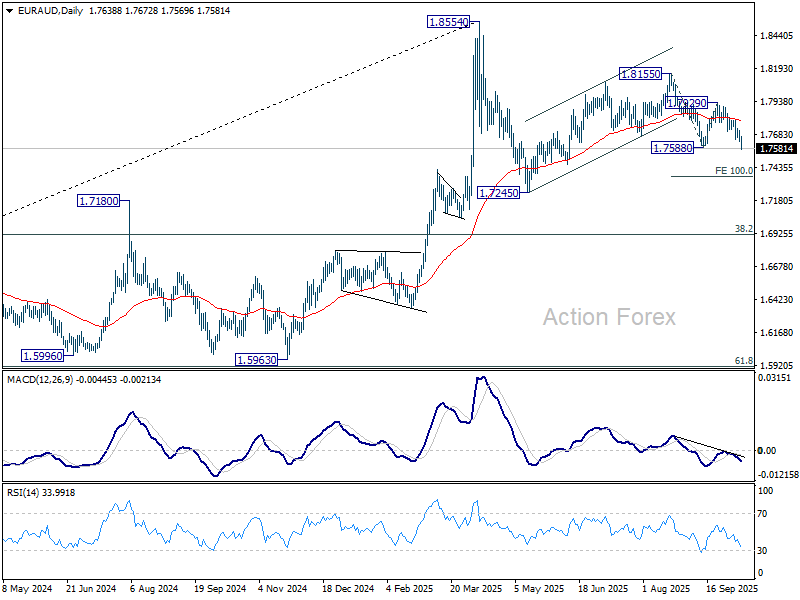
In the bigger picture, price actions from 1.8554 medium term top are seen as a corrective pattern. Deeper fall could be seen as the pattern extends, but downside should be contained by 38.2% retracement of 1.4281 (2022 low) to 1.8554 at 1.6922 to bring rebound. Uptrend from 1.4281 is expected to resume at a later stage.
Euro Under Fire Again as France’s Macron Hunts for Sixth Prime Minister in Two Years
Euro came under renewed selling pressure today, particularly in crosses, as investors reacted nervously to deepening political uncertainty in France. President Emmanuel Macron’s search for a new prime minister dominated headlines. His office confirmed that he would appoint a replacement “within 48 hours,” after outgoing Prime Minister Sebastien Lecornu spent two days in futile talks to resolve what has become France’s worst political crisis in decades. Macron’s next pick would be his sixth prime minister in less than two years, highlighting the instability that has plagued his administration.
The abrupt resignation of Lecornu—after just 27 days in office—surprised markets, which had largely assumed that the next step in France’s political drama would be a snap parliamentary election. Instead, the prospect of yet another reshuffle with no clear end to the legislative gridlock has rekindled investor anxiety about France’s fiscal direction and reform capacity.
Meanwhile the ECB’s September meeting accounts, released overnight, reaffirmed that the central bank is firmly on hold and in no rush to adjust interest rates. Importantly, the minutes also made clear that “moderate fluctuations of inflation around the target” should not prompt a policy adjustment — effectively confirming that the ECB sees little reason to move in the near term. The reiteration of patience was already priced in by markets, and provided no meaningful support to the Euro, which continues to trade on political headlines rather than monetary expectations.
Elsewhere, currency market performance this week remains broadly consistent. Yen continues to lead losses, pressured by risk-on sentiment and doubts over further BoJ tightening. The Euro ranks second worst, with the Kiwi close behind following the RBNZ’s dovish 50bps cut. In contrast, Aussie and Loonie remain top performers. Dollar holds firm in the upper tier. Sterling and the Swiss Franc are trading mixed in the middle.
In Europe, at the time of writing, FTSE is down -0.18%. DAX is up 0.53%. CAC is up 0.50%. UK 10-year yield is up 0.016 at 4.737. Germany 10-year yield is up 0.01 at 2.692. Earlier in Asia, Nikkei rose 1.77%. Hong Kong HSI fell -0.29%. China Shanghai SSE rose 1.32%. Singapore Strait Times fell -0.35%. Japan 10-year JGB yield fell -0.007 to 1.697.
ECB minutes show comfort with current policy, high value in waiting
Minutes of the ECB’s September 10–11 meeting revealed broad agreement among policymakers that there was “no immediate pressure” to adjust interest rates. Officials noted that recent data confirmed inflation is “in a good place” while the domestic economy remains “resilient,” risks to growth now seen as “more balanced.”
The ECB recognized that the environment remains more uncertain than usual. The situation was likely to “change materially at some point” but the timing and direction were still unclear. The minutes noted the “high option value” of waiting for more evidence before altering policy, given two-sided inflation risks and the potential for unexpected shocks. The current rate level was described as “sufficiently robust” to manage a range of outcomes.
It also stressed that monetary policy should not be recalibrated for “moderate fluctuations of inflation around the target,” but only when a “significant deviation” is expected over the medium term. Though, while large, sustained deviations from target—like those seen over the past decade—are rare, monetary policy will still be ready to deliver “cyclical responses” to demand shocks.
BoE’s Mann: Inflation scarring still weighing on consumption, justifies policy restraint for longer
BoE policymaker Catherine Mann cautioned in a speech today that monetary policy must remain restrictive despite signs of weak consumption, arguing that high inflation has scarred UK consumers and continues to suppress spending.
“If the consumption gap was my only concern, reducing the restrictiveness of monetary policy would be appropriate,” she said. “However, in light of elevated inflation and expectations, maintaining restrictiveness for longer would be appropriate.”
Mann said the Bank’s analysis points to two drivers of the consumption gap: first, inflation and consumer scarring, and second, the channels through which monetary policy affects consumption.
The former, she explained, is a legacy of the rapid price surge that eroded purchasing power and altered household behavior. “High inflation itself is behind income uncertainty and weak consumption growth,” she said. “Monetary policy needs to continue to focus on reducing inflation” so households can return to a sustainable spending pattern.
For the second, she emphasized that higher rates have already exerted a material drag on demand, and the tightening effect is already waning. “Monetary policy has indeed loosened,” Mann said, adding that its impact on consumption has peaked.
EUR/AUD Mid-Day Outlook
Daily Pivots: (S1) 1.7612; (P) 1.7667; (R1) 1.7703; More...
EUR/AUD's break of 1.7588 support confirms resumption of the fall from 1.8155. Such decline is seen as the third leg of the corrective pattern from 1.8554 high. Intraday bias is back on the downside for 100% projection of 1.8155 to 1.7588 from 1.7929 at 1.7362. On the upside, above 1.7672 minor resistance will turn intraday bias neutral again first.
In the bigger picture, price actions from 1.8554 medium term top are seen as a corrective pattern. Deeper fall could be seen as the pattern extends, but downside should be contained by 38.2% retracement of 1.4281 (2022 low) to 1.8554 at 1.6922 to bring rebound. Uptrend from 1.4281 is expected to resume at a later stage.
ECB minutes show comfort with current policy, high value in waiting
Minutes of the ECB’s September 10–11 meeting revealed broad agreement among policymakers that there was “no immediate pressure” to adjust interest rates. Officials noted that recent data confirmed inflation is “in a good place” while the domestic economy remains “resilient,” risks to growth now seen as “more balanced.”
The ECB recognized that the environment remains more uncertain than usual. The situation was likely to “change materially at some point” but the timing and direction were still unclear. The minutes noted the “high option value” of waiting for more evidence before altering policy, given two-sided inflation risks and the potential for unexpected shocks. The current rate level was described as “sufficiently robust” to manage a range of outcomes.
It also stressed that monetary policy should not be recalibrated for “moderate fluctuations of inflation around the target,” but only when a “significant deviation” is expected over the medium term. Though, while large, sustained deviations from target—like those seen over the past decade—are rare, monetary policy will still be ready to deliver “cyclical responses” to demand shocks.
(ECB) Monetary policy accounts
Account of the monetary policy meeting of the Governing Council of the European Central Bank held in Frankfurt am Main on Wednesday and Thursday, 10-11 September 2025
9 October 2025
1. Review of financial, economic and monetary developments and policy options
Financial market developments
Ms Schnabel started her presentation by noting that since the Governing Council’s previous monetary policy meeting on 23-24 July 2025, interest rate markets in the euro area and the United States had been pulled in different directions, leading to a convergence of policy rate expectations. In the euro area, expectations for interest rates had shifted higher, with reduced uncertainty around the rate outlook, as a consensus had formed that interest rates were currently in a “good place” and close to or at the end of the monetary policy cycle. Markets had fully priced out any rate cut at the current meeting and assigned a significantly lower probability to another 25 basis point rate cut by year-end. The median participant in the ECB Survey of Monetary Analysts anticipated no further rate cuts in 2025, while the median respondent in both the Bloomberg and Reuters surveys did not expect any further rate cut in the current cycle. In the United States, market expectations of a quicker easing cycle had increased after weak labour market data. As a result, the gap between the one-year rate one year ahead in the euro area and the United States had narrowed to its lowest level since September 2024.
The bulk of the adjustment in market expectations for ECB monetary policy since June 2025 had occurred after the Governing Council’s June and July monetary policy meetings, which had been interpreted as signalling that no further rate cuts were imminent. Subsequent data releases had confirmed and reinforced this new baseline path. Moreover, uncertainty around the expected rate path had decreased. This stood in contrast to developments in the United States, where option-implied probabilities suggested that US rate uncertainty remained elevated.
The key fundamental driver of the gradual convergence in policy rate expectations had been the narrowing gap in the economic outlook between the euro area and the United States. Consensus Economics growth expectations for the euro area in 2025 were now well above their levels prior to the US tariff announcement on 2 April, and expectations for 2026 had declined only mildly. By contrast, growth expectations for the United States for both 2025 and 2026 had been revised down sharply. Developments in the inflation outlook seemed to be less in line with the converging rate outlook. In the euro area, investors’ inflation expectations had stabilised at around the ECB’s inflation target. By contrast, medium-term inflation compensation in the United States had trended higher after the drop in April, despite the substantial downward revision in US growth expectations over the same period.
Market pricing of looser US monetary policy could be explained by pointing to the fact that, over the past year, US interest rates had become far more sensitive to surprises in US non-farm employment figures than in previous years. Sensitivity to US inflation surprises had, however, fallen to close to zero, indicating that investor focus in the United States had shifted towards real economic data.
In the euro area, medium and longer-term interest rates had remained broadly stable over recent months. In the United States, the slight decline in the ten-year rate since April 2025 had been due to offsetting factors. Investors expected a more accommodative monetary policy stance in the United States, but at the same time demanded higher compensation for the various risks surrounding that scenario, including potential risks to US public debt sustainability.
Yields on 30-year bonds had reached historically high levels in some advanced economies. This had contributed to a steepening of the yield curve at the very long end. However, from a longer-term perspective, this steepening appeared to be a normalisation after a long period of compressed term premia, as yield curves remained much less steep than before the start of large-scale asset purchases across most major central banks.
In spite of the narrowing interest rate differential, the exchange rate had remained broadly constant. The largest part of the appreciation of the euro in 2025 could be explained by relative demand and sentiment. Important drivers of exchange rate developments had been the announcements of tariffs and the subsequent trade agreements. A comparison of bilateral exchange rate movements of a broad set of currencies against the US dollar showed that the initial depreciation of the US dollar against almost all currencies after the April tariff announcement had been followed by an appreciation after the July tariff agreements, partly reversing the April moves.
Despite political uncertainty in France, sovereign bond spreads vis-à-vis the German Bund had remained range-bound for euro area countries, with the euro area GDP-weighted sovereign spread having steadily declined since its peak in the autumn of 2022. The dispersion of ten-year sovereign spreads across euro area countries stood at its lowest level since 2007, before the global financial crisis. This showed that fragmentation in euro area sovereign bond markets had declined in spite of the ongoing reduction in the Eurosystem balance sheet and higher short and long-term rates.
One factor supporting euro area government bond markets had been the renewed interest of foreign investors. Since Eurosystem net asset purchases had ended, the euro area had seen a sharp increase in foreign inflows. Two main factors explained this renewed foreign demand for euro area assets. First, euro area government bonds currently offered more attractive yields than US Treasuries or Japanese government bonds when adjusted for currency hedging costs. Second, the narrowing gap in the economic outlook between the euro area and the United States as well as concerns about high concentration of investments had prompted a broad shift towards diversification, with the euro area being a key beneficiary.
Euro area equity prices had remained broadly stable since the Governing Council’s previous monetary policy meeting. At the same time, the performance of tariff-sensitive sectors had remained significantly subdued relative to benchmark indices. Financial market volatility had declined further across market segments. Implied volatility stood near the year-to-date lows in euro area and US equity markets, euro area bond markets and also in the EUR/USD exchange rate. At the same time, measures of economic policy uncertainty remained at an elevated level, which could, however, overstate true uncertainty.
Ms Schnabel concluded with a note of caution on current market valuations, stressing that elevated asset valuations in some market segments increased the risk of sudden and sharp price corrections if the current favourable risk sentiment were to deteriorate.
The global environment and economic and monetary developments in the euro area
Mr Lane then went through the latest economic, monetary and financial developments in the global economy and the euro area.
Starting with inflation developments in the euro area, Mr Lane noted that inflation was currently at around the 2% medium-term target and the inflation outlook was broadly unchanged. Inflation had stood at 2.1% in August according to the Eurostat flash estimate, compared with 2.0% in July. Energy price inflation had risen to -1.9%, from -2.4% in July, while food price inflation had declined to 3.2% from 3.3% previously. Core inflation, i.e. inflation excluding energy and food, had stayed constant, at 2.3%, for the fourth month in a row. Services inflation had inched down to 3.1%, from 3.2% in July, while non-energy industrial goods inflation had been unchanged at 0.8%.
According to the September ECB staff projections, headline inflation should average 2.1% in 2025, 1.7% in 2026 and 1.9% in 2027, which presented a similar picture as the June Eurosystem staff projections. Energy inflation was expected to strengthen from -1.6% in 2025 to -1.1% in 2026 and 2.4% in 2027, owing in part to the start of the EU Emissions Trading System 2 (ETS2). In contrast, non-energy inflation was projected to fall from 2.5% in 2025 to 2.0% in 2026 and 1.9% in 2027. Within the non-energy category, food inflation was projected to drop from 2.9% in 2025 to 2.3% in 2026 and 2027. Core inflation was seen to fall from 2.4% in 2025 to 1.9% in 2026 and 1.8% in 2027. In addition to the expected moderation in labour cost pressures, contributors to the decline in non-energy inflation included the appreciation of the euro, deflation in Chinese export prices and less upward pressure on indirect taxes and administered prices.
Most indicators of underlying inflation had moved little in recent months and remained consistent with inflation stabilising at the ECB’s 2% medium-term target. Year-on-year growth in compensation per employee had been 3.9% in the second quarter of the year, which was a significant deceleration relative to the 4.8% in the second quarter of 2024 and the 5.7% in the second quarter of 2023. The September staff projections anticipated compensation per employee growth to decelerate further over the second half of this year and to stabilise at levels slightly below 3% by 2027. Other forward-looking indicators, including the ECB wage tracker and surveys on wage expectations, also signalled that wages would moderate further. The main factor behind easing wage growth was the normalisation of negotiations in collective bargaining, after several years of wages catching up with the earlier surge in inflation. Along with productivity gains, this wage moderation would help keep a lid on domestic price pressures, even as corporate profits recovered from low levels.
Most measures of longer-term inflation expectations continued to stand at around 2%. The median expectations expressed in the latest Survey of Monetary Analysts showed a medium-term profile similar to the ECB staff projections. Market-based indicators of inflation compensation were also broadly in line.
Turning to the external environment, the euro exchange rate had remained largely unchanged against the US dollar and in nominal effective terms since the last Governing Council meeting, but the appreciation of the euro over the spring, both against the dollar and on a trade-weighted basis, was one of the challenges facing euro area foreign demand. Compared with the June staff projections, the euro had appreciated 3.3% against the US dollar and 2.3% in nominal effective terms. These exchange rate assumptions in the September projections implied an appreciation of the euro of almost 6% in effective terms since the first quarter of 2025 (and 11% against the US dollar). Oil price assumptions had been revised up by around 3% on average over the projection horizon, while the assumptions for gas prices had been revised down somewhat.
Global growth was expected to remain subdued over the near term. Global trade had weakened in the second quarter and was expected to slow further, offsetting the temporary surge ahead of tariff increases. Moreover, the composition of global trade flows was adjusting to the new international trade environment. The decline in US imports from China had been offset by higher imports from other countries. China, in turn, had expanded flows of exports to other regions, both advanced economies and emerging markets. Through a combination of trade diversion and the depreciation of the renminbi against the euro, euro area imports from China had reached a new high in June. Global supply chains had not been significantly affected by the adjustments in the trade environment so far.
The economy had grown by 0.7% in cumulative terms over the first half of 2025, on account of the resilience in domestic demand. The quarterly pattern had shown stronger growth in the first quarter and weaker growth in the second, partly reflecting an initial frontloading of international trade ahead of expected tariff increases and then a reversal of that effect. Survey indicators suggested that both manufacturing and services had continued to grow into the third quarter, pointing to some positive underlying momentum in the economy. The Purchasing Managers’ Index (PMI) for services activity had decreased but remained in expansionary territory, while the headline PMI for manufacturing had risen into expansionary territory for the first time since 2022, spurred by a rise in new domestic orders.
The labour market remained a source of strength, with unemployment standing at 6.2% in July. The PMI for employment had remained in expansionary territory at 50.8, suggesting ongoing modest employment growth into the third quarter of 2025. However, labour demand continued to soften: the job vacancy rate had declined to 2.3% in the second quarter from its peak of 3.3% three years before, and from 2.6% in the same quarter of 2024.
Over the remainder of the projection horizon, consumption was expected to benefit from the solid labour market, along with a declining saving rate. Moreover, the pass-through of previous interest rate cuts to financing conditions should further bolster consumption and support investment. Over time, investment should also be underpinned by substantial government spending on infrastructure and defence.
Higher tariffs, a stronger euro and increased import competition would remain a headwind to growth over the remainder of the year. However, the growth rates of foreign demand and exports were then expected to recover. While recent trade agreements had reduced uncertainty somewhat, the overall impact of the change in the global trade environment would only become clear over time.
Turning to fiscal policies, there had been a significant tightening in 2024 and the budget balance had moved from -3.5% in 2023 to an expected -2.9% in 2025, as most of the inflation compensation measures had been rolled back. Looking ahead, the fiscal expansion in the euro area’s largest economy in particular was expected to lead to some fiscal loosening, especially in 2026, supporting the euro area economy. At the same time, the euro area budget balance was projected to be above the 3% of GDP reference value over 2026 and 2027, with debt continuing its upward trend.
Overall, staff expected the economy to grow by 1.2% in 2025, revised up from 0.9% in the June Eurosystem staff projections exercise, owing to better-than-expected incoming data and carry-over from back revisions. The growth projection for 2026 had been revised down slightly to 1.0%, owing to the appreciation of the euro and weaker foreign demand, partly related to somewhat higher tariffs than assumed in the June projections. The projection for 2027 was unchanged at 1.3%.
Turning to monetary and financial analysis, short-term market rates had increased since the Governing Council’s last meeting, while longer-term risk-free rates had remained broadly unchanged. However, the ongoing pass-through of the ECB’s past interest rate cuts had continued to lower corporate borrowing costs in July. The average interest rate on new loans to firms had edged down to 3.5% from 3.6% in June. The cost of issuing market-based debt had been unchanged in July, at 3.5%. Loans to firms had grown by 2.8%, slightly more strongly than in June, while the growth of corporate bond issuance had jumped to 4.1% from 3.4%. The average interest rate on new mortgages had again been unchanged, at 3.3% in July, while growth in mortgage lending had picked up from 2.2% to 2.4%. Overall, while becoming gradually more supportive of spending, credit growth remained unusually sluggish compared with previous easing cycles.
Monetary policy considerations and policy options
Based on this assessment, Mr Lane proposed that the Governing Council keep the three key ECB interest rates unchanged. While a further rate cut in the coming months would better protect the inflation target both under the baseline and across a range of adverse scenarios, the materialisation of upside risks would instead warrant maintaining the current level of the policy rate. Given this configuration, the Governing Council should continue monitoring the evolving distribution of the risks to the inflation outlook and the economy. The US-EU trade agreement had established important parameters that would define the new trading environment for European firms. In one direction, this had removed the more extreme downside risk to growth. In the other direction, the lack of retaliatory action by the EU had also diminished the risk that higher tariffs on its imports could push inflation higher than anticipated in the baseline. The Governing Council should reassess the evolving distribution of risks on a meeting-by-meeting basis, weighing the implications of the cumulative data flows for the medium-term inflation outlook. The ECB’s own surveys of firms, households and banks (the Corporate Telephone Survey, Consumer Expectations Survey, Bank Lending Survey, and Survey on the Access to Finance of Enterprises) would provide valuable insights into their beliefs and actions. As always, the ECB’s surveys of external experts (the Survey of Professional Forecasters and Survey of Monetary Analysts) would also provide useful inputs into the assessments of the Governing Council.
2. Governing Council’s discussion and monetary policy decisions
Economic, monetary and financial analyses
Regarding the economic analysis, members broadly agreed with the assessment provided by Mr Lane in his introduction. Global growth had accelerated recently amid somewhat lower trade policy uncertainty, with the global composite PMI increasing further in August, supported by both services and manufacturing. Real GDP growth had also surprised to the upside in the second quarter of 2025, notably in the United States and China, though this partly reflected the frontloading of world trade. However, the US economy was facing increasing risks of stagflation, with a slowing labour market and a possible pick-up in inflation, partly due to tariffs. More restrictive migration policies were another potential source of higher US inflation. In addition, projections from the US Congressional Budget Office showed that the recently passed tax and spending bill was very expansionary in fiscal terms.
Global trade was expected to remain soft in the second half of the year following the substantial frontloading of US imports ahead of higher tariffs. At the same time, lower trade policy uncertainty was likely to cushion some of the tariff headwinds, although higher global growth and lower inflation since last autumn should not necessarily be seen as a reflection of lower uncertainty. Instead, they were largely a consequence of lower commodity prices, particularly lower energy prices. Indeed, while trade policy had acted as a headwind to global activity, it had also put downward pressure on commodity prices.
Turning to the exchange rate and its potential pass-through, it was argued that it was important to put the recent appreciation of the euro into a broader perspective. Considering developments over the past year, it was contended that the recent moves could be seen more as fluctuations of a temporary nature than as part of a consistent trend in one direction. This would imply that the pass-through to consumer prices should be low given the way in which firms typically priced their goods in the face of exchange rate volatility. Moreover, it was argued that importers might not be inclined to pass on lower costs owing to downward price rigidities, especially since euro area domestic demand had remained robust and given the appetite of firms for rebuilding margins after several quarters of negative unit profit growth. From this perspective, a stronger pass-through to prices should only be expected if the euro were to appreciate much further than it had done earlier this year. It was argued that this was rather unlikely, as market participants had suggested that the previous appreciation of the euro had to a significant extent been driven by position-hedging in response to uncertainty ushered in by US tariff announcements in early April. Meanwhile, in terms of the effects of the exchange rate on the competitiveness of exporters, it was observed that the real effective exchange rate – the main metric used to measure competitiveness – had appreciated by much less than the nominal rate.
At the same time, while it was acknowledged that the exchange rate could sometimes be disconnected from fundamentals as a result of speculative behaviour, it seemed unlikely that such a disconnect was currently playing an important role, and the appreciation of the euro was likely to be persistent. In addition, further appreciation of the euro could not be excluded, amid rising expectations of rate cuts by the Federal Reserve. This was also reflected in median market forecasts for the EUR/USD exchange rate next year. Moreover, there had also been a risk premium element to the exchange rate moves, as dollar-denominated assets had been perceived as less of a safe haven for international portfolios than previously. The appreciation of the euro had come as an exogenous and sudden shock that had taken European exporters largely by surprise, which had made it hard for them to deploy strategies to handle a more expensive currency. It was also pointed out that the appreciation of the euro against the dollar had been partly driven by a reassessment of the relative growth outlook for the euro area and the United States. In this regard, it was suggested that a more positive outlook for the euro area economy had contributed to an appreciation of the euro that was at least partly demand-linked. However, doubts were expressed about whether the euro’s performance could really be attributed to underlying strength of the euro area economy, given the latter’s subdued pace of growth in the recent past and the various vulnerabilities surrounding its outlook. From this perspective, an alternative interpretation of the euro’s performance was that it in fact reflected a fundamental weakness of the dollar, given downward revisions to the outlook for the US economy. Furthermore, if the appreciation of the euro was attributable more to weak US demand than to strong euro area demand, and if it also reflected portfolio shifts due to a lower safety status of US assets, these forces would increase rather than reduce pass-through of the exchange rate to consumer prices.
While recent trade agreements had reduced uncertainty somewhat, the overall impact of the change in the global policy environment would only become clear over time. It was widely acknowledged that since the June staff projections a number of worst-case scenarios, such as the outbreak of an outright global trade war, had become less likely. Similarly, the risk of large trade-related supply-side disruptions had become less severe. However, the global trade policy environment remained volatile and highly uncertain in various dimensions. Many questions also remained regarding the specifics and implementation of the US-EU trade deal.
In this context, while the Chinese government had started to combat excess supply in its “anti-involution” campaign, it was argued that Chinese companies were trying to sell their products in the euro area at ever lower prices. This process would probably continue to exert disinflationary pressures until the overcapacity of Chinese companies had been reabsorbed. At the same time, it was argued that there was so far limited evidence that China was re-routing exports to the euro area at excessively low prices. It was also noted that while the euro area might have less disinflationary pressure if overcapacity were reduced, it would probably be at the cost of a weaker Chinese economy, which would have implications for the euro area’s external demand.
Geopolitical risks were very high and warranted close attention. Any geopolitical escalation could affect broader economic confidence, re-intensify supply chain pressures and ultimately slow down economic activity and, it was contended, push up inflation relative to the baseline outlook. The implications for fiscal policy were also becoming increasingly relevant, as geopolitical tensions could require even more spending on defence than so far expected, which would have an important influence on the evolution of the euro area economy.
At the same time, it remained difficult to assess many of these risks because their likelihood and economic impact were difficult to quantify. While sensitivity and scenario analyses around the staff projections were helpful, they could not fully capture many tail risks. So, while it was clear that the current economic and geopolitical situation could reasonably be expected to change quickly, it was very difficult to act upon such risks beyond being prepared from an operational standpoint.
With regard to euro area economic activity, members largely concurred with the assessment presented by Mr Lane in his introduction. The economy had grown by 0.7% in cumulative terms over the first half of the year, on account of the resilience in domestic demand. The quarterly pattern showed stronger growth in the first quarter and weaker growth in the second quarter, partly reflecting an initial frontloading of international trade ahead of expected tariff increases and then a reversal of that effect. Survey indicators suggested that both manufacturing and services continued to grow, signalling some positive underlying momentum in the economy. Over time, the strong labour market should also boost consumer spending, especially if, as foreseen in the staff projections, people saved less of their income. Consumer spending and investment should benefit from past interest rate cuts feeding through to financing conditions. Investment should also be underpinned by substantial government spending on infrastructure and defence. While higher tariffs, a stronger euro and increased global competition were expected to hold growth back for the rest of the year, the effect of these headwinds on growth should fade in 2026.
It was contended that the resilience of the euro area economy meant that it remained in relatively good shape, despite the dramatic change in trade policy in the current year and overall geopolitical uncertainty. This supported the view that the strength in GDP growth in the first half of 2025 could not be explained by frontloading alone. GDP growth had steadily accelerated since its trough in 2023, driven primarily by a robust recovery of domestic demand since mid-2024, which had been supported by easing financing conditions. This also suggested that there was positive underlying momentum in the euro area economy. According to the PMIs, output in the manufacturing sector was expanding at its fastest pace in more than three years, with rising new orders pointing to continued expansion ahead, while sentiment in the services sector remained mildly expansionary. A key factor behind this resilience was the labour market, with the economy operating at close to full employment. In addition, the impact of uncertainty surrounding US trade policy had so far been more limited than initially feared and confidence indicators had recently improved somewhat, with an increasing number of firms having an optimistic outlook. While structural competitiveness challenges remained, it was observed that recent trade agreements had led to an improvement in the relative competitiveness of euro area firms in the US market versus firms from most other economies, which were facing higher tariffs. It was also contended that the recent decline in uncertainty should foster business investment. Moreover, external forecasters expected economic growth to be higher than the staff projections. For example, the Survey of Monetary Analysts and Survey of Professional Forecasters both put growth at 1.4% in 2027. Overall, the view was expressed that the economic situation did not materially deviate from that articulated in the June projections, with price stability, growth close to potential and low unemployment. These positive features of the European economy were by and large reflected in the baseline outlook in the September staff projections.
At the same time, it was argued that growth had remained weak overall and vulnerable to several downside risks, including from persistent trade policy uncertainty, China’s re-routing of goods, an appreciation of the euro and political uncertainty. While the recovery contained in the staff projections relied on an expansion of domestic demand, real GDP had almost stagnated in the second quarter of 2025 as a result not only of lower exports but also weak domestic demand. Growth was likely to remain weak in the second part of the year and there were no clear signs yet of a robust recovery in domestic demand. Consumers remained cautious and investment was constrained by heightened geopolitical and trade uncertainty, suggesting a slow rebound in growth ahead. Foreign trade was likely to be a drag on growth for some time, as the effects of higher tariffs and the stronger euro would materialise only gradually.
For the first time in a while the latest staff projections contained upward revisions to GDP growth in the short term, with the economy projected to grow by 1.2% in 2025, up from the 0.9% expected in June. However, the growth projection for 2026 was now slightly lower, at 1.0%, while the projection for 2027 was unchanged at 1.3%. The two-year growth projection thus looked like a hub of stability, despite the many shocks of recent years, an external environment that remained unsettled and elevated geopolitical tensions. At the same time, it was contended that this situation was unlikely to last forever, with the latest projections possibly erring on the optimistic side in view of the many vulnerabilities and sources of heterogeneity which could endanger the recovery. Although the euro area economy had in the second quarter been more resilient than expected, this was largely due to the exceptional performance of the euro area’s fourth largest economy. Other economies were not performing well, as also reflected in the visible softening of their respective labour markets. Moreover, de-risking by banks was leading to uneven financial conditions for firms at a time when bankruptcy rates were rising, reaching levels not seen since 2015. Over the medium term, more restrictive migration policies could also weigh on euro area growth. Finally, the effects of US tariffs were still unfolding and external demand could therefore be weaker than expected, which would also drag down euro area growth.
The projections were based on a decline in the household saving rate. The robustness of this assumption was questioned, given that uncertainty about the economy was not expected to fade any time soon and it was normal for households, in such conditions, to save more for precautionary reasons. Moreover, there was evidence that households’ perceptions regarding their real disposable income were still scarred by the high-inflation episode, leading them to only gradually adjust their consumption to recently increasing purchasing power. Households might also have revised down expectations for their permanent income following the multitude of shocks that had hit the economy over recent years, leading them to save more. In addition, they might have started to expect higher future taxes and lower welfare spending, as the current geopolitical situation was forcing governments to spend more on defence. This Ricardian effect illustrated the likelihood of fiscal policy playing an important role in the future dynamics of the household saving rate and private consumption. At the same time, it was also argued that the saving rate could drop more strongly than assumed.
The labour market remained a source of strength, with the unemployment rate at 6.2% in July, even if demand for labour was softening. As labour demand was adjusting to lower growth, vacancy rates and the number of job starters per quarter had both already fallen below pre-pandemic levels, although the vacancy-to-unemployment ratio remained well above pre-pandemic levels. The unemployment rate warranted close attention over the coming quarters, especially since it was an important determinant of consumer confidence. It was welcome that unemployment duration in the euro area had come down significantly over the past several years, with a pronounced reduction in long-term unemployment. Labour market efficiency and fluidity had consequently been on the rise, with an inward shift of the euro area Beveridge curve (which maps the relationship between unemployment and the vacancy rate). Nevertheless, these features of an overall healthy labour market should not be taken for granted in the context of the ongoing fragile economic situation and should therefore be monitored closely. In addition, contrasting unemployment rates suggested that there were still significant differences across euro area labour markets.
The fiscal outlook was still being shaped by prospective higher defence spending in a context of elevated geopolitical tensions. There was a risk that the sheer scale of public spending being contemplated would crowd out private investment. It was also suggested that much of this spending could boost imports instead of internal production owing to the supply constraints in the euro area defence sector. At the same time, it was argued that fiscal policy could provide a stronger impulse than projected if fiscal multipliers were higher than assumed. The fiscal expansion could also pose challenges since the favourable “snowball” effect from the difference between the nominal economic growth rate and the interest rate on public debt had diminished, implying that there was now greater pressure to reduce primary deficits than in the recent past. In this context, it was observed that fiscal policies were coming under increased financial market scrutiny globally.
Overall, members considered it crucial that fiscal and structural policies make the economy more productive, competitive and resilient. One year on from the release of Mario Draghi’s report on the future of European competitiveness, it remained essential to follow up on its recommendations with further concrete action and to accelerate implementation, in line with the European Commission’s roadmap. Governments should prioritise growth-enhancing structural reforms and strategic investment, while ensuring sustainable public finances. It was critical to complete the savings and investments union and the banking union, to an ambitious timetable, and to rapidly establish the legislative framework for the potential introduction of a digital euro. As the President of the European Commission had highlighted in a recent speech, the current situation should be Europe’s “independence moment”, with clear political deadlines, including a Single Market roadmap for the period to 2028. While this message deserved the full support of the Governing Council, concerns were expressed that there was still insufficient drive for structural reform. In this context, it was observed that, according to the European Policy Innovation Council, only 11% of the Draghi report’s proposals had been fully implemented one year on.
Against this background, members assessed that risks to economic growth had become more balanced. While recent trade agreements had reduced uncertainty, a renewed worsening of trade relations could further dampen exports and drag down investment and consumption. A deterioration in financial market sentiment could lead to tighter financing conditions, greater risk aversion and weaker growth. Geopolitical tensions, such as Russia’s unjustified war against Ukraine and the tragic conflict in the Middle East, remained a major source of uncertainty. By contrast, higher than expected defence and infrastructure spending, together with productivity-enhancing reforms, would add to growth. An improvement in business confidence could stimulate private investment. Sentiment could also be lifted and activity spurred if geopolitical tensions diminished, or if the remaining trade disputes were resolved faster than expected.
With regard to price developments, members broadly concurred with the assessment presented by Mr Lane in his introduction. Annual inflation had remained close to target, standing at 2.1% in August according to the Eurostat flash estimate, compared with 2.0% in July. The new ECB staff projections presented a picture of inflation similar to that projected in June. They saw headline inflation averaging 2.1% in 2025, 1.7% in 2026 and 1.9% in 2027.
Members welcomed the fact that inflation had now been hovering around 2% for a number of months, and that disinflation had been achieved without a recession or financial instability. While monetary policy had supported the disinflationary process, several other factors had also played a role. Energy prices had fallen to the lower end of their recent range, while the appreciation of the euro and the relatively weak global economic sentiment owing to trade and geopolitical uncertainties had also helped to reduce inflation in the euro area by more than might otherwise have been the case. Nonetheless, some underlying disinflationary forces were expected to persist. Wage growth was expected to decline further over the projection horizon, partly in view of the slight softening in the labour market. In addition, the appreciation of the euro was still feeding through to goods inflation.
According to the September staff projections, inflation was expected to stabilise around the target over the medium term, which was good news. However, the view was also expressed that the inflation outlook had worsened slightly, because inflation would now undershoot the target not only in 2026 but also in 2027, and by an even wider margin when accounting for the upward effect on inflation from the introduction of ETS2 in 2027. In this context, while it was too early to assess how ETS2 would affect headline inflation over the longer term, the inflationary impact in 2027 might be merely transitory, i.e. a one-off adjustment rather than persistent pressure on energy inflation. In the December staff projections, the projection horizon would be extended to 2028, which should help to shed some light on the way this effect would likely play out beyond 2027. There was also a risk that national governments might delay or only partially implement ETS2, which could lead to a more pronounced undershoot in 2027. On the other hand, it was observed that inflation forecasts from other institutions and the private sector stood above the ECB staff projections for 2026 and 2027. For example, the Survey of Monetary Analysts and the Survey of Professional Forecasters saw both headline and core inflation at 2.0% in 2027. Consumer inflation expectations also continued to stand above the ECB’s target and had shown a recent uptick across horizons, including the five-year horizon. Finally, in the manufacturing sector, firms’ selling price expectations did not suggest ongoing downward pressure on goods inflation.
Slowing wage growth was welcomed and seen as supporting the expectation that inflation had settled around the ECB’s target in a sustainable manner. So far there had been a catch-up in real wages after households had lost purchasing power owing to the inflation surge, but no signs of any wage-price spiral. Looking ahead, it was noted that wage pressures could ease further if the labour market softened. However, given the tightness of the labour market and the low level of unemployment, and following the moderate upward surprise in the growth rate of compensation per employee in the second quarter, it was also argued that wage growth might decelerate more slowly than anticipated, especially if the expected cyclical recovery took hold. There was a risk that this would keep services inflation elevated. Moreover, even though services inflation was expected to stabilise over the projection horizon, the selling price expectations of companies in the services sector had remained firm, and core services inflation, which excluded volatile items, had fallen by much less than overall services inflation.
Trade tensions posed two-sided risks to the inflation outlook. It was argued that tariffs could be inflationary overall if effects via production networks were taken into account, with the euro area unlikely to be able to fully insulate itself from any rise in US or global inflation. Indeed, it had become clear during the pandemic that, in a still highly interconnected world economy, global inflationary pressures were likely to have spillover effects on the euro area. Upward price pressures could be reinforced by supply chain disruptions, such as export restrictions on rare earths or the end of the “de minimis” exemption of small packages shipped to the United States from tariffs. On the other hand, it was suggested that the downward impact on euro area inflation resulting from the appreciation of the euro this year was more important than any cost increases transmitted via production networks. It was also suggested that the re-routing of goods from China to the euro area might be intensifying faster than had been predicted by models, and stronger trade diversion could well lead to further disinflationary pressures. At the same time, it was argued that there was so far little evidence that China was re-routing exports to the euro area at excessively low prices. In the year to June, prices of imports from China had fallen by less than the euro’s appreciation. The impact on euro area inflation from trade re-routing could therefore be limited – also in view of the Chinese government’s “anti-involution” campaign, which was intended to combat both excess supply and excessive competition within China’s economy.
Food price inflation was another source of uncertainty. It had been driven higher by extreme weather events and there was a growing risk that average food price inflation might not revert to historical levels. Instead, food prices might face more persistent upward pressure as climate-related disruptions became more frequent and severe. These developments could mean that the projected decline in food price inflation to below its long-term average might not materialise. Moreover, food price inflation was particularly important because it could easily affect inflation expectations owing to its salience. At the same time, while the relative price of food was likely to rise on account of disruptions to harvests and green transition policies linked to the climate crisis, this did not necessarily have to entail permanent upward pressure on food inflation once relative prices had adjusted to the new environment.
Additionally, it was mentioned that the inflation measure that included owner-occupied housing was currently around 0.2 percentage points higher than the headline number of the Harmonised Index of Consumer Prices.
The outlook for inflation remained more uncertain than usual, as a result of the still volatile global trade policy environment. A stronger euro could bring inflation down further than expected. Moreover, inflation could turn out to be lower if higher tariffs led to lower demand for euro area exports and induced countries with overcapacity to further increase their exports to the euro area. Trade tensions could lead to greater volatility and risk aversion in financial markets, which would weigh on domestic demand and would thereby also lower inflation. By contrast, inflation could turn out to be higher if a fragmentation of global supply chains pushed up import prices and added to capacity constraints in the domestic economy. A boost in defence and infrastructure spending could also raise inflation over the medium term. Extreme weather events, and the unfolding climate crisis more broadly, could drive up food prices by more than expected.
Turning to the monetary and financial analysis, members largely concurred with the assessment provided by Ms Schnabel and Mr Lane in their introductions. Short-term market rates had increased since the Governing Council’s previous monetary policy meeting. Longer-term rates had remained broadly unchanged, contrasting with their decline in the United States. Market pricing attached zero probability to a rate cut at the September monetary policy meeting and only about a two-thirds chance to one additional cut by the middle of 2026, possibly owing to the stronger than expected economy. It also implied that monetary policy would eventually have to become tighter over the projection horizon, which could be linked to the expected increase in fiscal spending. ECB communication may also have played a role and could potentially have contributed to the recent contrasting developments between longer-term yields in the euro area and in the United States, although the decline in US yields also reflected lower US growth prospects and rate expectations.
Sovereign bond markets had remained calm and were not pricing in strains, especially when assessed from a historical perspective. At the same time, very long-term sovereign bond yields in some euro area countries had reached levels not seen in the past 15 years, with 30-year yields increasing consistently throughout the rate-cutting cycle despite a 200 basis point reduction in the deposit facility rate. To the extent that very long-term yields mattered for monetary policy transmission, this worked against the easing cycle. The increase in very long-term yields was part of a broader global phenomenon, which had seen them briefly reach multi-decade highs in the United Kingdom and Japan. This phenomenon indicated that market participants had started to pay closer attention to the fiscal positions of major economies around the world. Sustained elevated very long-term yields could dampen the current economic momentum in the euro area.
Risks also emanated from wider financial markets. Although markets had more than recovered the losses sustained during the spring, the significant increase in the price of gold over the past 18 months served as a warning. Financial markets were subject to potential mispricing and might be overlooking several concerning developments. US financial markets appeared to be optimistic, with US equity valuations, in particular, remaining elevated, despite the softening US labour market. The expected easing of US monetary policy might have contributed to strong valuations, although it was also observed that developments in artificial intelligence and the associated shift from labour towards capital could have simultaneously contributed to strong US equity valuations and the weakening of the US labour market. Stablecoins, crypto-assets and cyber risks posed further threats to the global financial system. Given all of this, the likelihood of an abrupt repricing in stock, bond and currency markets might have increased, and it could pose a risk to the euro area outlook. If there were a deterioration in financial market sentiment, it could lead to tighter financing conditions, greater risk aversion and weaker growth. At the same time, one important source of strength when facing these risks was the solidity of the banking sector in the euro area, which was an important precondition for financial stability more broadly.
Turning to financing conditions, the transmission of past interest rate cuts was continuing to lower corporate borrowing costs overall. The average interest rate on new loans to firms had declined to 3.5% in July, from 3.6% in June, while the cost of issuing market-based debt had been unchanged, at 3.5%. The average interest rate on new mortgages had remained unchanged, at 3.3% in July. However, banks had been de-risking by skewing their corporate lending away from risky firms towards safer ones. The decline in the observed cost of borrowing for firms could therefore partly reflect a compositional effect, which might mask true borrowing costs.
Credit was continuing to recover gradually. Bank loans to firms had grown by 2.8% in annual terms in July, slightly more strongly than in June, while the growth of corporate bond issuance had risen to 4.1%, from 3.4%. However, the pick-up in loan growth was waning, with the gap between the three-month annualised growth rate and annual growth now close to zero. Lending to small and medium-sized enterprises was also weaker than lending to other borrowers. While this could be due to their higher risk profile, it might also reflect structural weaknesses and constraints in the real economy. At the same time, growth in mortgage lending had picked up to 2.4% in July, from 2.2% in June.
Monetary policy stance and policy considerations
Turning to the monetary policy stance, members assessed the data that had become available since the last monetary policy meeting in accordance with the three main elements that the Governing Council had communicated in 2023, and had updated in July 2025, as shaping its reaction function. These were (i) the implications of the incoming economic and financial data for the inflation outlook and the risks surrounding it, (ii) the dynamics of underlying inflation, and (iii) the strength of monetary policy transmission.
Starting with the inflation outlook, members welcomed the fact that headline inflation was currently close to the 2% medium-term target. They judged that the incoming information was broadly in line with their previous assessment of the inflation outlook, as also reflected in the limited revisions in the September staff projections compared with the June projections. Inflation had remained very close to 2% for several months, with the central scenario materialising quarter after quarter, despite high uncertainties. According to the latest staff projections, inflation was expected to decrease to 1.7% in 2026 before edging up to 1.9% in 2027. The decline in inflation next year was now expected to be slightly less pronounced than previously anticipated, mainly owing to changes in energy prices. However, the staff projection for inflation in 2027 had been revised down slightly, partly owing to the appreciation of the euro, with a small undershoot now expected even when accounting for the effects of the start of ETS2 in 2027. Inflation expectations remained firmly anchored, with most measures of longer-term inflation expectations continuing to stand at around 2%, which also supported the stabilisation of inflation around the ECB’s target.
Against this background, risks surrounding the inflation outlook were identified on both sides. This assessment was also supported by staff risk, sensitivity and scenario analyses. There were multiple upside and downside risks to inflation, and while any overall assessment was a matter of judgement, it was very difficult to net all the factors out into strong balance of risk statements. While recent trade agreements had reduced uncertainty, the still volatile global trade policy environment meant that the outlook for inflation remained more uncertain than usual. However, it was also contended that risks surrounding the inflation outlook were rather low since many of them had been partly defused. The risk of the worst-case scenario of a full-scale trade war had diminished. Equally, the risk of large supply-side disruptions had become less severe as well. At the same time, it was argued that risks were still high by historical standards. The US-EU trade agreement had left some tariff issues unresolved. There were also many uncertainties surrounding non-tariff elements, as well as about the medium-term consequences of US tariffs and associated trade diversion and supply chain restructuring. Severe geopolitical risks also created major areas of uncertainty around the base-case outlook.
Several members viewed inflation risks as tilted to the downside over the medium term. From this perspective, the appreciation of the euro had been a genuinely exogenous shock unrelated to euro area economic conditions, and it could have a larger effect on inflation than included in the projections. Further appreciation was also possible given increasing expectations of interest rate cuts by the Federal Open Market Committee in the United States. It was also argued that trade tensions and uncertainty still posed downside risks to inflation. In particular, it was suggested that intensifying re-routing of goods to the euro area, from China and other countries with overcapacity, could manifest itself in lower export prices and result in lower inflation. These effects were likely larger than any upward risks from supply chain disruptions. In addition, a further slowdown in the US economy or an abrupt correction in US or global financial markets could exert extra disinflationary pressures on the euro area. In the context of major threats to external demand that might not be sufficiently counterbalanced by domestic demand, weaker than expected growth in the euro area – possibly amplified by an easing of the labour market from very high levels of employment – could lead to a more prolonged undershooting of the inflation target. The effects of fiscal expansion on growth and inflation could also be more limited than expected, mainly owing to Ricardian effects. Finally, there was a risk that ETS2 would be watered down or delayed, instead of being fully implemented in 2027. Without the expected upward effect of ETS2 on projected inflation in 2027, a sustainable return of inflation to target after the expected undershoot in 2026 would be further delayed. Besides, even if ETS2 were implemented in full, its inflationary impact in 2027 could represent a transitory one-off adjustment, thereby leading to a negative base effect in the 2028 inflation projection and creating the risk of undershooting then, especially in view of the expected decline in core inflation over the projection horizon.
A few members viewed inflation risks as tilted to the upside over the medium term, also noting that external forecasts for inflation in 2026 and 2027 stood above the latest staff projections. While monetary policy had supported the disinflationary process, the decline in inflation back to target could also partly be attributed to volatile developments in energy prices and the exchange rate, which could easily reverse. In addition, the pass-through from lower input costs linked to a stronger exchange rate or falling import prices might be smaller than assumed in the projections, as importers might be less willing to pass on lower costs to consumers owing to downward price rigidities, especially given robust domestic demand and the appetite of firms to rebuild their profit margins. More generally, it was contended that the economy was proving more resilient than had been expected, which made a sustained undershooting of inflation increasingly unlikely. It was also argued that tariffs would be inflationary, rather than disinflationary, in staff simulations if the projection models took production networks into account. Upward price pressures could be reinforced if a fragmentation of global supply chains pushed up import prices and added to capacity constraints in the domestic economy, while it was contended that the impact on euro area inflation from trade re-routing was likely to be limited given that there had been no material decline in prices for imports from China to date. Beyond tariffs, migration policies and fiscal expansion could add to inflationary pressures in the United States and, if these risks materialised, the euro area was unlikely to be immune from inflationary spillovers. Geopolitical escalation could also re-intensify supply chain pressures and tended to be inflationary according to a recent research paper by Caldara et al. Extreme weather events and transition policies that affected farming, as well as the unfolding climate and nature crisis more broadly, could drive up food prices by more than expected. Finally, the fiscal expansion could have a stronger impact on inflation if the economy were to hit capacity constraints, which could happen sooner than expected, and inflation could also be higher if defence and infrastructure spending were greater than anticipated in the baseline projections.
Turning to underlying inflation, members concurred that the standard measures remained consistent with the 2% medium-term target. They were generally close to, although still above, 2%, and did not point to any significant deviations from target in either direction. Inflation excluding energy and food was expected to fall from 2.4% in 2025 to 1.9% in 2026 and 1.8% in 2027, owing to the stronger euro and declining labour cost pressures. Year-on-year growth in compensation per employee had been declining and forward-looking indicators suggested that wage growth would moderate further. Along with productivity gains, this would help to keep a lid on domestic price pressures, even as profits recovered from low levels. At the same time, in light of the ongoing recovery with robust domestic demand and a closing output gap, it was argued that disinflationary pressures on core inflation were unlikely, given that the tight labour market and low unemployment levels expected over the coming years could result in higher wage pressures as the cyclical recovery took hold. Wages might also decelerate more slowly than expected owing to demographic factors that would make labour increasingly scarce. These factors could pose an upside risk to domestic and services inflation. More generally, if the output gap were to close more quickly than projected, there would be upward pressure on underlying inflation. On the other hand, any softening of the labour market could reduce wage pressures further.
Finally, the transmission of monetary policy continued to be smooth. Past interest rate cuts and the associated easing of financing conditions had supported the recovery of credit and domestic demand since mid-2024, although these interest rate cuts were yet to have their full impact, with some transmission remaining in the pipeline. Therefore, transmission was likely to remain smooth, with consumer spending and investment expected to continue benefiting from past interest rate cuts feeding through to financing conditions. Reduced uncertainty and somewhat higher confidence in the last few weeks could also help to support the transmission of lower interest rates to the real economy.
Monetary policy decisions and communication
Against this background, all members supported the proposal made by Mr Lane to keep the three key ECB interest rates unchanged. The new staff projections had presented a picture of inflation similar to the one projected in June and the Governing Council’s assessment of the inflation outlook was broadly unchanged. In particular, the incoming data since the July meeting had confirmed that the inflation outlook continued to be in a good place and that the domestic economy remained resilient, with risks to economic growth now more balanced. There was therefore no immediate pressure to change policy rates at the current meeting. The environment remained more uncertain than usual, especially because of the still volatile global trade policy environment but also owing to geopolitical developments. Such uncertainty could also justify keeping interest rates unchanged. In particular, the current situation was likely to change materially at some point, but it was currently difficult to know when and in which direction. Maintaining policy rates at their current levels would allow more time to assess the effects of tariffs, ongoing uncertainties and the other risk factors that the Governing Council had discussed, even if these risks would not all fade away. It was also argued that the current level of interest rates should be seen as sufficiently robust in managing shocks, in view of two-sided inflation risks and taking into account a broad range of possible scenarios. Overall, there continued to be a high option value to waiting for more information.
With regard to communication, members reiterated that the Governing Council was determined to ensure that inflation would stabilise at its 2% target in the medium term. Future interest rate decisions would continue to be based on its assessment of the inflation outlook and the risks surrounding it, in light of the incoming economic and financial data, as well as the dynamics of underlying inflation and the strength of monetary policy transmission. The Governing Council would also continue to follow a data-dependent and meeting-by-meeting approach to determining the appropriate monetary policy stance without pre-committing to a particular rate path.
With the outlook for inflation more uncertain than usual and with the risk of large inflation and growth shocks in both directions, it was important for the Governing Council to maintain full optionality for future meetings and be agile to react quickly to large shocks if necessary. Communication should maintain a careful, neutral tone and remain non-committal about future interest rate decisions.
Looking ahead, the upcoming months would be important for carefully assessing new data and evidence on how recent shocks were affecting the inflation and growth outlook. In this respect, it was argued that the monetary policy stance should not be fine-tuned in response to moderate fluctuations of inflation around the target but only adjusted if a significant deviation was expected over the medium term. At the same time, the types of large, sustained deviations of inflation from target in both directions seen over the last decade were atypical, rare events. So, it was also argued that there was still a need for a cyclical response from monetary policy to deal with demand-side shocks on an ongoing basis, as also reflected in standard monetary policy models.
Taking into account the foregoing discussion among the members, upon a proposal by the President, the Governing Council took the monetary policy decisions as set out in the monetary policy press release. The members of the Governing Council subsequently finalised the monetary policy statement, which the President and the Vice-President would, as usual, deliver at the press conference following the Governing Council meeting.
Monetary policy statement
Monetary policy statement for the press conference of 11 September 2025
Press release
Meeting of the ECB’s Governing Council, 10-11 September 2025
Members
- Ms Lagarde, President
- Mr de Guindos, Vice-President
- Mr Centeno
- Mr Cipollone
- Mr Dolenc, Deputy Governor of Banka Slovenije
- Mr Elderson
- Mr Escrivá
- Mr Kazāks*
- Mr Kažimír
- Mr Kocher
- Mr Lane
- Mr Makhlouf
- Mr Müller
- Mr Nagel
- Mr Panetta
- Mr Patsalides*
- Mr Radev**
- Mr Rehn
- Mr Reinesch
- Ms Schnabel
- Mr Scicluna
- Mr Šimkus
- Mr Sleijpen*
- Mr Stournaras*
- Mr Villeroy de Galhau
- Mr Vujčić*
- Mr Wunsch
* Members not holding a voting right in September 2025 under Article 10.2 of the ESCB Statute.
** As observer.
Other attendees
- Mr Dombrovskis, Commissioner***
- Ms Senkovic, Secretary, Director General Secretariat
- Mr Rostagno, Secretary for monetary policy, Director General Monetary Policy
- Mr Kapadia, Head of Division, Directorate General Monetary Policy
*** In accordance with Article 284 of the Treaty on the Functioning of the European Union.
Accompanying persons
- Ms Bénassy-Quéré
- Mr Boeckx
- Ms Brezigar
- Mr Demarco
- Mr Horváth
- Mr Kaasik
- Mr Koukoularides
- Mr Kroes
- Mr Lünnemann
- Ms Mauderer
- Ms McKiernan
- Mr Nicoletti Altimari
- Mr Novo
- Mr Nuño
- Mr Šiaudinis
- Mr Šošić
- Ms Stiftinger
- Mr Tavlas
- Mr Välimäki
- Mr Vilerts
Other ECB staff
- Mr Proissl, Director General Communications
- Mr Straub, Counsellor to the President
- Ms Rahmouni, Director General Market Operations
- Mr Arce, Director General Economics
- Mr Sousa, Deputy Director General Economics
Release of the next monetary policy account foreseen on 27 November 2025.