
Sample Category Title
NZ BNZ manufacturing flat at 49.9, firms cite soft demand and rising costs
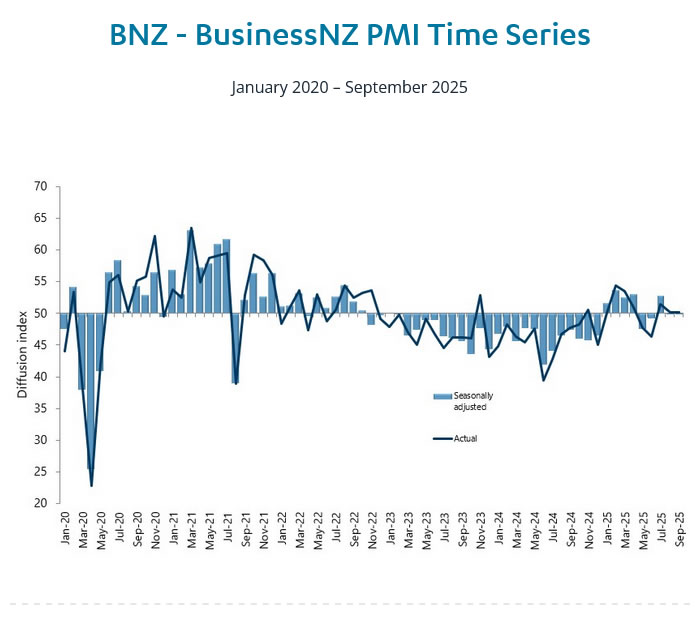
New Zealand’s BNZ Performance of Manufacturing Index held steady at 49.9 in September, marking another month of contraction and remaining below its long-term average of 52.4.
The data highlighted a mixed picture across key components — production edged up from 47.8 to 50.1, barely returning to expansion, while employment dropped from 49.1 to 47.5, weighing on the overall index. New orders also slipped from 54.7 to 50.3, suggesting softening demand momentum.
BusinessNZ Director of Advocacy Catherine Beard said it was encouraging that the PMI did not show deeper contraction, but the sector remained “agonizingly close to returning to expansion mode.” She added weakness in employment prevented the headline figure from crossing the 50 threshold.
Survey respondents continued to highlight muted customer demand and rising cost pressures, with 60% of comments negative, up from August. Manufacturers reported lower order volumes, tight margins, and competitive pricing pressures, reflecting both domestic uncertainty and subdued export demand.
Fed’s Barr sees need for caution, notes stronger spending and sticky inflation
Fed Governor Michael Barr said in a speech overnight that monetary policy remains “modestly restrictive”, and supported the decision to lower the federal funds rate by 25 bps at the September meeting. He said the move brought the stance “a bit closer toward neutral,” but emphasized that further adjustments should depend on new data and the evolving balance of risks.
Barr noted that since the September meeting, consumer spending has surprised to the upside, with data showing activity on a “notably stronger trajectory” than previously thought. That, he said, prompted most observers to revise up forecasts for GDP growth through the remainder of the year. Inflation, meanwhile, “moved up as expected,” with core PCE remaining well above the 2% target.
The Fed governor cautioned that “considerable uncertainty” continues to cloud the outlook. Slower payroll growth could be a “harbinger of worse to come,” he said, though it might also stabilize given the low unemployment rate and solid growth backdrop. On inflation, he warned that tariffs could have only a modest effect on prices—or, conversely, trigger renewed price pressures if expectations begin to rise.
Barr concluded that the FOMC should remain “cautious” about adjusting policy until more evidence clarifies the direction of the economy. “If we see inflation moving further away from our target, it may be necessary to keep policy at least modestly restrictive for longer,” he said. “If we see heightened risks in the labor market, we may need to move more quickly to ease policy.”
They’ll Go with the (Data) Flow
The RBA has almost certainly not yet decided whether or not to cut the cash rate in November. The data flow from here will determine the outcome, with hesitation now likely to result in more cuts later.
- There is still enough data to come before the next RBA meeting to justify a November cut, even though currently available information would suggest a hold is more likely.
- Some recent data on inflation and household spending may contain less signal about the outlook for subsequent quarters than the RBA’s September communication seems to imply. A hold in November could be followed by a downside inflation surprise in the December quarter and a cash rate cut in February, similar to the flow of surprises in late 2023 and early 2024.
- If the RBA does hold the cash rate steady at the November meeting, the chance increases that it cuts in February and ends up at a trough of 2.85% rather than something higher.
It’s almost certain that RBA has not yet decided whether or not to cut the cash rate at its November meeting. If the meeting were held today, they would keep rates on hold, awaiting further data. Several potentially decisive data releases are due before the actual meeting, though, including the September labour data and the full quarterly CPI. Until then, we need to hold two possible futures in mind: hold or cut.
The August CPI indicator did imply an ugly result for the September quarter. Our own nowcast for the trimmed mean measure is a ‘big’ 0.8%qtr that could easily round up to a 0.9%, a result that would surely stay the RBA’s hand. Looking at the detail, though, outside home-building costs it is not clear that the August data provided much signal of an ongoing higher rate of inflation than expected. As we noted at the time, the result in market services was mixed, with some personal services inflation below our forecasts while the cost of eating out was stronger. The latter suggests that, following a period of retrenchment in hospitality (evident in the labour account employment data), improving conditions have allowed for some margin repair. Some of the price gains may also indirectly relate to recent annual award wage increase; though this is a normal seasonal effect, its size will depend on how margins react. Neither of these influences on price growth are likely to be sustained if demand remains patchy.
We therefore think the economy could be in for something like a re-run of late 2023, when an upside surprise in September quarter inflation was followed by a downside surprise (to something more like our own near-cast) in the December quarter. The result was a hike in late 2023 followed by an ‘on-the-fly’ pivot following the February 2024 meeting – from flagging possible further hikes in the post-meeting statement to ‘not ruling anything in or out’ in the media conference. That message landed a lot better, and sure enough, the next move was, eventually, a cut.
We are also mindful of the two-sided risks around both the labour market and household spending data. We will know more about the labour market shortly when the September monthly labour force data is released next week, completing the picture for the quarter. So far, we see a gradual softening in employment growth as demand pivots away from the jobs-rich ‘care economy’. The unemployment and underemployment consequences of this are being masked by an unwind in the extra labour supply induced by earlier cost-of-living pressures. With demographic drivers still implying an upward trend in labour force participation, we see more latent labour market slack emerging over time and weighing on wages growth and inflation. There is precedent for this outcome in Australia’s experience in the late 2010s.
On household spending, the August Household Spending Indicator, released after the September RBA Monetary Policy Board (MPB) meeting, was notably below market expectations. This accords with our assessment that the expected recovery in consumer spending has been patchy and that the strength in national accounts consumption in Q2 partly reflected some one-off factors such as insurance payouts and the unwinding of some electricity rebates. Though we see two-sided risks around the consumption outlook, the more downbeat tone from consumer sentiment in recent months certainly suggests that underlying momentum is still subdued. Given how weak real household incomes have been for a number of years, this ongoing pessimistic tone does not surprise us.
Recall also that a recovery in household spending is necessary to counterbalance the slowdown in public sector demand growth that is already underway. Faster growth in household spending should only stay the MPB’s hand from further rate cuts if the pick-up is stronger than implied by the RBA’s August forecasts. These were constructed on an assumption of a couple more cash rate cuts, as the market was pricing at the time. Far too many observers are in the habit of seeing any pick-up in demand or housing prices as something for policy to react against, rather than as the expected and intended transmission of monetary policy. The Governor’s comments at the latest media conference show that the RBA, at least, does understand the difference.
The rates outlook boils down to the issue of how much signal to take from an upside surprise in one quarter in terms of what that means for subsequent quarters. RBA Governor Bullock has on several occasions insisted that ‘we will be guided by our forecasts’. However, that statement sits a bit uncomfortably with the flat profile for the RBA’s trimmed mean inflation forecasts and the unemployment rate. These give the impression of a set of forecasts being used as a communication device to explain and frame a policy decision rather than an independent input into that decision. This is understandable and perhaps inevitable given the judgement involved in synthesising the output of many different models and information sources. However, it does hold the risk that the policy view helps shape the forecast rather than the other way around.
What’s left in these circumstances is reactivity to incoming data – that is, to the recent past. As well as making policy less predictable – contrary to the MPB’s stated intentions – it is not a great way to run an economy policy setting that affects the economy with a lag, especially when inflation has been within the target range for a little while now at the same time as policy is likely still restrictive.
Bottom line: the odds that the RBA cuts in November are, at this point, below 50% but still a long way from zero. The data flow could change things again. Frankly, the prospect of flip-flopping a ‘call’ as the month goes on is unattractive, especially when it is quite obvious that the policymakers have not made up their mind yet. We must hold the two possibilities in mind at least until the labour market data come in. (A good-enough labour market result would make it unlikely that the RBA would cut, even if the September quarter CPI comes in a little more benign than we currently expect.)
The RBA communications schedule has half a dozen speeches between now and the November meeting that will be opportunities for it to provide guidance on some of its key forecast judgements, though they all pre-date the release of the September quarter CPI. If the RBA does hold in November, though, our conviction that they end up cutting in February rises, as does our expectation that the trough will be 2.85% rather than something higher. The more the MPB hesitates in the face of uncertainty, the more likely it is that domestic inflation pressures surprise it on the downside next year, and trimmed mean inflation turns out more like the Westpac Economics forecast than the August RBA one.
Cliff Notes: Risks to the Downside
Key insights from the week that was.
In Australia, the only update of note this week was October’s Westpac-MI Consumer Sentiment Survey, which ultimately disappointed with a –3.5% decline to 92.1. Combined with last month’s fall, all gains over May to August have been erased and sentiment is now back into outright pessimistic territory. The most recent fall appears to be largely a consequence of renewed fears over the cost-of-living following the latest stronger-than-expected inflation update.
This looks to have fed through to households’ opinions on family finances. Both sub-indexes tracking current views and expectations deteriorating sharply back below long-run averages (–4.8% and –9.9% respectively). This coincided with the lift in expectations around mortgage interest rates. That said, while some consumers appeared to be ‘bracing for the worst’ as far as last week’s RBA’s decision was concerned, the Board’s non-committal and cautious language accompanying the decision went some way towards calming these fears. On the economy, consumers have become more downbeat on the year-ahead outlook (–2.5%) but remain fairly agnostic on the medium-to-longer term outlook (+1.4%).
Against this backdrop, consumers’ spending intentions remain a clear laggard in the survey detail. At 97.2, the ‘time to buy a major household item’ sub-index is some 21% below long-run average levels. This strikes a similar tone to official household spending data which is pointing to a more modest recovery following a solid showing in Q2 (which was buoyed by temporary factors including insurance payouts, abnormal seasonality, and EOFY sales). Going forward while a recovery is clearly underway, households’ ‘value-conscious’ attitude suggests that underlying momentum is still subdued. As a result, spending growth may remain patchy over the coming months and quarters.
This implies that the projected recovery in household spending is unlikely to be a decisive factor in the RBA’s near-term policy decision. Instead, as Chief Economist Luci Ellis highlights in this week’s essay, attention will be focused on upcoming labour market and inflation data ahead of the RBA’s November decision – the RBA has almost certainly not yet decided whether or not to cut the cash rate in November with these updates set to be the big deciding factor.
Offshore, the US government failed to reach an agreement on spending extending the shutdown and continuing to disrupt the release of official data. Consequently, attention was focused on the minutes of the FOMC’s September meeting.
The minutes struck a balanced tone with members highlighting both upside risks to inflation and growing downside risks to employment. The decision to cut rates by 25bps was motivated by weaker labour market conditions which also led them to "no longer characterize labor market conditions as solid". Though downside risks were emphasised, the FOMC also affirmed they did not see a sharp deterioration in labour market conditions and that softer job gains were a function of both labour demand and supply, the latter reflecting the impact of fewer migrants. The view on inflation was more encouraging with the minutes noting that "excluding the effects of this year’s tariff increases, inflation would be close to target" and that they "perceived less upside risk to their outlooks for inflation than earlier in the year". While concerns around inflation had subsided, the committee continues to expect an increase in inflation in the near-term and are attuned to how this is being transmitted into inflation expectations. We anticipate the FOMC will cut the federal funds rate once more this year, consistent with their view that " it likely would be appropriate to ease policy further over the remainder of this year".
Closer to home, the Reserve Bank of New Zealand cut its OCR by 50bps, a move that was out of consensus with the market but anticipated by our New Zealand colleagues. The Committee's concern around excess capacity motivated the larger move though a 25bp cut was also considered. Forward guidance provided in the Media Release suggests further reductions are likely, we expect a 25bp cut in November. Further details on RBNZ's announcement can be found here.
Elliott Wave Forecast for Bitcoin (BTCUSD) – Don’t Miss the Buyers Zone
Hello traders. As our members know, we’ve been long in BTCUSD . The crypto has made a solid rally toward new all-time highs, gaining more than 20% since our entry on the June 22nd. In this technical article, we are going to present short term Elliott Wave forecast of Bitcoin.
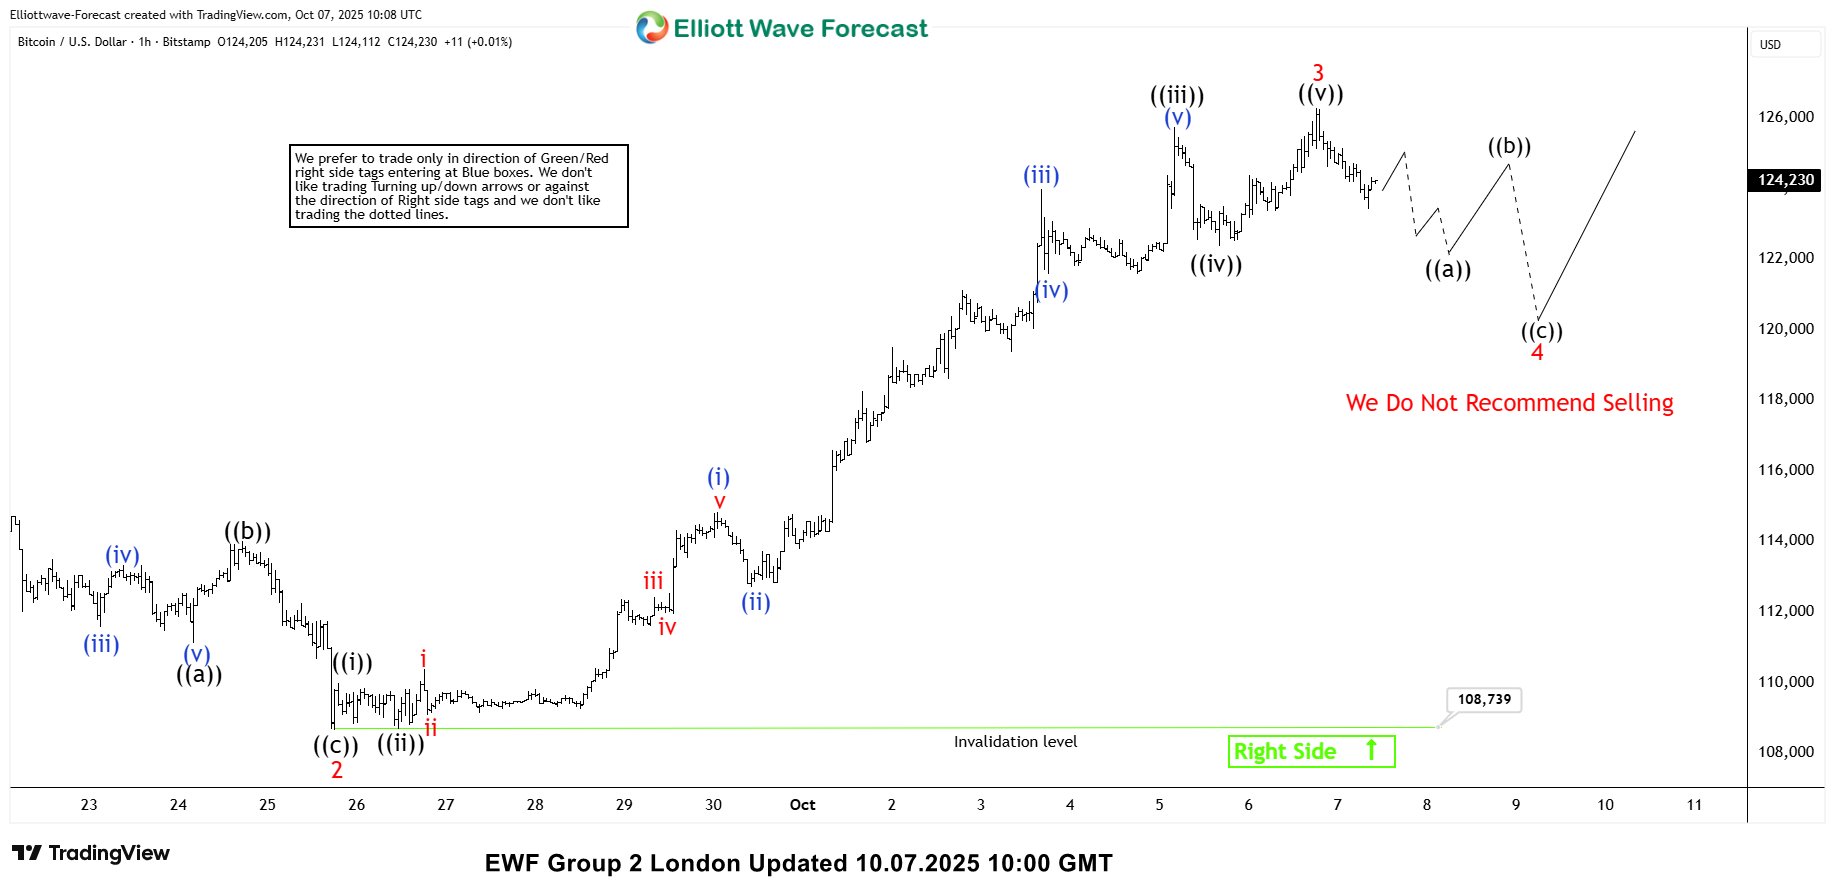
BTCUSD Elliott Wave 1 Hour Chart 10.07.2025
The current view suggests that Bitcoin is undergoing a correction against the 108,739 low. The cycle from that low unfolded in a clear 5-wave structure, completing at 126,237. While below this high, we expect to see a 3-wave pullback in wave 4 red before the next rally resumes.
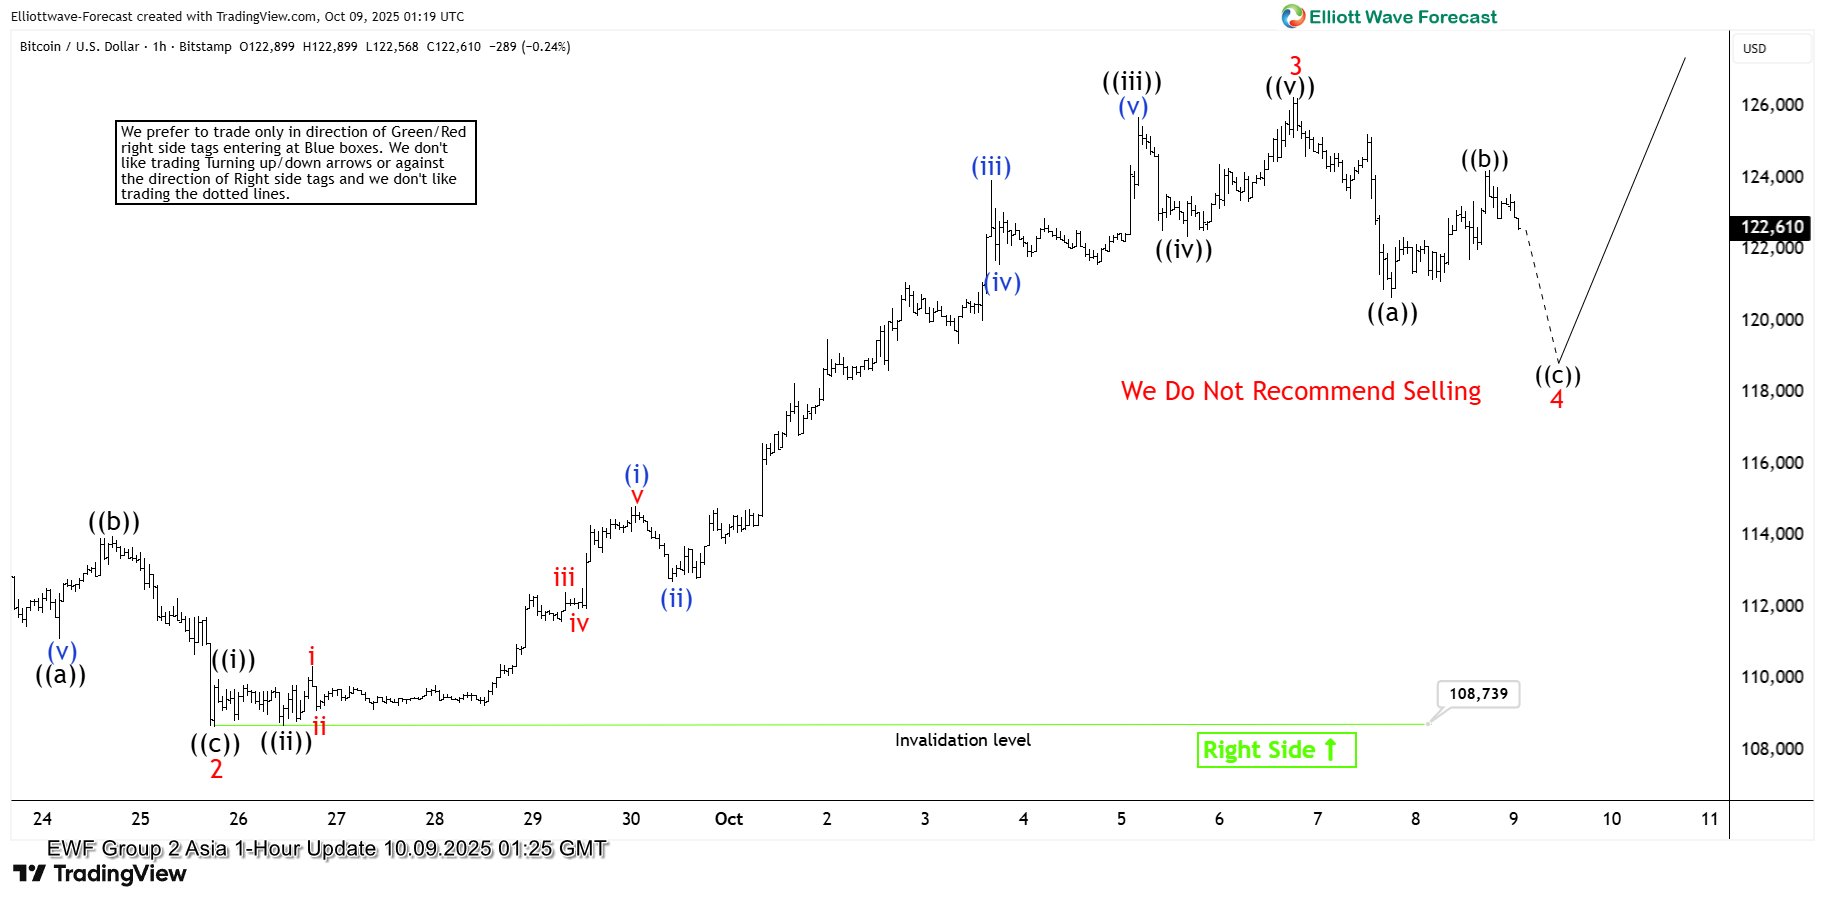
BTCUSD Elliott Wave 1 Hour Chart 10.09.2025
The pullback unfolded in 5 waves down from the peak, which is considered the first ((a)) leg of a potential Zigzag pattern. This was followed by a 3-wave bounce in the ((b)) leg. While below 124,203, we consider wave ((b)) complete and are now calling for a move lower in wave ((c)), targeting the 118,681–115,250 area (buying zone). In this area, we expect buyers to appear for either a further rally or at least a 3-wave bounce.
How Investors and Traders Can Gauge US Labor Market amid BLS Shutdown
The US government shutdown, which began at midnight on October 6, shows no sign of ending soon — and many now expect it could at least become the second-longest in US history.
Despite six Democratic attempts to pass a funding bill, the Senate has repeatedly rejected proposals to reopen the government.
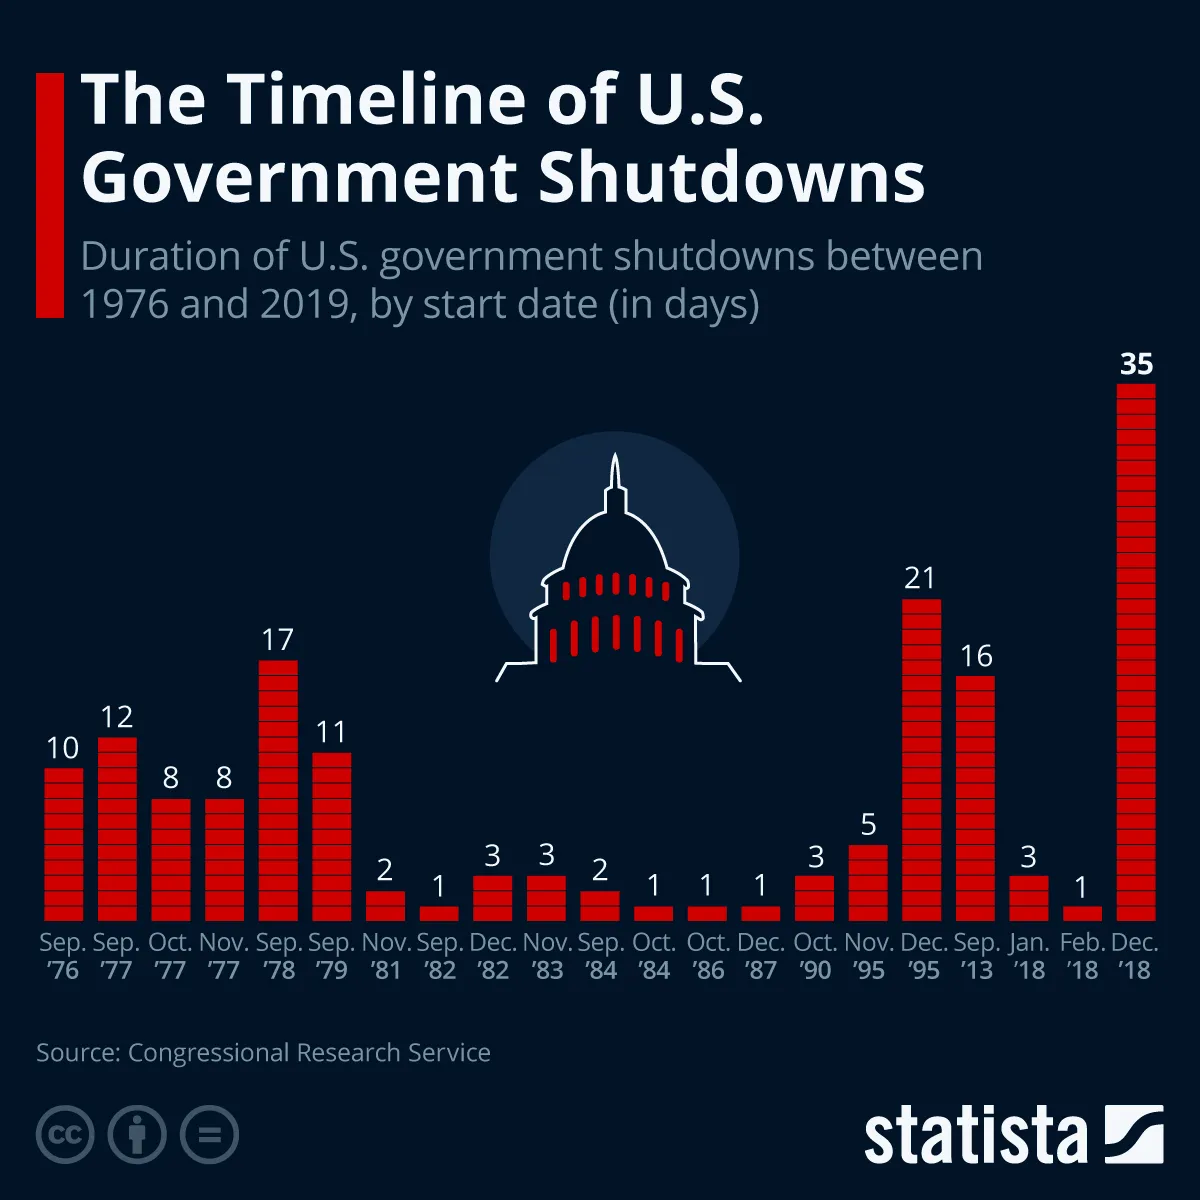
Length of the different US Government shutdowns – Source: Statista - Reposting of the graph published in our October 2 Market Wrap
The current shutdown has been ongoing for nine days already – The length of it already surpasses 14 of the previous ones, with some lasting only one day, like during the 1980s.
There are, however, faint hopes for a resolution, with growing pressure from agencies, unions, and private-sector partners potentially pushing lawmakers to reach a deal in the coming weeks.
Because of the ongoing shutdown, even Marco Rubio, one of the US top diplomats, will not be able to attend the Paris meeting about the future for Gaza, as peace in the Middle East comes closer.
For now, the impact on economic visibility is clear. With most “non-essential” government functions halted, the Bureau of Labor Statistics (BLS) — responsible for the Non-Farm Payrolls (NFP) and Weekly Jobless Claims — is temporarily closed.
This leaves traders and analysts without two of the most critical labor market indicators.
So, where can investors look to fill the data gap and gauge the health of US employment while the shutdown persists? Let's discover this just below.
Private data makes a comeback
Private surveys provide valuable insight into the US labor market.
While they typically move markets less than official BLS data, they’re now attracting increased attention amid the government shutdown.
The most widely followed — and most market-moving — is the ADP Private Employment Report, which recently showed a decline of 32,000 jobs. It is getting more attention, particularly as it provides a seemingly more precise picture (when looking at the huge revisions from BLS data in 2025).
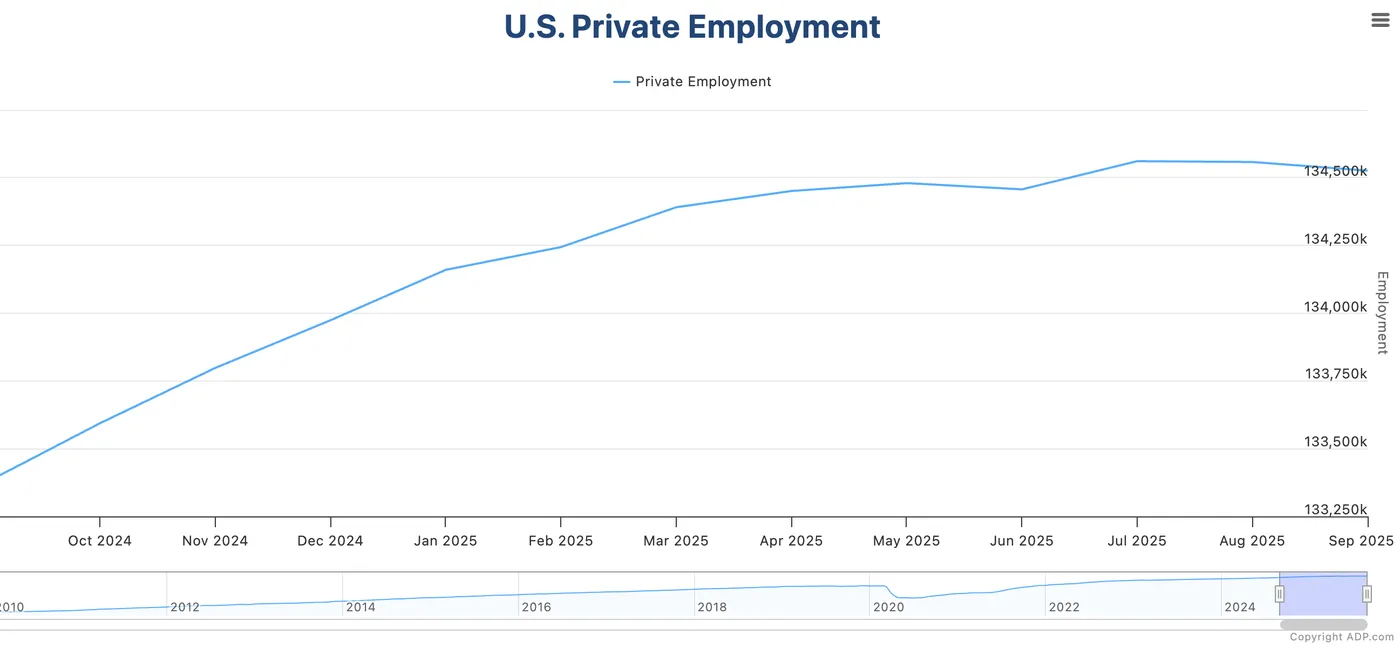
ADP Private Employment in the past 12 months, starting to plateau – Source: ADP Employment
Other indicators help to fill the gap: the Challenger Job-Cut Report offers a monthly look at layoffs, while the Gallup Job Creation Index (released quarterly, so not very timely) gives a sentiment-based measure of hiring conditions.
The ISM Manufacturing and Services PMIs also include employment sub-indexes, offering additional clues about job trends across sectors.
Even private institutions have stepped up their data releases — for instance, a Bank of America survey showed slower job growth and rising claims despite steady wage gains, and Carlyle Group estimated that the US added just 17,000 jobs in September.
While the ADP report remains the benchmark among these alternatives, this period could see new private datasets gain prominence — especially those that prove more consistent or predictive of official labor trends once BLS operations resume.
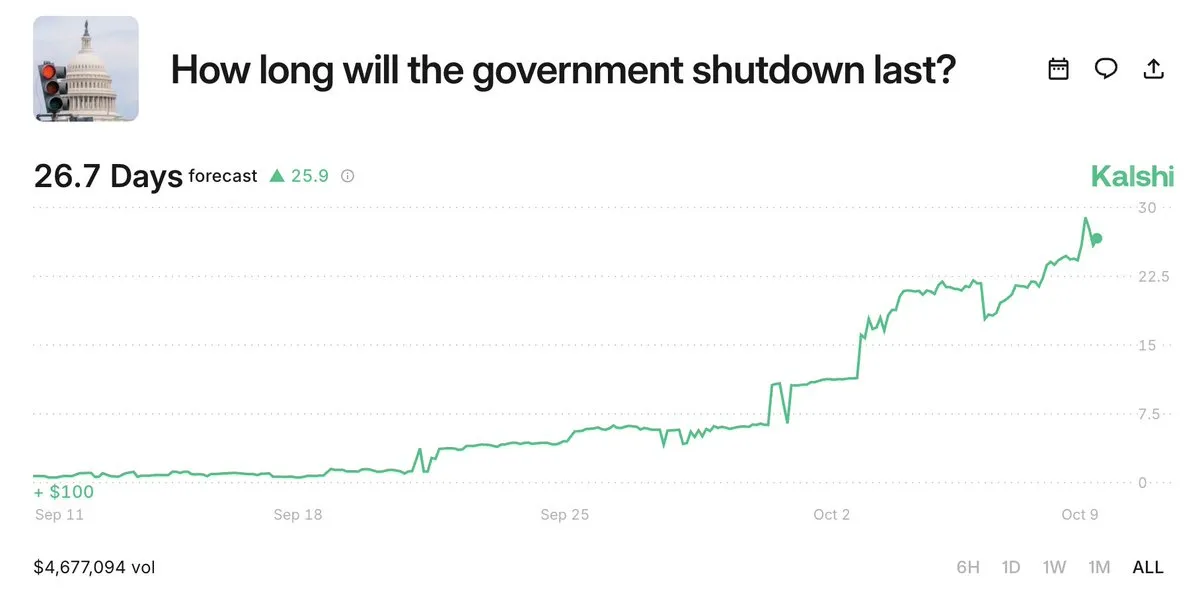
Prediction-Markets Shutdown length expectations, October 9, 2025 – Source: Kalshi
Public data also isn't done yet
Public data isn’t totally absent when assessing the US labor market — a few key Federal Reserve surveys continue operating even during the shutdown.
These surveys offer timely snapshots of employment trends across various districts, providing indirect but valuable clues about hiring and job stability.
The New York Fed’s Empire State Manufacturing Survey (the most market-moving) and the Philadelphia Fed’s Manufacturing Business Outlook Survey ask firms whether employment and work hours are rising or falling, giving an early read on hiring momentum in the Eastern US.
The Richmond Fed runs manufacturing and service sector surveys, where companies report payroll changes and labor availability.
Further west, the Kansas City Fed’s Tenth District surveys and the Dallas Fed’s Texas Manufacturing and Service Outlooks measure shifts in employment and wages through monthly questionnaires sent to local businesses.
Though these regional reports vary in scope, their employment sub-indices tend to move consistently with national labor data, making them valid proxies until the Bureau of Labor Statistics resumes regular publication.
Individual Fed regional presidents tend to mention these studies when they appear, which helps them assess their own decision-making during FOMC meetings.
Too Long, Didn't read – What data releases should I focus on as a trader
Private Surveys:
- ADP Private Employment (released monthly)
- Challenger Job Layoffs
- Employment Sub-Indexes from the ISM PMI data
- Bank surveys like those offered from the Bank of America
Public Surveys, mostly from the Federal Reserve
- New York Fed’s Empire State Manufacturing Survey
- Richmond Fed's Manufacturing Survey
Markets don't seem to care too much about the shutdown, at least for now
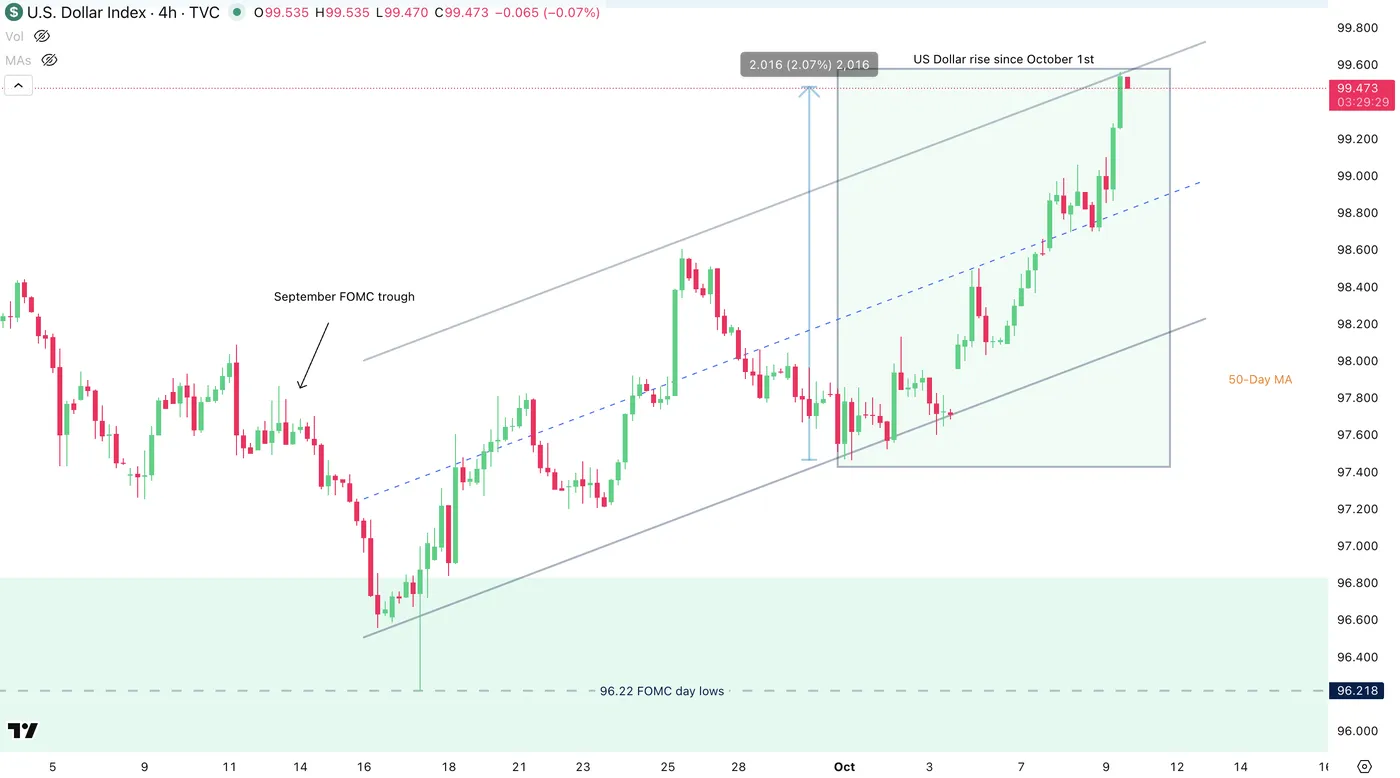
US Dollar Index (DXY) 4H Chart, October 9, 2025 – Source: TradingView
The US Dollar is up 2% since October 1st, not showing the slightest care.
Even legendary traders and Hedge Fund managers like Citadel's Ken Griffin repeat that the shutdown will have no material impact for Markets.
Still, Markets start to react when nobody seems to care anymore, so keep your eyes open.
Safe Trades!
An Unusual Pattern Emerges in NZD/USD After 50 bps Cut
The New Zealand Dollar has been under heavy pressure in recent weeks, weighed down by a string of disappointing economic data, including a sharp GDP contraction that surprised markets and pushed the RBNZ toward a more dovish stance.
But markets often move in unexpected ways.
Despite the policy decision being split between a 25 bps and 50 bps cut, and the RBNZ ultimately choosing the larger move, NZD/USD didn’t tumble as far as expected.
In fact, buyers stepped in, bringing the pair back to nearly unchanged levels by the close of yesterday's session.
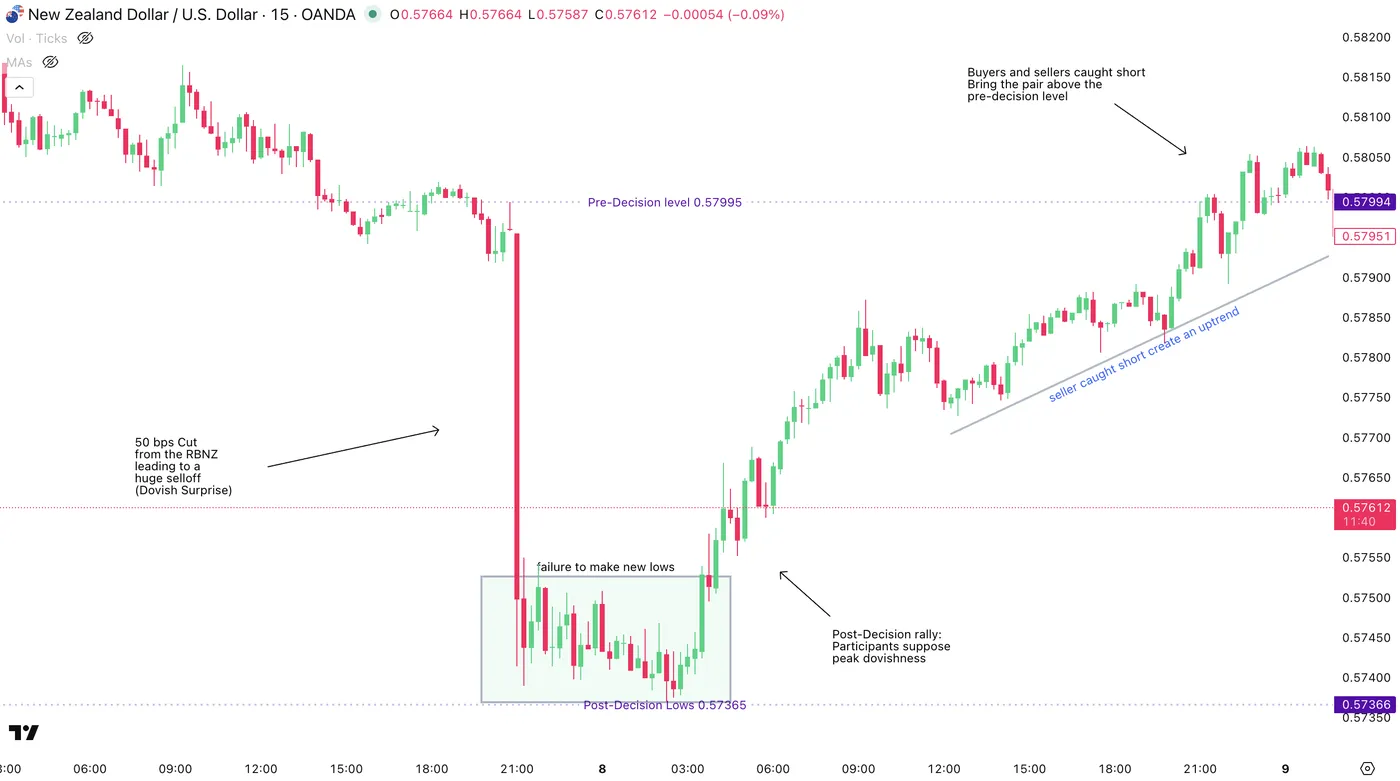
NZD/USD Intraday 15m Chart – October 9, 2025 – Source: TradingView
So, what explains this counterintuitive reaction?
Markets are forward-looking — a larger cut today reduces the need for aggressive easing later, prompting traders to reassess what might have been peak dovishness.
In other words, Participants assess that the RBNZ will have less to do from here.
A look at the following Rate pricing for the RBNZ
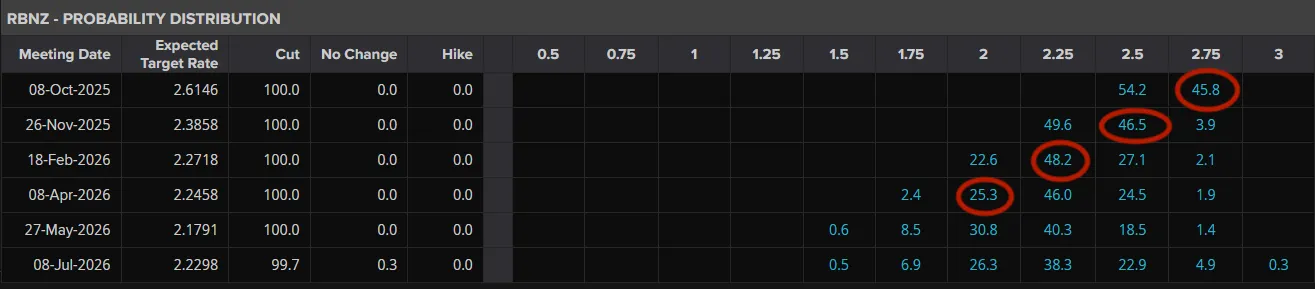
Pre-RBNZ Rate Cut pricing – October 7, 2025 – Source: LSEG
A 25 bps cut would have led to a longer rate cut path: A 2% Neutral Rate would have been reached in April 2026, taking the New Zealand economy longer to recover.
The red circles follow a 25 bps, slower rate cut path.
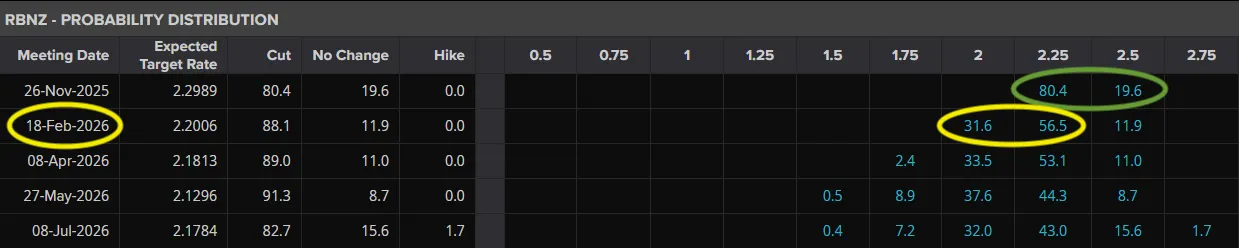
Post-50 bps cut RBNZ Pricing – October 9, 2025 – Source: LSEG
The new pricing shows that the cut cycle is priced to end in February 2026 – Hence, faster recovery for the New Zealand economy.
Sellers now aim to test yesterday's lows to see if the yearly bottom has been found after failing yesterday.
We’ll now look at NZD/USD key levels to see where is the current bottom and if a new one could then emerge.
NZD/USD 2H Chart and levels
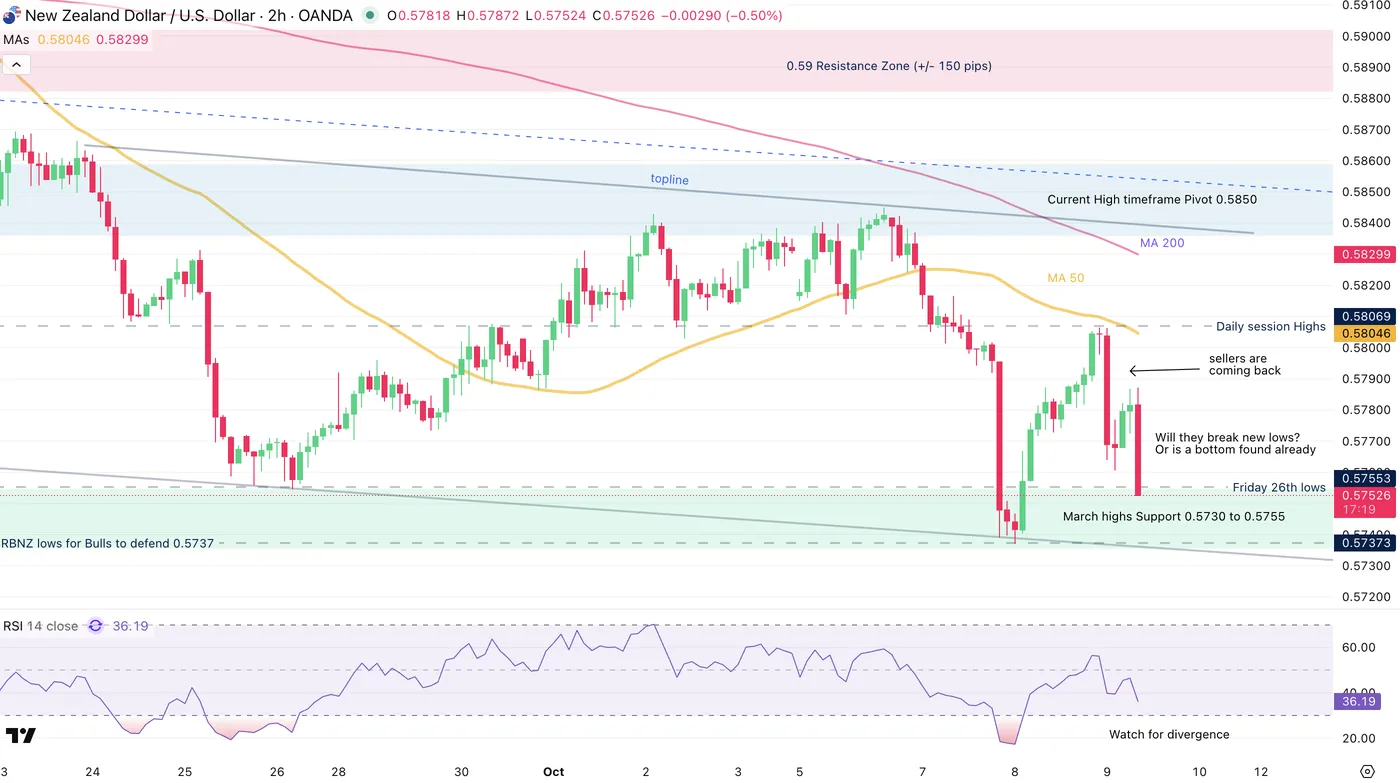
NZD/USD 2H Chart, October 9, 2025 – Source: TradingView
Amid a US Dollar rebound, sellers have found a place to sell the pair after re-testing the 4H 50-period Moving Average.
Will the pair reach new lows, or has a bottom been found after the Jumbo rate cut?
This marks key breakout points to follow for the pair:
A break above the daily highs (0.58070) should confirm the intermediate bottom.
A downside break would imply further weakness in the NZD is expected.
Levels to keep on your NZD/USD charts:
Support Levels:
- March highs Support and Channel lows 0.5730 to 0.5755
- Yesterday lows for Bulls to defend 0.5737
- 0.5650 March Lows Support
- 0.56 Psychological Level
Resistance Levels:
- Session highs and breakout level: 0.58070
- Current High timeframe Pivot 0.5850, topline and MA 200
- 0.59 Main Resistance Zone (+/- 150 pips)
Safe Trades!
Dow Jones Technical Outlook: Dow Tests Key Confluence Level. Is Another 500 + Point Slide Incoming?
The Dow Jones Index is on the back foot today continuing its bearish trend this week which started with Monday's retreat from the recent highs.
The lack of US data due to the US government shutdown has left markets with few catalysts to look forward to. A host of Federal Reserve policymakers including Fed Chair Powell have also done little to inspire any volatility this week.
Looking at the current Fear and Greed index, and it is hovering in neutral territory as well.
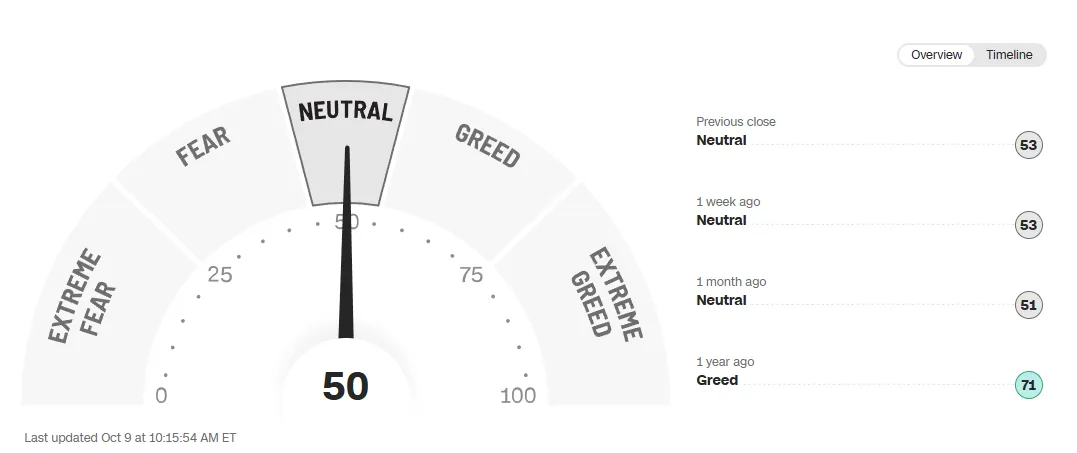
Source: FinancialJuice
Given the current malaise we are seeing in US stocks this week and with the lack of US data releases the technicals and chart patterns that develop tend to be more reliable. Let us take a look at what the Dow Jones chart and technicals are telling us.
Technical Outlook - Dow Jones, S&P 500
From a technical standpoint, the Dow Jones Index on the four-hour chart below has been printing lower highs and lower lows since Friday October 3.
The period-14 RSI has also crossed below the 50 neutral level hinting at a shift in momentum from bulls to bears.
As things stand, price is at a key confluence level around the 46660 mark which was the swing low on October 2 and holds the 100-day MA.
A break of this level could lead the Dow Jones index to decline some 500 points to test the 200-day MA which rests at 46143 with a move beyond that opening up a retest of the psychological 45000.
If the Dow finds support at this confluence level, immediate resistance rests at 46900 before the swing highs at 47050 and 47160 come into focus.
Dow Jones Four-Hour Chart, July 16, 2025

Source: TradingView (click to enlarge)
If the Dow does drop, the move may not be a big one. History suggests the current bull market may still have room to run despite Wall Street's impressive performance over the last few years. Let us take a look.
History Suggests Bull Market May Have More Upside Potential
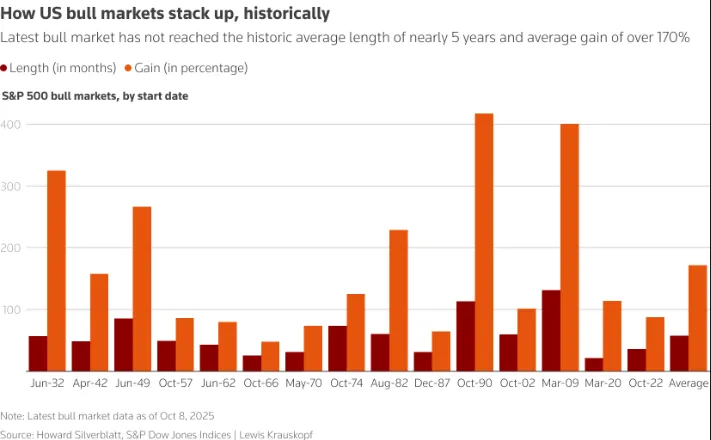
The current upward trend, or "bull market," in the U.S. stock market is nearly three years old, but historical patterns suggest it might only be halfway through its lifespan.
This bull market officially began on October 12, 2022, when the S&P 500 index hit its lowest point after a period of interest rate hikes by the Federal Reserve. Since then, the index has been soaring, recently hitting a series of record highs, driven primarily by a massive surge in large technology stocks. The S&P 500 is up almost 90% since its 2022 low.
However, this gain is still less than the historical average increase of over 170% for past bull markets, which have typically lasted about five years. Interestingly, the market's performance over the past year (its third year) has been very strong, with a gain of over 15%, marking the strongest third-year performance of any bull market since 1957.
Source: LSEG
Despite the overall strong performance, the market's gains have been very concentrated. While the standard S&P 500 is up nearly 90%, the equal-weight S&P 500 (which shows the performance of the average stock, not just the biggest ones) has only risen 49%. This difference shows that only the largest "megacap" stocks are truly driving the headline index higher.
Some investors are now hopeful that when the Federal Reserve begins to cut interest rates, it will broaden the rally and allow smaller, average stocks to finally catch up.
Now of course this is looking at the S&P 500 but one cannot ignore the knock on impact it has on Wall Street as a whole. The correlation between the S&P500, Nasdaq 100 and the DOw Jones index during the current bull run have been there for all to see. This leaves me thinking that even if there is a lag, the Dow will also benefit from further gains should this bull rally extend for another two years.
Fed’s Williams sees lower rates this year, tariff impact on inflation as limited
New York Fed President John Williams said in an interview with The New York Times that he still expects interest rates to be lower by year-end, but emphasized that the pace and extent of easing will depend on incoming data.
When asked about the possibility of two additional 25bps reductions, Williams said that would depend on whether inflation and employment evolve broadly in line with his outlook. He expects inflation to "move up a bit to around near 3%" and unemployment to edge slightly higher, in which case “policy should evolve the way we expect.”
But he warned against complacency, noting that it would be “very damaging to the economy and the Fed’s credibility” if inflation were allowed to rise well above 2% without action.
Williams downplayed fears that President Donald Trump’s tariffs were fueling persistent inflation. He estimated the measures have lifted the price level by only 0.25 to 0.5 percentage point, adding that “underlying inflation seems to be moving gradually lower toward 2%.” He also said there were no signs of second-round effects, suggesting tariffs are having limited spillovers on broader price dynamics.
At the same time, Williams pointed to rising downside risks to employment, which he said were offsetting some of the upside risk to inflation.