
Sample Category Title
EUR/CHF Weekly Outlook
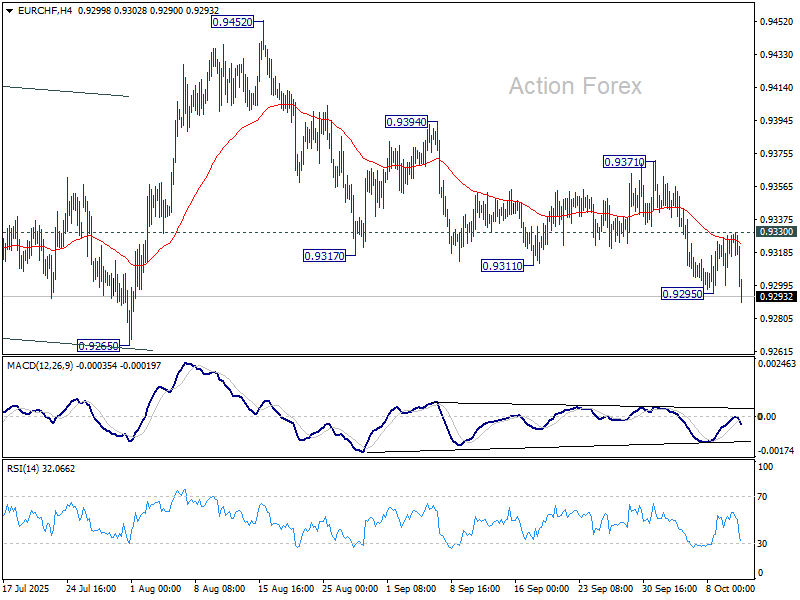
EUR/CHF's fall from 0.9452 resumed last week and continued to the end despite interim recovery. Initial bias is on the downside this week for 0.9265 support first. Firm break there should confirm that whole corrective rebound from 0.9218 has completed at 0.9452, and deeper fall should be seen to 0.9204/18 support zone. For now, risk will stay on the downside as long as 0.9330 resistance holds, in case of recovery.
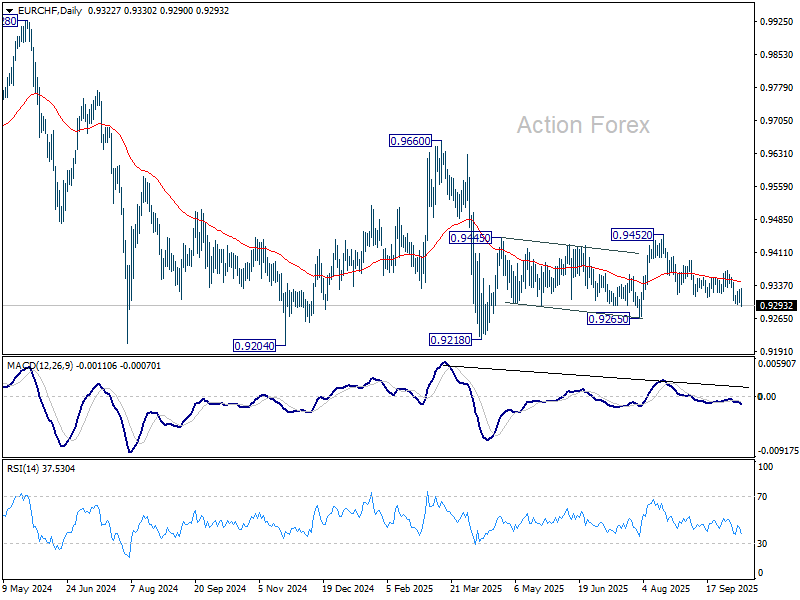
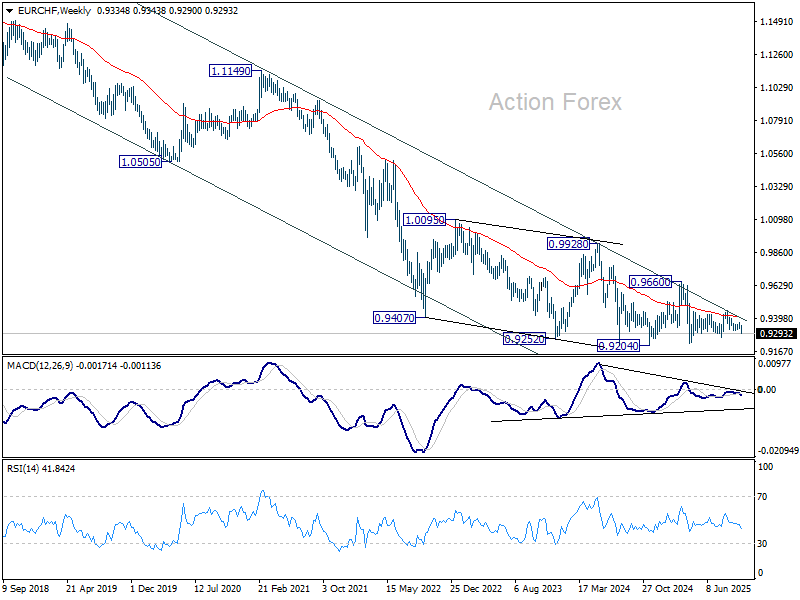
In the bigger picture, the down trend from 0.9204 (2018 high) might still be in progress considering that EUR/CHF is staying well inside the long term falling channel. Bearishness is reaffirmed by rejection at 55 W EMA (now at 0.9405). Firm break of 0.9204 will confirm down trend resumption. On the upside, break of 0.9452 resistance is needed to be the first sign of bullish reversal, and break of 0.9660 is needed to confirm.
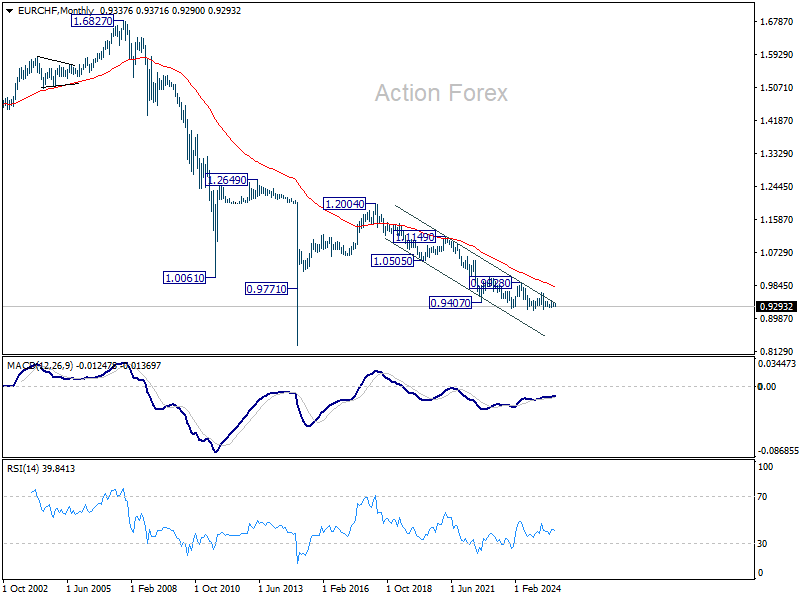
In the long term picture, overall long term down trend is still in progress in EUR/CHF. Outlook will continue to stay bearish as long as 55 M EMA (now at 0.9820) holds.
Summary 10/13 – 10/17
Monday, Oct 13, 2025
| GMT | Ccy | Events | Consensus | Previous |
|---|---|---|---|---|
| 21:30 | NZD | Business NZ PSI Sep | 47.5 | |
| 03:00 | CNY | Trade Balance (USD) Sep | 98.5B | 102.3B |
| GMT | Ccy | Events | |
|---|---|---|---|
| 21:30 | NZD | Business NZ PSI Sep | |
| Forecast: | Previous: 47.5 | ||
| 03:00 | CNY | Trade Balance (USD) Sep | |
| Forecast: 98.5B | Previous: 102.3B | ||
Tuesday, Oct 14, 2025
| GMT | Ccy | Events | Consensus | Previous |
|---|---|---|---|---|
| 23:01 | GBP | BRC Like-For-Like Retail Sales Y/Y Aug | 2.50% | 2.90% |
| 00:30 | AUD | RBA Meeting Minutes | ||
| 00:30 | AUD | NAB Business Confidence Sep | 4 | |
| 00:30 | AUD | NAB Business Conditions Sep | 7 | |
| 06:00 | EUR | Germany CPI M/M Sep F | 0.20% | 0.20% |
| 06:00 | EUR | Germany CPI Y/Y Sep F | 2.40% | 2.40% |
| 06:00 | GBP | Claimant Count Change Sep | 17.4K | |
| 06:00 | GBP | ILO Unemployment Rate (3M) Sep | 4.70% | 4.70% |
| 06:00 | GBP | Average Earnings Including Bonus 3M/Y Sep | 4.70% | 4.70% |
| 06:00 | GBP | Average Earnings Excluding Bonus 3M/Y Sep | 4.80% | |
| 06:30 | CHF | Producer and Import Prices M/M Sep | 0 | -0.60% |
| 06:30 | CHF | Producer and Import Prices Y/Y Sep | -1.80% | |
| 09:00 | EUR | Germany ZEW Economic Sentiment Oct | 41.7 | 37.3 |
| 09:00 | EUR | Germany ZEW Current Situation Oct | -76.4 | |
| 09:00 | EUR | Eurozone ZEW Economic Sentiment Oct | 30.2 | 26.1 |
| 10:00 | USD | NFIB Business Optimism Index Sep | 100.5 | 100.8 |
| 12:30 | CAD | Building Permits M/M Aug | 0.20% | -0.10% |
| GMT | Ccy | Events | |
|---|---|---|---|
| 23:01 | GBP | BRC Like-For-Like Retail Sales Y/Y Aug | |
| Forecast: 2.50% | Previous: 2.90% | ||
| 00:30 | AUD | RBA Meeting Minutes | |
| Forecast: | Previous: | ||
| 00:30 | AUD | NAB Business Confidence Sep | |
| Forecast: | Previous: 4 | ||
| 00:30 | AUD | NAB Business Conditions Sep | |
| Forecast: | Previous: 7 | ||
| 06:00 | EUR | Germany CPI M/M Sep F | |
| Forecast: 0.20% | Previous: 0.20% | ||
| 06:00 | EUR | Germany CPI Y/Y Sep F | |
| Forecast: 2.40% | Previous: 2.40% | ||
| 06:00 | GBP | Claimant Count Change Sep | |
| Forecast: | Previous: 17.4K | ||
| 06:00 | GBP | ILO Unemployment Rate (3M) Sep | |
| Forecast: 4.70% | Previous: 4.70% | ||
| 06:00 | GBP | Average Earnings Including Bonus 3M/Y Sep | |
| Forecast: 4.70% | Previous: 4.70% | ||
| 06:00 | GBP | Average Earnings Excluding Bonus 3M/Y Sep | |
| Forecast: | Previous: 4.80% | ||
| 06:30 | CHF | Producer and Import Prices M/M Sep | |
| Forecast: 0 | Previous: -0.60% | ||
| 06:30 | CHF | Producer and Import Prices Y/Y Sep | |
| Forecast: | Previous: -1.80% | ||
| 09:00 | EUR | Germany ZEW Economic Sentiment Oct | |
| Forecast: 41.7 | Previous: 37.3 | ||
| 09:00 | EUR | Germany ZEW Current Situation Oct | |
| Forecast: | Previous: -76.4 | ||
| 09:00 | EUR | Eurozone ZEW Economic Sentiment Oct | |
| Forecast: 30.2 | Previous: 26.1 | ||
| 10:00 | USD | NFIB Business Optimism Index Sep | |
| Forecast: 100.5 | Previous: 100.8 | ||
| 12:30 | CAD | Building Permits M/M Aug | |
| Forecast: 0.20% | Previous: -0.10% | ||
Wednesday, Oct 15, 2025
| GMT | Ccy | Events | Consensus | Previous |
|---|---|---|---|---|
| 00:00 | AUD | Westpac Leading Index M/M Sep | -0.05% | |
| 01:30 | CNY | CPI Y/Y Sep | -0.20% | -0.40% |
| 01:30 | CNY | PPI Y/Y Sep | -2.30% | -2.90% |
| 04:30 | JPY | Industrial Production M/M Aug F | -1.20% | -1.20% |
| 09:00 | EUR | Eurozone Industrial Production M/M Aug | -1.80% | 0.30% |
| 12:30 | CAD | Manufacturingles M/M Aug | -1.50% | 2.50% |
| 12:30 | CAD | Wholeleles M/M Aug | 0.80% | 1.20% |
| 12:30 | USD | Empire State Manufacturing Oct | 0.2 | -8.7 |
| 12:30 | USD | CPI M/M Sep | 0.40% | |
| 12:30 | USD | CPI Y/Y Sep | 2.90% | |
| 12:30 | USD | CPI Core M/M Sep | 0.30% | |
| 12:30 | USD | CPI Core Y/Y Sep | 3.10% | |
| 18:00 | USD | Fed's Beige Book | ||
| 23:50 | JPY | Machinery Orders M/M Aug | 0.50% | -4.60% |
| GMT | Ccy | Events | |
|---|---|---|---|
| 00:00 | AUD | Westpac Leading Index M/M Sep | |
| Forecast: | Previous: -0.05% | ||
| 01:30 | CNY | CPI Y/Y Sep | |
| Forecast: -0.20% | Previous: -0.40% | ||
| 01:30 | CNY | PPI Y/Y Sep | |
| Forecast: -2.30% | Previous: -2.90% | ||
| 04:30 | JPY | Industrial Production M/M Aug F | |
| Forecast: -1.20% | Previous: -1.20% | ||
| 09:00 | EUR | Eurozone Industrial Production M/M Aug | |
| Forecast: -1.80% | Previous: 0.30% | ||
| 12:30 | CAD | Manufacturingles M/M Aug | |
| Forecast: -1.50% | Previous: 2.50% | ||
| 12:30 | CAD | Wholeleles M/M Aug | |
| Forecast: 0.80% | Previous: 1.20% | ||
| 12:30 | USD | Empire State Manufacturing Oct | |
| Forecast: 0.2 | Previous: -8.7 | ||
| 12:30 | USD | CPI M/M Sep | |
| Forecast: | Previous: 0.40% | ||
| 12:30 | USD | CPI Y/Y Sep | |
| Forecast: | Previous: 2.90% | ||
| 12:30 | USD | CPI Core M/M Sep | |
| Forecast: | Previous: 0.30% | ||
| 12:30 | USD | CPI Core Y/Y Sep | |
| Forecast: | Previous: 3.10% | ||
| 18:00 | USD | Fed's Beige Book | |
| Forecast: | Previous: | ||
| 23:50 | JPY | Machinery Orders M/M Aug | |
| Forecast: 0.50% | Previous: -4.60% | ||
Thursday, Oct 16, 2025
| GMT | Ccy | Events | Consensus | Previous |
|---|---|---|---|---|
| 00:30 | AUD | Employment Change Sep | 20.0K | -5.4K |
| 00:30 | AUD | Unemployment Rate Sep | 4.30% | 4.20% |
| 04:30 | JPY | Tertiary Industry Index M/M Aug | -0.20% | 0.50% |
| 06:00 | GBP | GDP M/M Aug | 0.10% | 0% |
| 06:00 | GBP | Manufacturing Production M/M Aug | 0.20% | -1.30% |
| 06:00 | GBP | Manufacturing Production Y/Y Aug | 0.20% | |
| 06:00 | GBP | Industrial Production M/M Aug | 0.20% | -0.90% |
| 06:00 | GBP | Industrial Production Y/Y Aug | 0.10% | |
| 06:00 | GBP | Goods Trade Balance (GBP) Aug | -22.0B | -22.2B |
| 07:00 | CHF | SECO Economic Forecasts | ||
| 09:00 | EUR | Eurozone Trade Balance (EUR) Aug | 4.2B | 5.3B |
| 12:15 | CAD | Housing Starts Y/Y Sep | 248K | 246K |
| 12:30 | USD | Retail Sales M/M Sep | 0.60% | |
| 12:30 | USD | Retail Sales ex Autos M/M Sep | 0.70% | |
| 12:30 | USD | PPI M/M Sep | -0.10% | |
| 12:30 | USD | PPI Y/Y Sep | 2.60% | |
| 12:30 | USD | PPI Core M/M Sep | -0.10% | |
| 12:30 | USD | PPI Core Y/Y Sep | 2.80% | |
| 12:30 | USD | Initial Jobless Claims (Oct 10) | 218K | |
| 12:30 | USD | Philadelphia Fed Manufacturing Survey Oct | 23.2 | |
| 14:00 | USD | Business Inventories Aug | 0.20% | |
| 14:00 | USD | NAHB Housing Market Index Oct | 32 | |
| 14:30 | USD | Natural Gas Storage (Oct 10) | 80B | |
| 18:00 | USD | Crude Oil Inventories (Oct 10) | 3.715M |
| GMT | Ccy | Events | |
|---|---|---|---|
| 00:30 | AUD | Employment Change Sep | |
| Forecast: 20.0K | Previous: -5.4K | ||
| 00:30 | AUD | Unemployment Rate Sep | |
| Forecast: 4.30% | Previous: 4.20% | ||
| 04:30 | JPY | Tertiary Industry Index M/M Aug | |
| Forecast: -0.20% | Previous: 0.50% | ||
| 06:00 | GBP | GDP M/M Aug | |
| Forecast: 0.10% | Previous: 0% | ||
| 06:00 | GBP | Manufacturing Production M/M Aug | |
| Forecast: 0.20% | Previous: -1.30% | ||
| 06:00 | GBP | Manufacturing Production Y/Y Aug | |
| Forecast: | Previous: 0.20% | ||
| 06:00 | GBP | Industrial Production M/M Aug | |
| Forecast: 0.20% | Previous: -0.90% | ||
| 06:00 | GBP | Industrial Production Y/Y Aug | |
| Forecast: | Previous: 0.10% | ||
| 06:00 | GBP | Goods Trade Balance (GBP) Aug | |
| Forecast: -22.0B | Previous: -22.2B | ||
| 07:00 | CHF | SECO Economic Forecasts | |
| Forecast: | Previous: | ||
| 09:00 | EUR | Eurozone Trade Balance (EUR) Aug | |
| Forecast: 4.2B | Previous: 5.3B | ||
| 12:15 | CAD | Housing Starts Y/Y Sep | |
| Forecast: 248K | Previous: 246K | ||
| 12:30 | USD | Retail Sales M/M Sep | |
| Forecast: | Previous: 0.60% | ||
| 12:30 | USD | Retail Sales ex Autos M/M Sep | |
| Forecast: | Previous: 0.70% | ||
| 12:30 | USD | PPI M/M Sep | |
| Forecast: | Previous: -0.10% | ||
| 12:30 | USD | PPI Y/Y Sep | |
| Forecast: | Previous: 2.60% | ||
| 12:30 | USD | PPI Core M/M Sep | |
| Forecast: | Previous: -0.10% | ||
| 12:30 | USD | PPI Core Y/Y Sep | |
| Forecast: | Previous: 2.80% | ||
| 12:30 | USD | Initial Jobless Claims (Oct 10) | |
| Forecast: | Previous: 218K | ||
| 12:30 | USD | Philadelphia Fed Manufacturing Survey Oct | |
| Forecast: | Previous: 23.2 | ||
| 14:00 | USD | Business Inventories Aug | |
| Forecast: | Previous: 0.20% | ||
| 14:00 | USD | NAHB Housing Market Index Oct | |
| Forecast: | Previous: 32 | ||
| 14:30 | USD | Natural Gas Storage (Oct 10) | |
| Forecast: | Previous: 80B | ||
| 18:00 | USD | Crude Oil Inventories (Oct 10) | |
| Forecast: | Previous: 3.715M | ||
Friday, Oct 17, 2025
| GMT | Ccy | Events | Consensus | Previous |
|---|---|---|---|---|
| 09:00 | EUR | Eurozone CPI Y/Y Sep F | 2.20% | 2.20% |
| 09:00 | EUR | Eurozone Core CPI Y/Y Sep F | 2.30% | 2.30% |
| 09:00 | EUR | Eurozone Core CPI M/M Sep | 0.10% | |
| 12:30 | USD | Housing Starts Sep | 1.307M | |
| 12:30 | USD | Building Permits Sep | 1.312M | |
| 12:30 | USD | Import Price Index M/M Sep | 0.30% | |
| 13:15 | USD | Industrial Production M/M Sep | 0.10% | 0.10% |
| 13:15 | USD | Capacity Utilization Sep | 77.30% | 77.40% |
| GMT | Ccy | Events | |
|---|---|---|---|
| 09:00 | EUR | Eurozone CPI Y/Y Sep F | |
| Forecast: 2.20% | Previous: 2.20% | ||
| 09:00 | EUR | Eurozone Core CPI Y/Y Sep F | |
| Forecast: 2.30% | Previous: 2.30% | ||
| 09:00 | EUR | Eurozone Core CPI M/M Sep | |
| Forecast: | Previous: 0.10% | ||
| 12:30 | USD | Housing Starts Sep | |
| Forecast: | Previous: 1.307M | ||
| 12:30 | USD | Building Permits Sep | |
| Forecast: | Previous: 1.312M | ||
| 12:30 | USD | Import Price Index M/M Sep | |
| Forecast: | Previous: 0.30% | ||
| 13:15 | USD | Industrial Production M/M Sep | |
| Forecast: 0.10% | Previous: 0.10% | ||
| 13:15 | USD | Capacity Utilization Sep | |
| Forecast: 77.30% | Previous: 77.40% | ||
Markets Weekly Outlook – Geopolitical Peace and Turmoil; Third Week of Shutdown
Week in review – Equities flashing red, peace in the Middle East and key milestones in Metals
It has been a tense week for global markets as the US government shutdown enters its second week.
What had initially seemed like a non-event is now beginning to rattle investors.
The growing uncertainty around the absence of economic data and a huge US Dollar rally has started to weigh on sentiment, breaking the market’s steady bullish rhythm since late September.
Risk assets are blinking. Equities and cryptocurrencies are showing cracks after a relentless climb to new records since September 23.
The Dow Jones reached a record 47,000 last Friday and has since rolled over and failed to reclaim those highs. The S&P 500 and Nasdaq followed during today’s action, retreating toward four-week lows as profit-taking intensified.
Bitcoin, which had just set new all-time highs to $125,700 on Monday, also faced sharp outflows. The ongoing steep selloff is dragging the total crypto market cap back below $4 trillion.
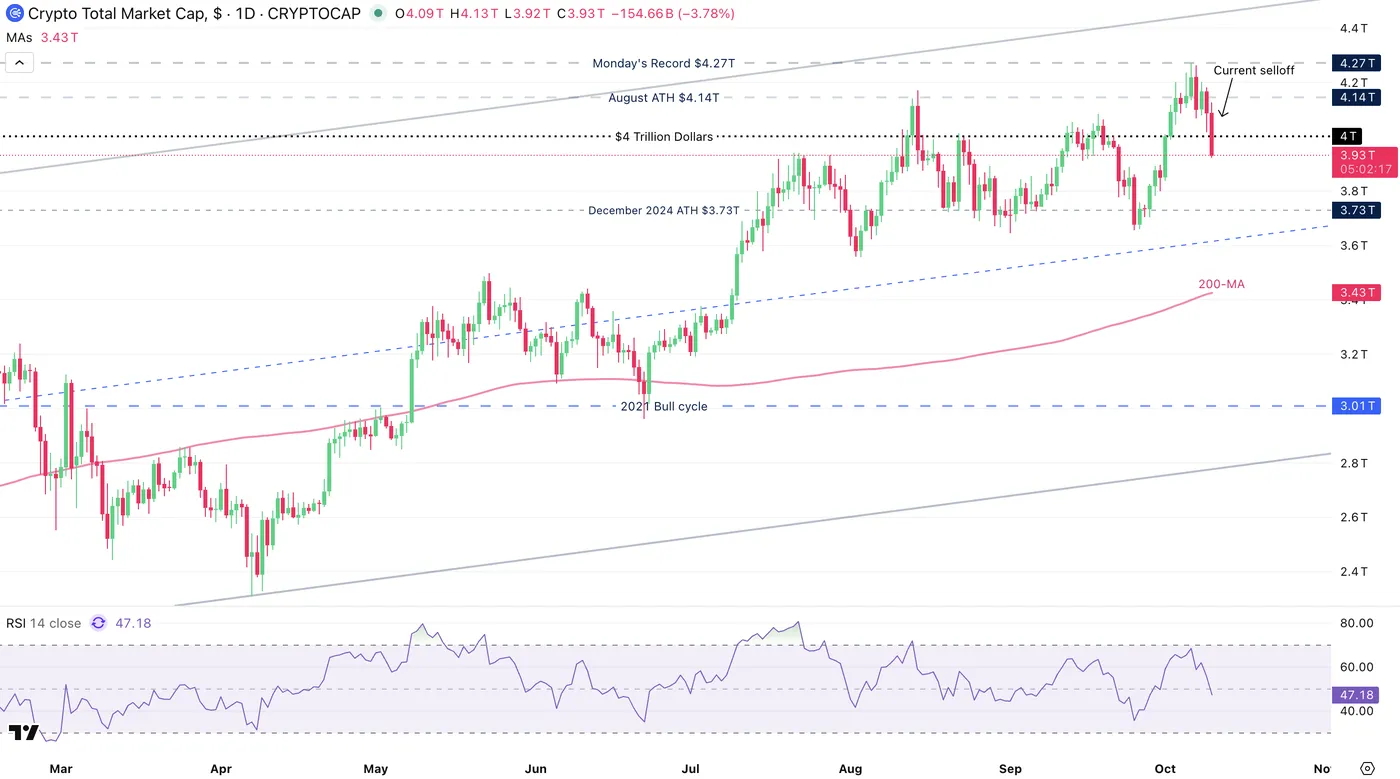
Cryptocurrency total Market cap – October 10, 2025 – Source: TradingView
Some geopolitical tensions have added fuel to the volatility. This morning, President Trump reignited his long-standing trade feud with China, accusing President Xi Jinping of “manipulating global trade for unfair advantage.”
His comments — delivered through a series of pointed remarks on Truth Social — sent an uneasy tone across markets. The much-anticipated meeting between the two leaders at the APEC summit in South Korea in November should see further delay.
Meanwhile, metals continued to shine in the chaos.
Silver extended its rally, surging another 4% and breaking above $50 for the first time on record. Gold broke $4,000, marking another milestone, but some waves of volatility are seen at the highs. Will the precious metal close above the milestone at the end of the week?
But not all headlines were grim. For good geopolitical news, the Gaza war seems to be approaching its end with Israel and Hamas both agreeing to the Trump 20-point Plan.
Israeli soldiers officially retracted behind the yellow line, which should lead to the return of all the hostages in the next 72 hours, with US forces starting to enter Gaza to begin the transition period.
Let’s look at what’s coming up for next week.
Weekly performance from different asset classes
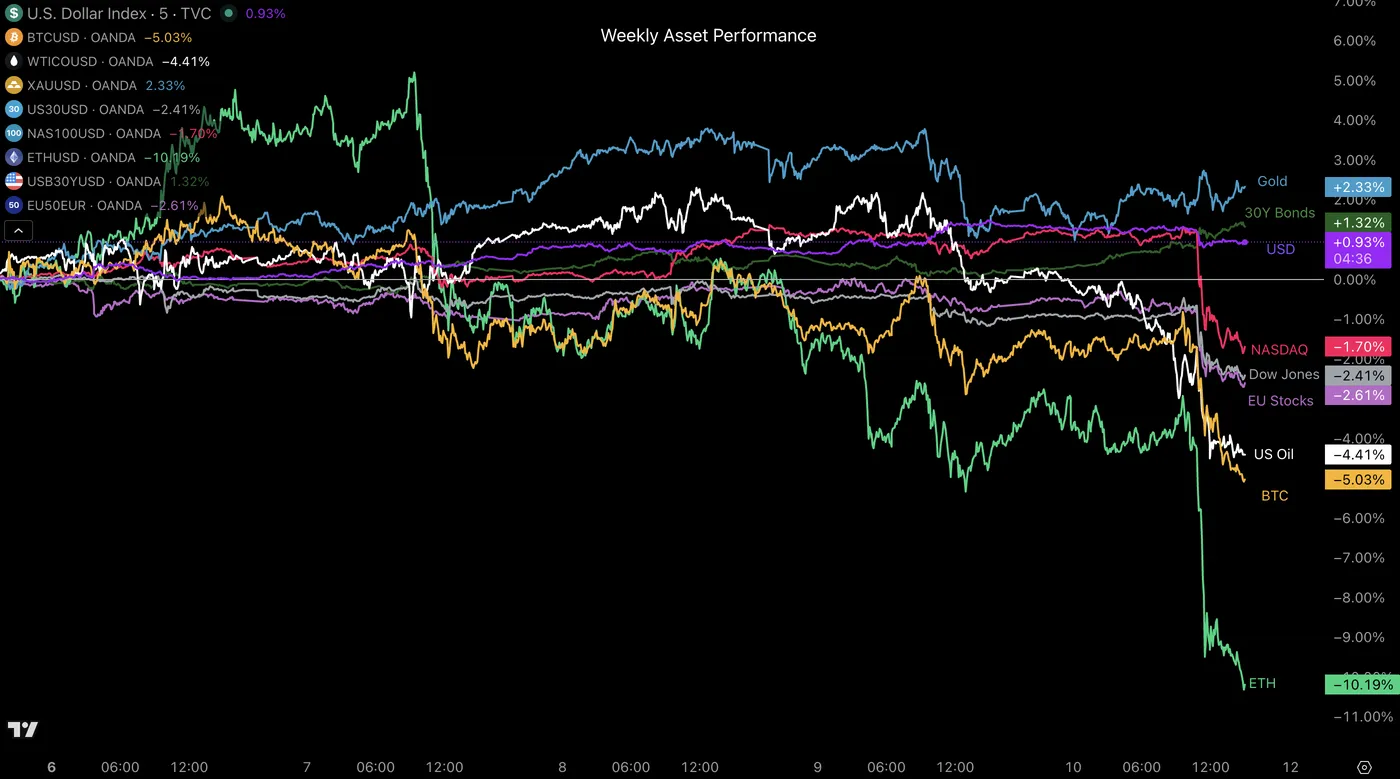
Weekly Asset Performance, October 10, 2025 – Source: TradingView
The weekly performance is extremely volatile across all types of asset-classes but I want to point your attention to the immense risk-off flows that have started around 10:00 this morning.
Ethereum yet again led the action by being the first one to move – Keep an eye on it for the time to come.
Let’s dive into next week’s action. Expect A LOT of volatility.
The Week Ahead – Still no BLS data but key speeches expected
Asia Pacific Markets - Focus on China and Australia
Asia-Pacific traders face a relatively busy week, dominated by Chinese trade and inflation figures, Australia’s employment data, and ongoing political strains in Japan.
The week starts quietly on Sunday with New Zealand’s Business NZ PSI for September, before turning to China’s trade balance later in the evening.
Exports and imports will be closely scrutinized to confirm that last month’s modest rebound in external demand is holding. Consensus looks for exports to rise 6% YoY and imports to climb 1.5%, suggesting steady but uneven momentum.
The Reserve Bank of Australia’s Meeting Minutes will be released on Monday. The AUD has been holding strong against most majors and particularly against its neighbor, the NZD, with Chinese stimulus providing a better outlook for Australia.
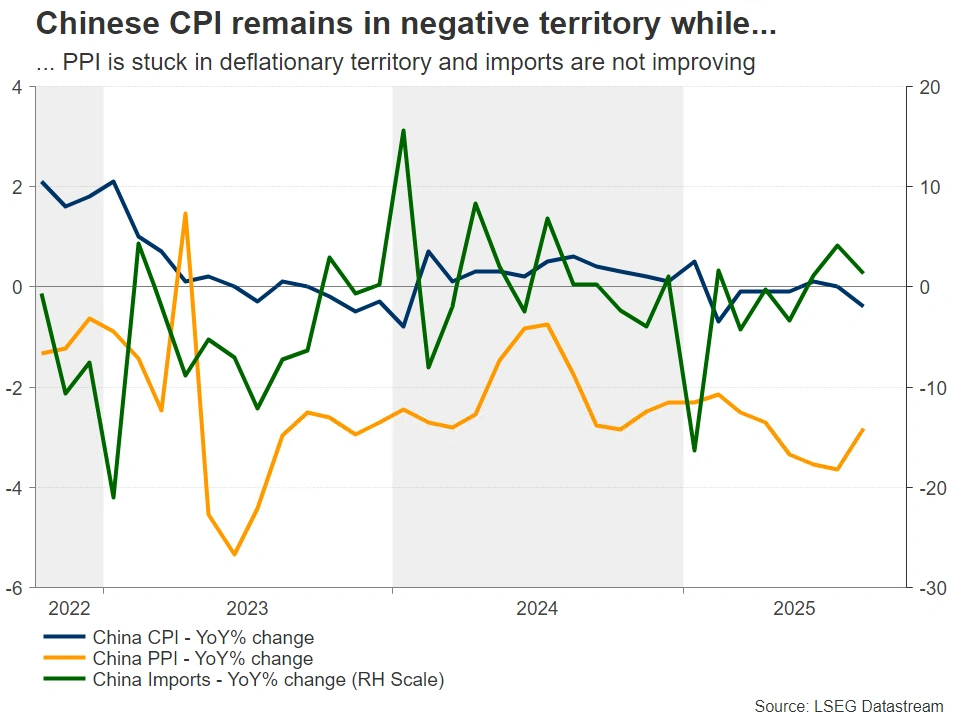
Asia traders will also look into Chinese inflation data on Tuesday to monitor whether the ongoing deflation (currently -2.3% y/y) will continue, which should prompt or stop further stimulus from the PBoC.
Wednesday is the busiest session for AUD traders, with a comprehensive Australian labor market update due at 20:30 ET.
Employment change is expected to rise by 17K after last month’s decline of -5.4K, taking the unemployment rate to 4.3%.
Beyond the data, Japan remains in the spotlight following Sanae Takaichi's election as head of the LDP.
While the Nikkei celebrated the appointment of the first woman in power in Japan, the yen weakened sharply amid mounting fiscal concerns and a coalition deadlock with Komeito.
The coming week will be crucial to see whether progress is made on forming a government and whether the JPY continues to bleed.
US, Europe and UK Markets - key speeches from Powell, Lagarde and Macklem
Turning back to the Occident:
Key data watchers center their attention on the UK labor data (Tuesday) and industrial production (Wednesday), both crucial for gauging whether the Bank of England’s projections are well priced.
Cuts have been priced out for the BoE with still crippling inflation, particularly food inflation, which starts to hurt British citizens – Tough repercussions of Brexit.
Meanwhile, Europe will see its EU Zone Inflation data on Friday, but all eyes are on the ECB President Lagarde’s speech on Thursday (12:00 ET), where she’s expected to address recent market turbulence and risks to growth.
France is expected to announce a new government and Prime Minister soon, possibly restoring short-term confidence in the Euro after a rough week of political weakness.
Across the Atlantic, the US calendar is stacked with high-profile speeches from Fed Chair Powell, Bowman, Waller, and Barr. U.S. retail Sales, PPI, and Jobless Claims are usually released but are still delayed because the BLS and Census Bureau are not open during the shutdown.
Finally, BoC Governor Macklem joins the global central bank chorus on Thursday 13:30 after stressing trade and investment weakness in recent remarks. During that speech, markets might also look to learn more about the US-Canada trade deal developments.
For all market-moving economic releases and events, see the MarketPulse Economic Calendar. (High-tier data only)
Safe Trades and enjoy your weekend!
The Weekly Bottom Line: No Data, No Problem
Canadian Highlights
- Canadian and U.S. policymakers have yet to hammer out a trade deal, but negotiations are still ongoing.
- Trade-related headwinds dampened Canadian trade in August, with tariff-exposed sectors continuing to feel the pinch.
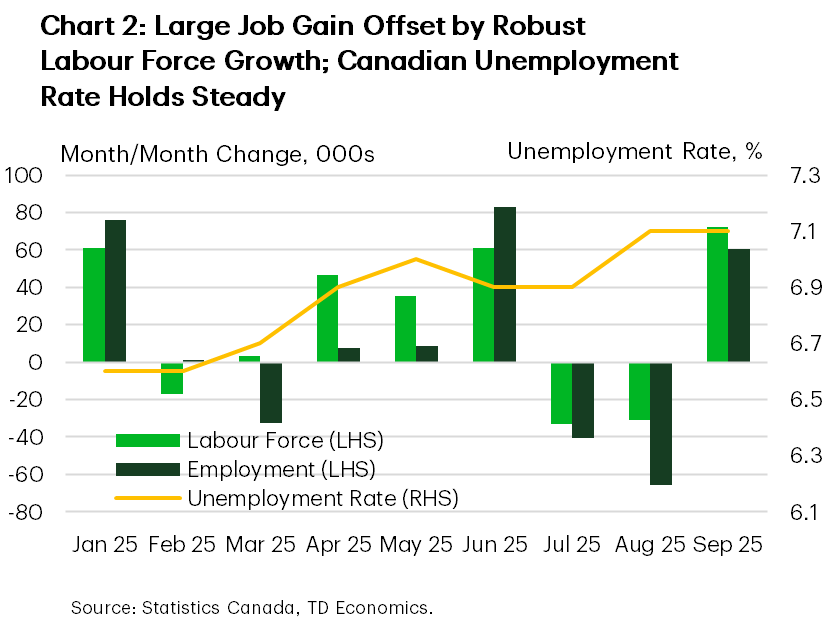
- Canada’s labour market recovered some of the jobs lost in the previous two months, while ongoing labour force growth kept the unemployment rate steady.
U.S. Highlights
- The government shutdown continues through its second week, with no clear end in sight, while trade tensions between the U.S. and China have suddenly heated up.
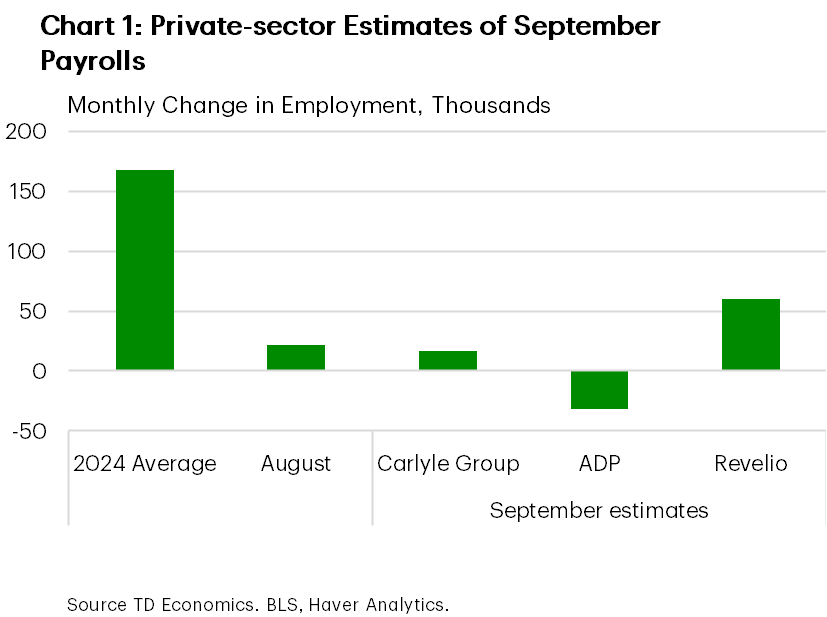
- Absent official data, the market is turning to imperfect private-sector alternatives, which suggest the labor market continued to cool in September.
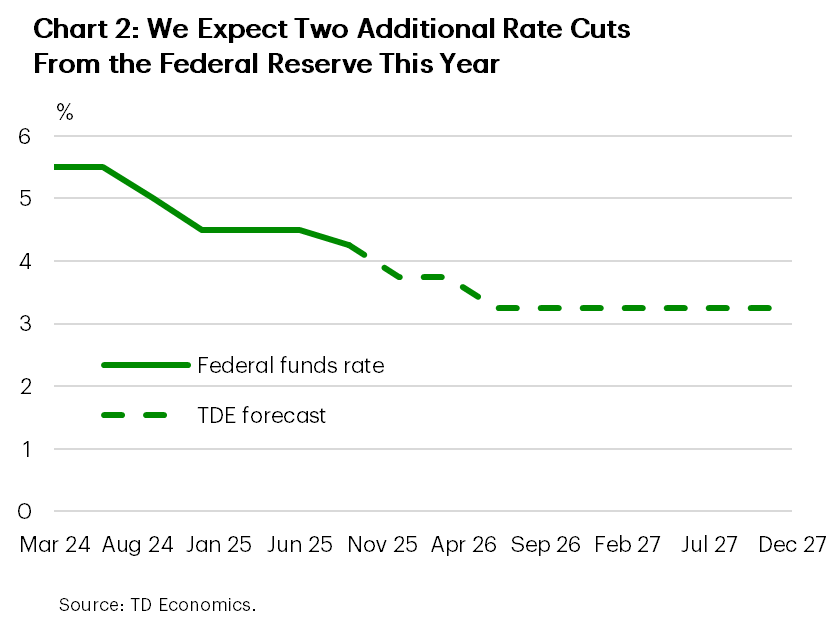
- We don’t see any developments this week that are likely to cause a big shift in the perception of the economy or the outlook, and so we are still penciling in two more quarter-point rate cuts from the Federal Reserve by year-end.
Canada – Labour Market Surprise
Toronto Blue Jays supporters have plenty reason to celebrate this week, having kept their championship dreams alive in a series win over the Yankees. Outside of the sports world, developments north of the border were a little more mixed. Let’s review the game tape and see what transpired this week.
Strike 1: Trade Talks Stall. Prime Minister Mark Carney and team went to bat for Canada during their visit to the White House; however, no trade agreement has been reached yet. Canadian trade representatives remain in Washington, continuing efforts to advance discussions, though the final outcome remains uncertain at this time. To be fair, a new comprehensive trade framework was not expected at this meeting—such progress is anticipated during next year’s USMCA review—but there is optimism that smaller deals regarding sector-specific tariffs can be reached soon. On a positive note, both sides have expressed confidence that a trade agreement will eventually be achieved, even if certain tariffs persist.
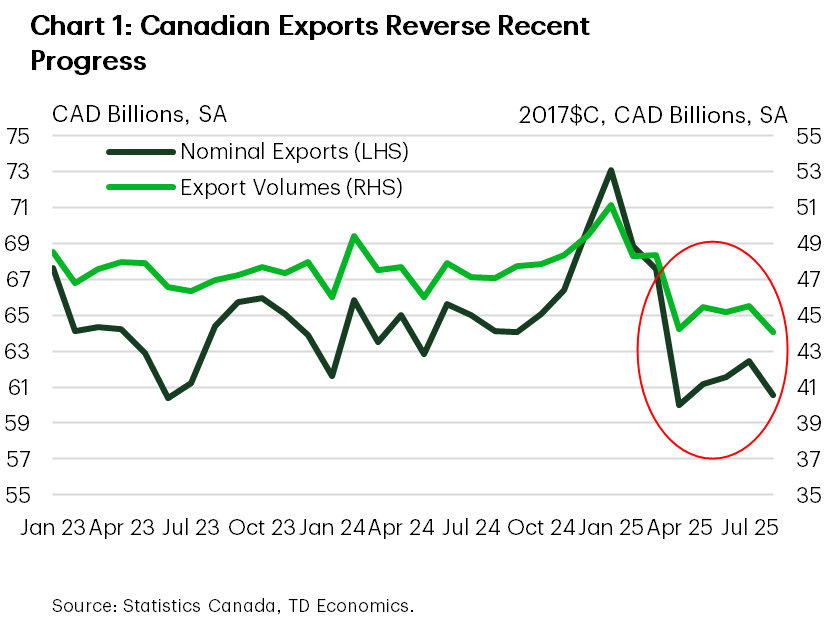
Strike 2: Export Recovery Experiences a Setback. Canadian exports declined by a hefty 3.0% month-on-month in August (Chart 1), with notable decreases observed in shipments to both U.S. and non-U.S. markets. Consequently, much of the progress made since the trade rebound began in April has been reversed. Recent trade flows have exhibited increased volatility, largely attributable to substantial movements of unwrought gold as buyers respond to the meteoric gold rally. Looking through the noise, one pattern is consistent: exports of goods to the U.S. subject to sectoral tariffs—specifically in steel, aluminum, automobiles, and lumber—are generally underperforming other export categories.
Base Hit: Canada’s Job Growth Exceeds Expectations. Labour market data for September indicated the Canadian economy added 60k jobs, significantly outperforming consensus forecasts for no job growth. This increase offsets more than half of the losses incurred in the previous two months, with employment gains distributed across multiple sectors. Notably, trade-exposed sectors—including manufacturing, agriculture, energy, and wholesale trade—recorded solid gains for the month. Zooming out, employment in Canadian industries most susceptible to U.S. trade remains below the performance of other segments of the economy. Despite the sturdy print, the unemployment rate remained steady at 7.1%, attributed to the largest influx of individuals into the labour force since November 2024.
The Bank of Canada will convene at the end of the month to make their next interest rate decision. This week’s jobs data may influence the BoC to hold rates steady. Markets also responded by lowering their expectations of a 25 bps cut from 60% earlier this week to around 40% as of writing. An update to Canadian inflation, in around two weeks, will play a significant role in the Bank’s decision. Though underlying inflation continues to hover within target range, strong evidence of waning inflation momentum will likely be required for the BoC to consider another rate cut.
U.S. – No Data, No Problem
Up until Friday, markets had been relatively calm amid the ongoing government shutdown, which has entered its 10th day. President Trump’s threat to increase tariffs on China this morning, in response to China’s export controls on rare-earth metals, has upended that. President Trump has gone so far as to declare he is not interested in meeting President Xi in person as previously scheduled for the end of the month, leading to a sharp sell-off in US equities and pushing Treasury yields lower. Markets stoically withstood the failure of seven separate proposals to re-open the government, but the possible breakdown of U.S.-China trade negotiations may be too much to bear. If that wasn’t enough, the end of the shutdown is not clearly in sight. The Senate is now adjourned until October 14, which all but guarantees that military members will miss a full pay cycle, an unprecedented development.
The outlook for the shutdown is not the only thing that is cloudy. The government shutdown means that official economic data are not being published, and policymakers, businesses, and households are unable to see new data on the state of the economy. Various private-sector groups have produced estimates of what happened to employment in September, shown in Chart 1. This was the key piece of data which was due to be published last Friday. While these alternative estimates generally suggest the labor market continued to cool through September, these measures are at best imperfect proxies for the official data. As for what data we do have this week, the preliminary reading of the University of Michigan’s consumer confidence ticked a touch higher in October. However, expectations on the future outlook continued to slide for a third consecutive month, likely driven by the softening labor market and still elevated uncertainty on trade policy.
Several members of the FOMC spoke this week, offering some insight into their thinking amidst the shutdown. New York Fed President Williams indicated that the lapse in government data would not deter him from further easing the policy rate at the Fed’s coming meetings. Meanwhile, other speakers continued to reiterate prior views. Kansas City Fed President Schmid voiced concern about inflation, while Miran, the only FOMC member to vote for a larger 50 basis point rate-cut at the last meeting, again indicated how he expected inflation to moderate. It is little surprise that market pricing at the next Fed meeting has remained relatively unchanged through the government shutdown. Expectations for further easing at a moderate pace are in line with the general view we observed in the FOMC minutes released this week, that interest rates are currently moderately restrictive and risks have shifted somewhat to the downside.
Normally, we would be looking ahead to next week’s release of CPI for more information on how prices are reacting to tariffs, but we are following the shutdown. We will also be closely watching trade negotiations between the U.S. and China to see what comes of today’s escalation.
Weekly Economic & Financial Commentary: Data Delayed, Decisions Loom
Summary
United States: Data Delayed, Decisions Loom
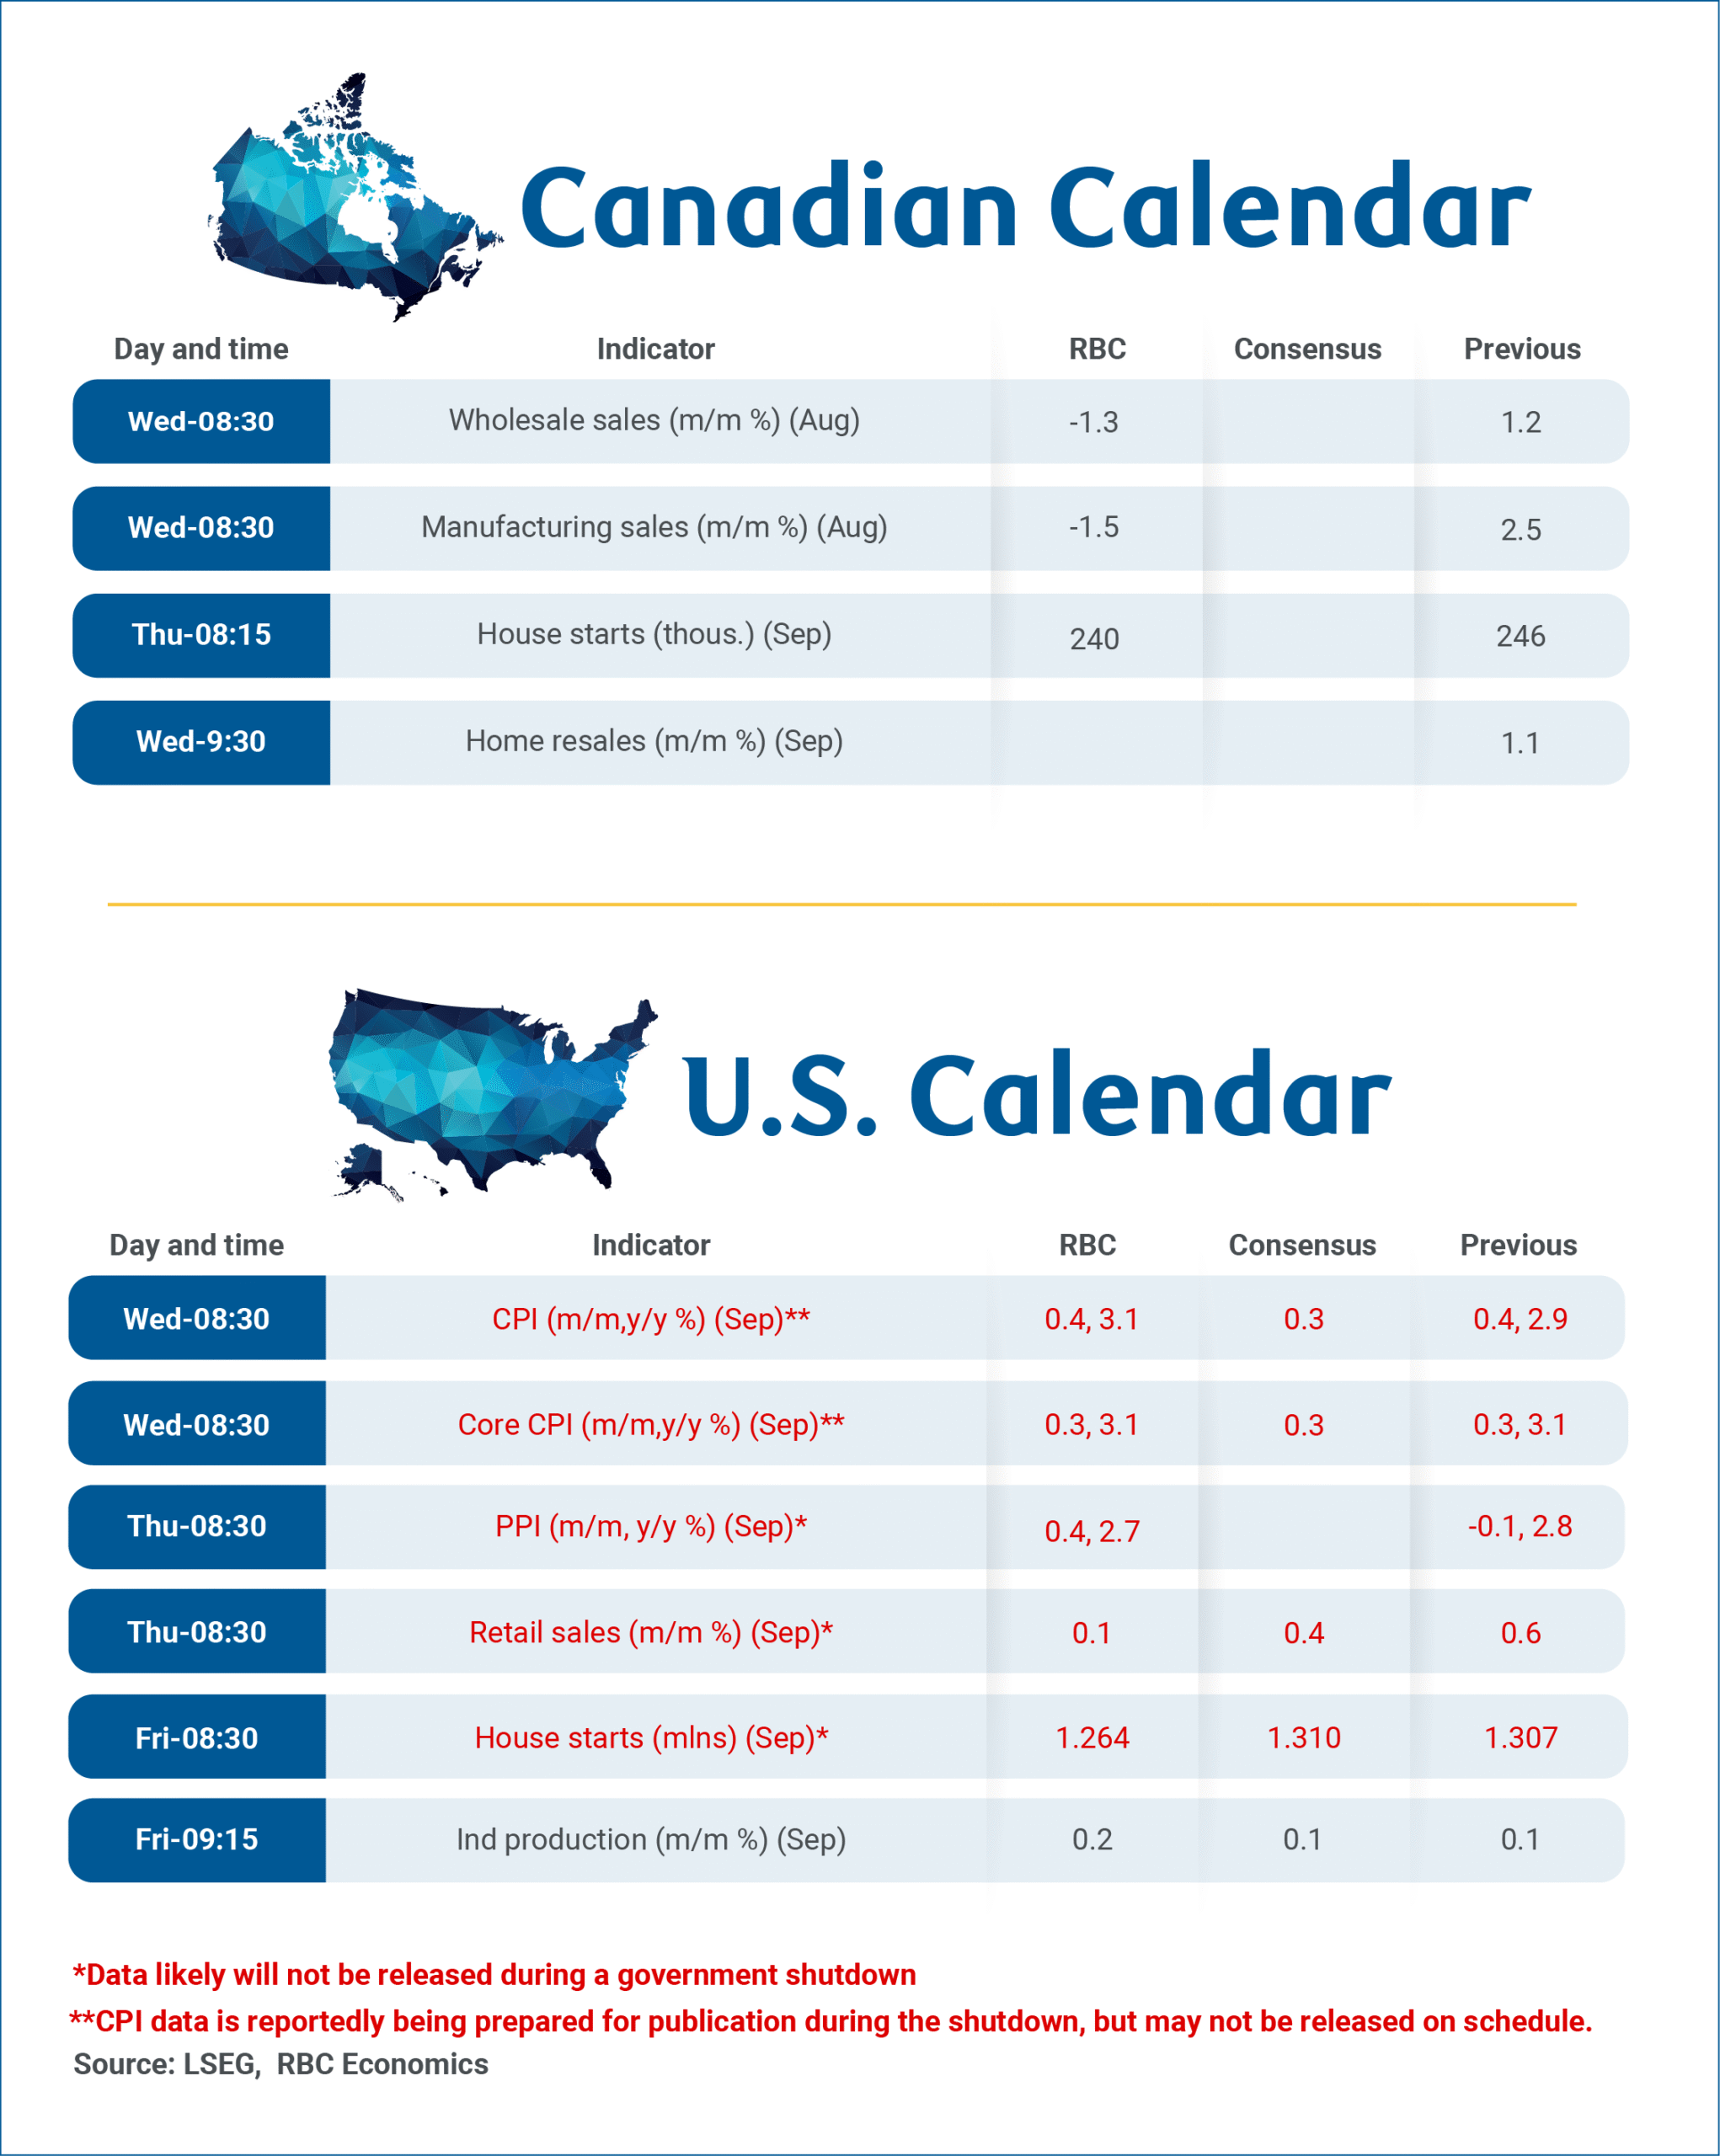
- The federal government shutdown continues to delay economic data releases, including international trade and jobless claims this week. That said, the September Consumer Price Index is now expected to be published before the end of the month, just in time for the FOMC's next meeting.
- Next week: CPI (Wed.), Retail Sales (Thu.), Industrial Production (Fri.)
International: Global Economy: Stabilizing or Stalling?
- This week brought a mix of data releases from foreign economies. Japan’s wage growth slowed more than expected, while Canada’s labor market showed signs of stabilization. On the monetary policy front, the Reserve Bank of New Zealand cut its policy rate by 50 bps. And finally, in emerging markets, inflation in both Mexico and Brazil picked up.
- Next week: Australia Employment (Wed.), U.K. Monthly GDP (Thu.)
Topic of the Week: Seeing the Forest for the Trees
- New tariffs on imported wood products, which include softwood lumber, furniture and cabinets take effect on Oct. 14. We expect them to leave the overall U.S. average effective tariff rate unchanged at 18%. While the impact on consumer spending may be limited, construction costs could be pressured by new lumber tariffs.
Forward Guidance: U.S. Tariffs Likely Continued to Weigh on Canadian Industries in August
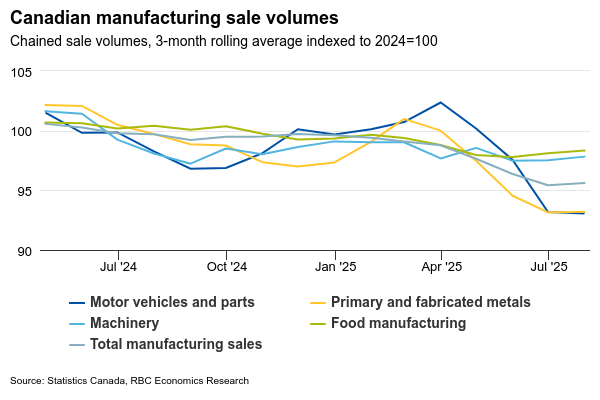
Early Canadian gross domestic product and net trade data have broadly showed signs the economy is stabilizing after contracting in Q2. However, heavily trade-exposed sectors remain under significant pressure, driving expectations for softer industry data on Wednesday.
Statistics Canada’s preliminary estimate showed manufacturing sales contracted 1.5% in August, partially reversing the stronger 2.5% gain in July. Part of this swing reportedly reflected a pullback in the transportation sector following a jump in motor vehicle sales in July. Vehicle production and sales from July to August are notoriously volatile due to typical factory retooling shutdowns.
Food sales were also reportedly weaker, and the 0.5% rise in manufacturing production prices reported for August suggests sales volume likely more than reversed the 1.6% increase in July. That would leave volume down about 4.5% in August from a year ago with more substantial declines in sectors targeted by U.S. tariffs such as primary metal manufacturing.
The positive news is broader consumer demand in Canada has been resilient, supporting activities in sectors more domestically focused. StatsCan’s preliminary estimate showed a 1% increase in retail sales in August after a 0.8% decline in the previous month.
Housing activity has also continued to recover at a modest pace. Early data from local real estate boards point to a mixed national picture in September for home resales.
Overall, we maintain our expectation that softening in trade-exposed sectors will persist, but won’t spread widely to other parts of the Canadian economy. We look for weak GDP growth over the second half of this year, starting with a 0.5% annualized increase in Q3.
In the U.S., the government shutdown means key data releases, including September’s retail sales, are unlikely to be released in the coming week.
On balance, U.S. consumer spending has broadly surprised to the upside this year. Alternative data from the National Retail Federation pointed to a contraction in core retail spending (excluding auto and gas) in September, but to a level that remains well above a year ago.
September’s U.S. inflation data may still be released but with a delay, as it feeds into the calculation of cost-of-living adjustments for Social Security beneficiaries, which is considered mandatory under law. We expect headline CPI to have edged higher to 3.1% in September from 2.9%, but core ex-food and energy inflation to have held at 3.1% after another 0.3% month-over-month increase from August.
Week Ahead – Markets May Grow Wary of US Shutdown and Lack of US Data
- US shutdown reaches a critical stage; dollar benefits from lingering uncertainty.
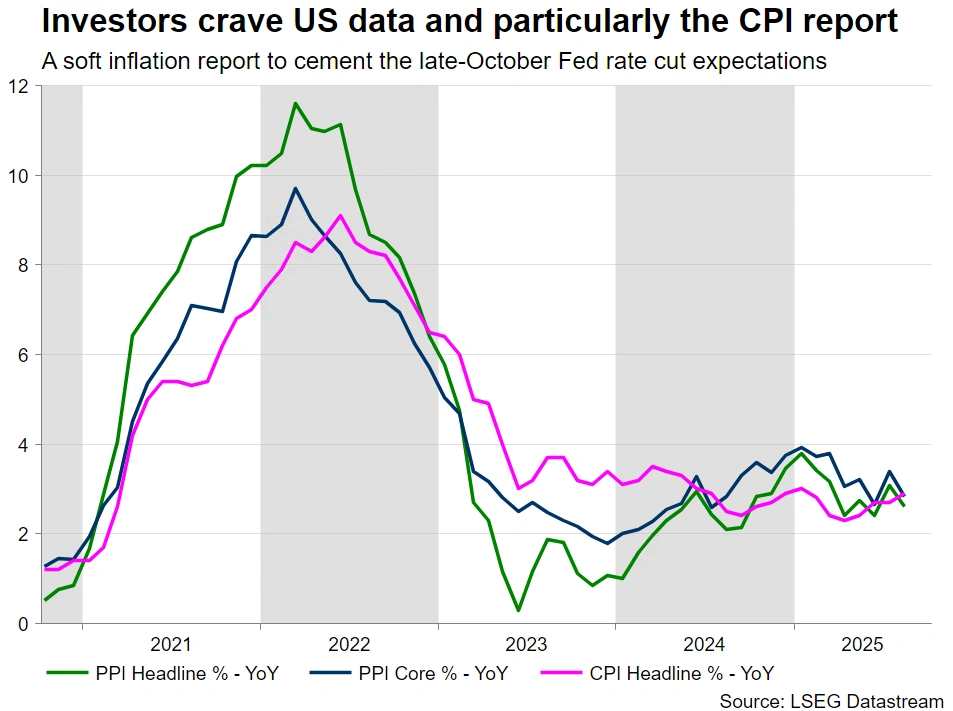
- US CPI report may be published but the Fed needs more data to justify the rate cut.
- No end to the yen’s suffering, as dollar/yen trades at intervention territory.
- China is potentially preparing for new support measures and a looser PBoC stance.
- Key jobs data in the UK and Australia; commodity currencies in need of a boost.
Political risks in the spotlight
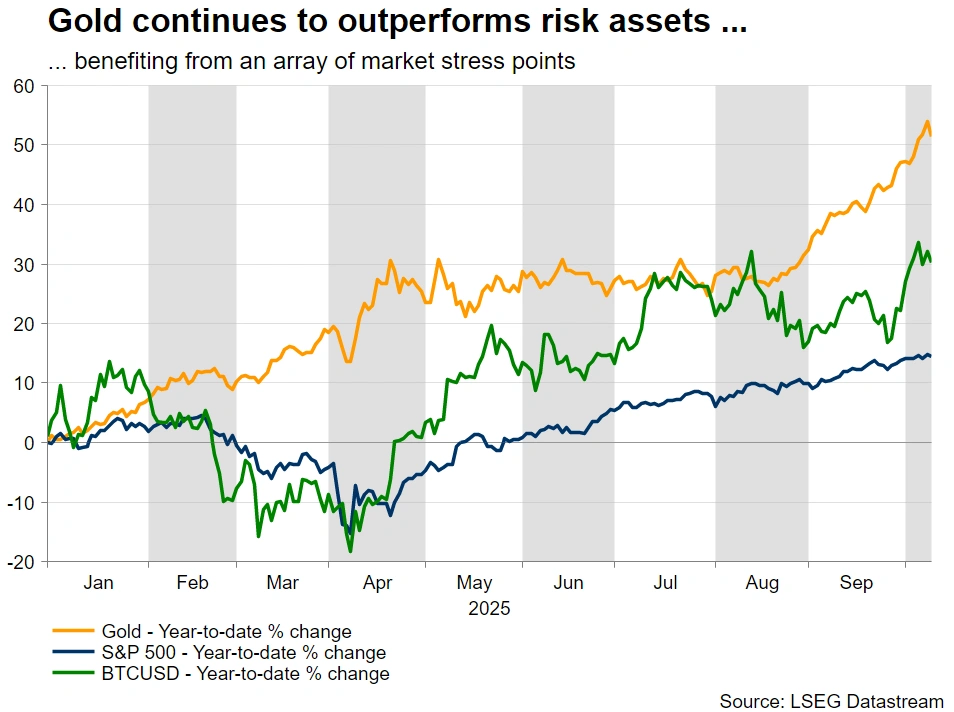
Following a Fed-dominated period, political risks have been monopolizing market attention. The US government shutdown and developments in both France and Japan have been fueling an atypical risk-off reaction, with the US dollar, gold and US equities surging. In particular, gold has been generating headlines with its continued rally, only to ease in the past two sessions on news of a ceasefire agreement in Gaza.
Could the US shutdown continue into a third week?
While most investors have taken the US federal government shutdown lightly, assuming that it will prove a short-term affair, little progress has been made since October 1. Both Democrats and Republicans remain unyielding at this stage, despite voices on both sides calling for a quick reconciliation before the shutdown damages the US economy.
Multiple Senate votes have failed so far, which could mean that Trump’s involvement is potentially necessary to get the show on the road, assuming he is interested in finding common ground. Behind-the-door discussions are expected to intensify going into next week, but the outcome is uncertain.
Markets reacted calmly to the absence of the early October jobs data, however, next week the CPI and PPI reports along with retail sales data are scheduled for release. Another week without official data could raise questions about the 25bps Fed rate cut expectations. Interestingly, reports point to an effort by the Bureau of Labour Statistics to compile the CPI report, but its publication date remains unknown and could even take place just ahead of the October 29 Fed meeting.
That said, if the shutdown concludes next week, it might be extremely challenging for the BLS to meet its own data calendar. This means that an amended calendar will be announced, potentially extending until year-end to normalize releases, with a strong possibility of two Nonfarm Payrolls reports in the same calendar month.
Meanwhile, with the next blackout period starting on October 18, both Fed doves and hawks are expected to carefully lay their arguments. Quite notably, since September 19, Fedspeak has not been overly dovish, with most centrist members trying to muddle the waters and make the October rate decision less predictable. Markets, though, appear adamant that another rate cut will be announced.
The dollar has had a good week, posting sizeable gains particularly against the euro and the yen. A continuation of the shutdown might not clip its wings despite concerns about the impact on the US economy, especially if Fedspeak remains balanced throughout the next week and the positive momentum in US stocks persists.
Part of the reason US politicians are relatively relaxed about the shutdown is the strong performance of US equity indices. That said, a reversal of the current bullish trend, such as a couple of strongly negative sessions, could prove to be a powerful catalyst for getting the funding bill negotiations back on track.
No end to Japan’s political unrest
It has been a week since Sanae Takaichi won the LDP leadership contest, but her future is already looking bleak. Following the breakup of the long-standing coalition between the LDP and Komeito parties – assuming there is no U-tern from Komeito over the weekend – Takaichi has two options: seek support elsewhere – specifically from the right-wing DPP party – or resign and allow the LDP to select a new leader who could reset the LDP-Komeito relationship.
Meanwhile, the DPP appears to be the kingmaker. The main opposition parties have proposed nominating Tamaki as a candidate in the upcoming PM vote against Takaichi, but the DPP head is not agreeable to this proposal. Similarly, he has excluded the possibility of an LDP-DPP coalition that would lack a majority in the Diet.
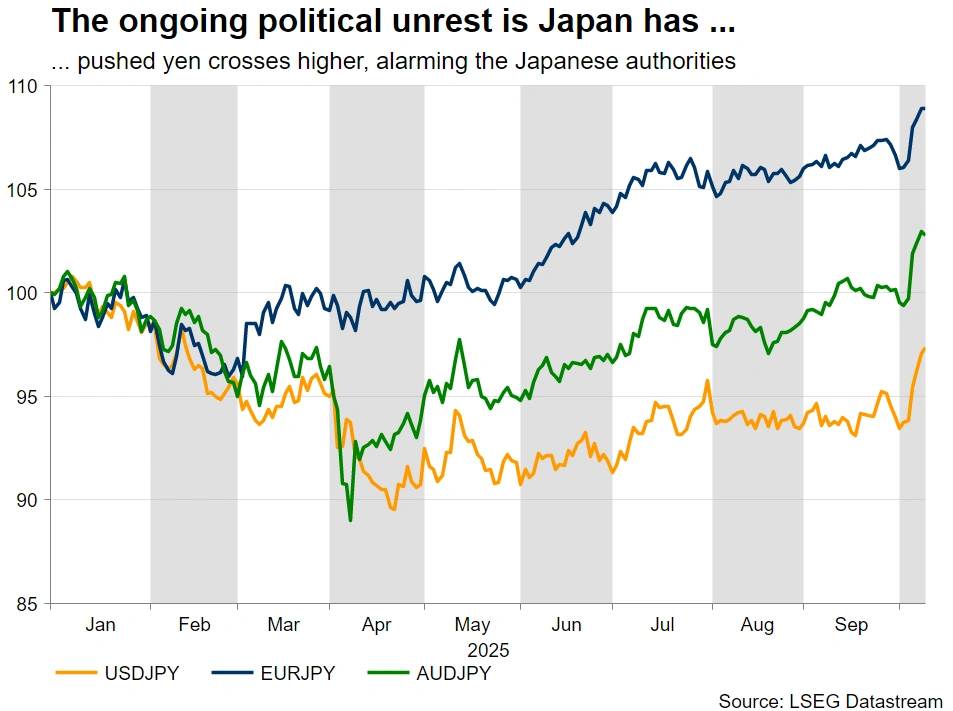
The yen has reacted slightly positively to the LDP-Komeito breakup, but Japan’s outlook has just become more clouded. The Japanese Finance Ministry, in cooperation with the BoJ, will most likely keep tabs on yen underperformance, but a new PM has to be elected soon. In the meantime, an October BoJ rate hike appears to be out of the question, but December remains a ‘live’ month.
Developments in France dent Euro’s appeal
Political developments in France have disrupted the relative calmness in the eurozone. President Macron has to pick another PM, but the left-wing Popular Front and Le Pen’s National Rally continue to hold the keys to the National Assembly. Therefore, the path ahead will remain tricky, with the 2026 budget deadline pushed back to mid-December.
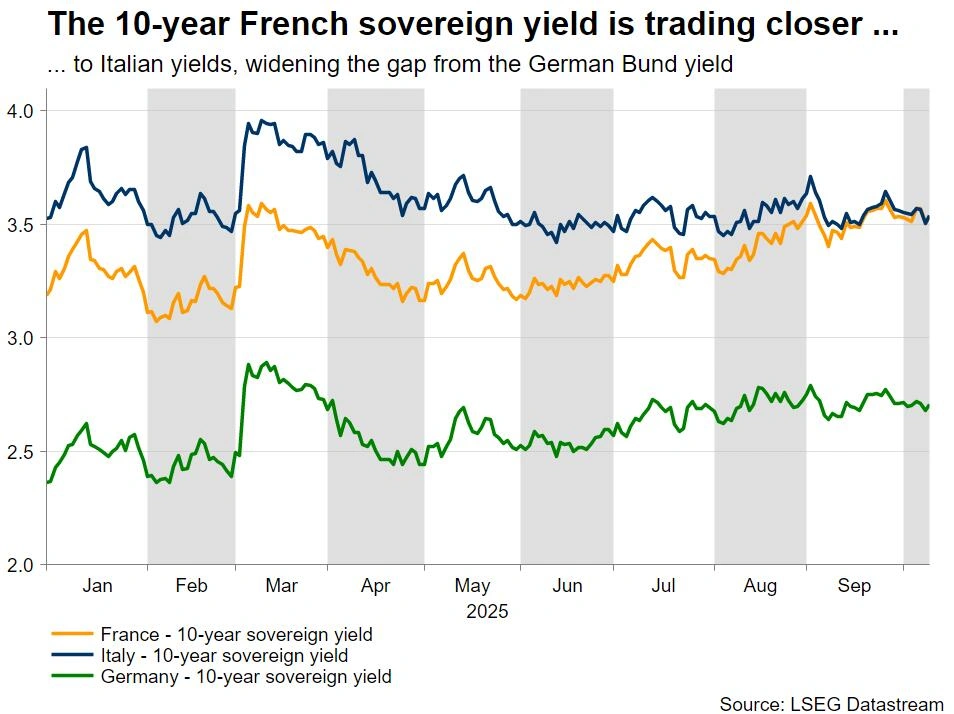
With French sovereign bond yields edging higher, and the euro underperforming versus the dollar, a credible solution to the French political deadlock is needed. Fresh parliamentary elections are less likely at this stage, since the two aforementioned parties are expected to dominate again. Therefore, Macron might decide to break the deadlock by calling snap presidential elections. But this is probably a scenario that may materialize in 2026.
Is China gearing for new support measures and a looser PBoC stance?
With the Golden Week completed, it is back to business for China. Next week’s calendar includes trade balance figures, and, most importantly, the September CPI and PPI reports. China continues to battle deflation, with the numerous support packages so far failing to boost the domestic economy. Notably, Chinese authorities are preparing for the Fourth Plenum of the 20th Central Committee of the Communist Party scheduled for October 20–23, which could unlock further actions.
Interestingly, the World Bank upgraded its 2025 and 2026 GDP projections this week, citing strong consumption, resilient exports and further policy support. During next week’s annual IMF-WB meeting, the October 2025 World Economic Outlook (WEO) will be published, with a strong possibility of a similar upgrade in, partly recognizing that tariffs are probably going to be less disruptive than widely anticipated.
Additionally, the channel of communication between China and the US will be activated again, as despite numerous meetings, a comprehensive agreement is still elusive. Hence, trade-related headlines could make their way to the top of daily news reports.
Key UK jobs data, Pound is in need of a boost
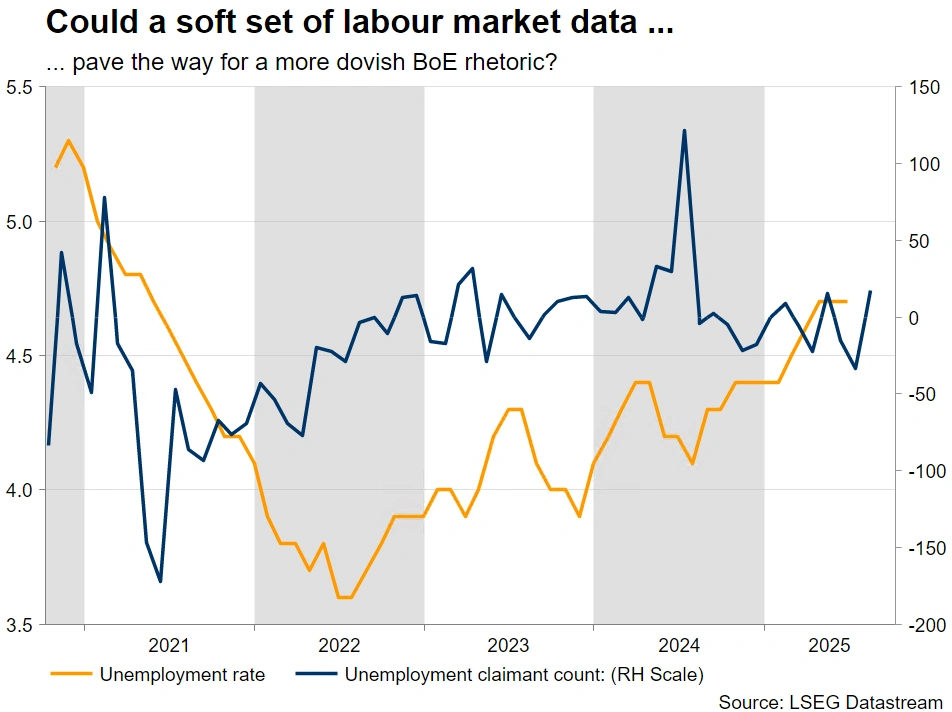
With the market confident that the early November meeting will not produce a rate move, key UK labour market data will be in the spotlight next week. Following the strong Q2 performance, momentum has probably stalled in the third quarter of 2025, as seen by monthly GDP industrial production and S&P Global PMI surveys. A negative print in Tuesday’s claimant count change could render the August positive figure an outlier to the recent improving trend.
Meanwhile, the Labour government is preparing for the late November budget, with tax increases looking unavoidable. Such an outcome might force the BoE to adopt a more dovish stance, acting as an extra headwind for the pound, which has managed to recover some of the lost ground against the euro, on the back of rising political risks in the eurozone.
Mixed fortunes for commodity currencies
While the kiwi has been underperforming against the US dollar following the surprising 50bps RBNZ rate cut, both the loonie and the aussie have fared better. Starting with the former, there have been a slight infusion of confidence following Wednesday’s US-Canada meeting about tariffs and the USMCA, putting a pause to the recent US dollar strength.
Similarly, aussie/dollar has stabilized, retracing from a one-year high, as the RBA continues to stay on the sidelines following the somewhat hawkish meeting in late September. This week’s inflation-related releases supported the RBA’s view that the inflation deceleration has slowed, with the focus now shifting to next week’s jobs data.
The RBA also believes that the “labour market conditions remain a little tight”. Thursday’s employment data could further support this view, keeping the chances of another RBA cut low and potentially boosting the aussie - especially if the US dollar weakens following the likely US government reopening and investors begin to price in softer US data.
Weekly Focus – France to Get Yet Another Prime Minister
This week was dominated by political events. On Monday, France's newly appointed Prime Minister Sébastien Lecornu resigned after just 26 days in the role, triggering yet another political crisis in the country. And on Wednesday evening, news emerged that Israel and Hamas would be ready to sign a ceasefire deal, pausing a devastating war that has lasted for two years and destabilised Middle East. Despite political news, markets were mostly calm this week with equities moving sideways and dollar stronger. France's 10-year bond yields reversed the initial increase towards the end of the week as markets were getting increasingly optimistic regarding budget talks. A new PM is set to be named soon.
Hamas and Israel have both confirmed that they have accepted Trump's peace plan. The first steps are a hostage-prisoner exchange, set to begin in coming days, and a gradual Israeli troops withdrawal from Gaza. We think the coming week will be crucial in showing whether the two sides will actually comply with what has been agreed upon, and more importantly, whether the parties can agree on the most complex follow-up steps, including Hamas disarmament and further Israeli troops withdrawal. Market reaction to a ceasefire in Middle East has been limited. Oil prices initially increased, but on Friday, Brent price fell below USD 65 per barrel. The conflict never had a direct impact on the oil market, but only an indirect one in the form of a geopolitical risk premium being priced in.
On central bank front, the Reserve Bank of New Zealand (RBNZ) cut the policy rate by 50bp on Wednesday. Both market pricing and analyst consensus were evenly divided between 25bp and 50bp cuts ahead of the meeting. FOMC September meeting minutes did not contain surprises for markets. The participants were clearly very divided in their perceptions of the inflation outlook. Minutes from the ECB September meeting were, in turn, to the dovish side. While the minutes highlighted that the bar for another rate cut remains high, they also noted that "a further rate cut in the coming months would better protect the inflation target both under the baseline and across a range of adverse scenarios".
In the US, the government remains in a shutdown, also impacting BLS data releases. It is looking unlikely that the CPI data will be released next Wednesday as scheduled. In case it will, we expect US headline inflation at 0.4% m/m in SA terms in September, and core CPI at 0.3% m/m, both slightly above consensus expectations. We have adjusted our Fed call as we think that the data blackout will tilt the central bank towards delivering another rate cut already in October. Otherwise, we stick to our profile of gradual rate cuts, read more in Reading the Markets USD - We now see Fed cuts in Oct, Jan, Apr and Jul, 7 October.
Overall, next week looks like a quiet one in terms of data. Early on Monday, China will release September trade data, which we expect to show continued robust export growth as global manufacturing is cruising ahead. On Wednesday, China will follow up with the CPI and PPI data for September. Data on credit growth is also due, but the exact release date is unknown. In euro area, focus will be on the German ZEW index on Tuesday, and final inflation print on Friday. In Japan, we will look out for the parliamentary vote on a new PM on Wednesday. In the UK, the monthly labour report will be out on Tuesday.
Canadian Employment Makes a Comeback – USD/CAD Reverses
Markets just received the Canadian labor report — and unlike the still-missing U.S. one (thanks, government shutdown), this one actually delivered. Canada added +60K jobs vs. +5K expected, a sharp rebound from last month’s -65K loss.
Even better, most of these gains came from full-time positions, signaling renewed strength in the labor market.
Being bullish on the CAD hasn’t been a winning trade this year. It’s been one of the top underperformers in FX—now only slightly ahead of the even weaker JPY—caught in the middle of a challenging macro backdrop.
As a cyclical economy, Canada cooled rapidly after its huge 2022–2023 period.
The job market softened, real estate activity slumped, and slower immigration weighed further on overall growth. Combined with tensions between Ottawa and the Trump-Administration regarding US-Canada trade, the outlook for the loonie had been anything but bright.
Oil prices (One of Canada's top export, linked to CAD performance) trending down to 5-year lows also haven't helped the Maple Dollar much.
WTI Oil actually just dipped below $60 – this may hurt US Shale producers even further and hence have less of a net-negative effect on the CAD.
Check how well Oil and the Canadian Dollar correlate throughout the years
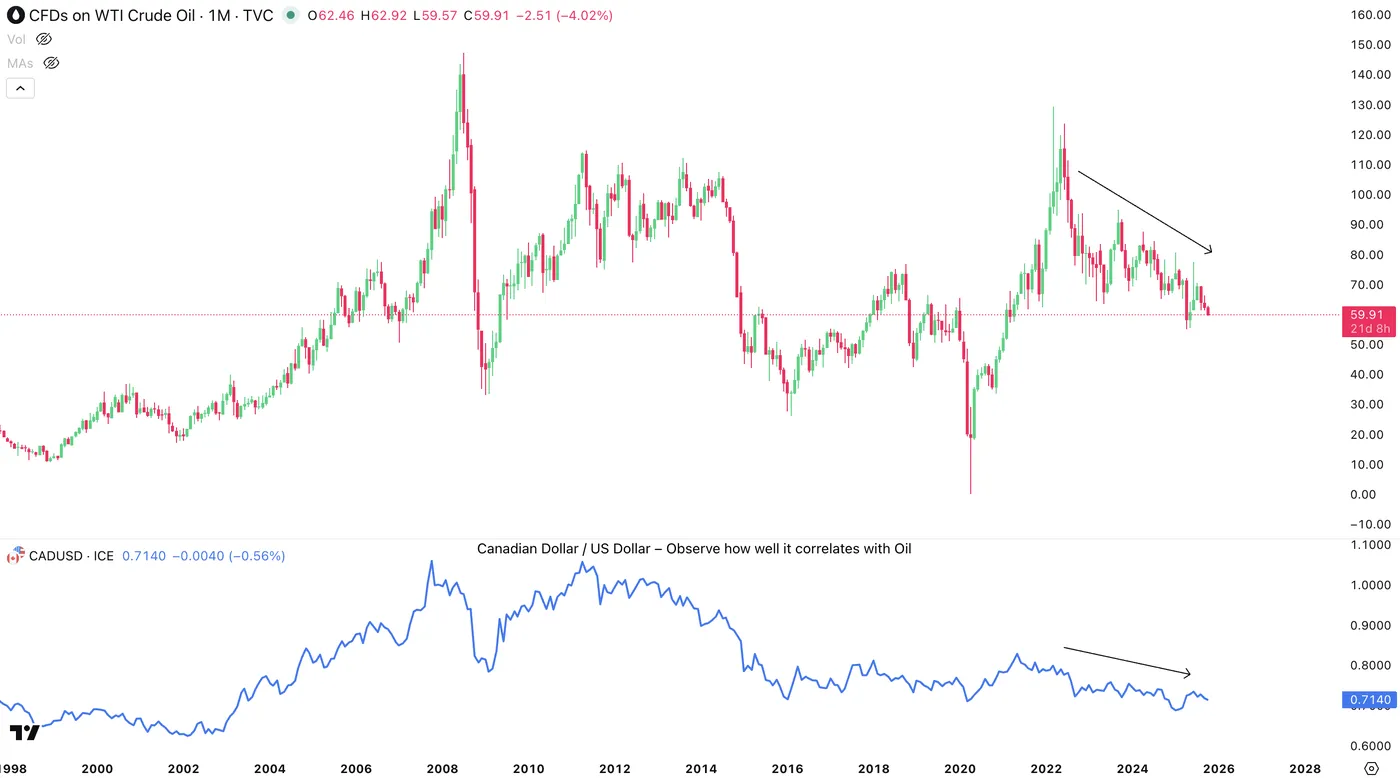
WTI Oil and CAD/USD since 1998, Source: TradingView
But things might be starting to look better
However, the ongoing Trump–Carney talks this week are reviving optimism for improved trade conditions.
Canadian trade envoy Dominic Leblanc described the talks from this week as "successful, positive, substantive", but markets are still awaiting for decisive news on tariffs, particularly on steel.
With USD/CAD testing and rejecting the 1.40 level, let’s dive into a multi-timeframe analysis to see what comes next.
USD/CAD multi-timeframe analysis
Daily Chart
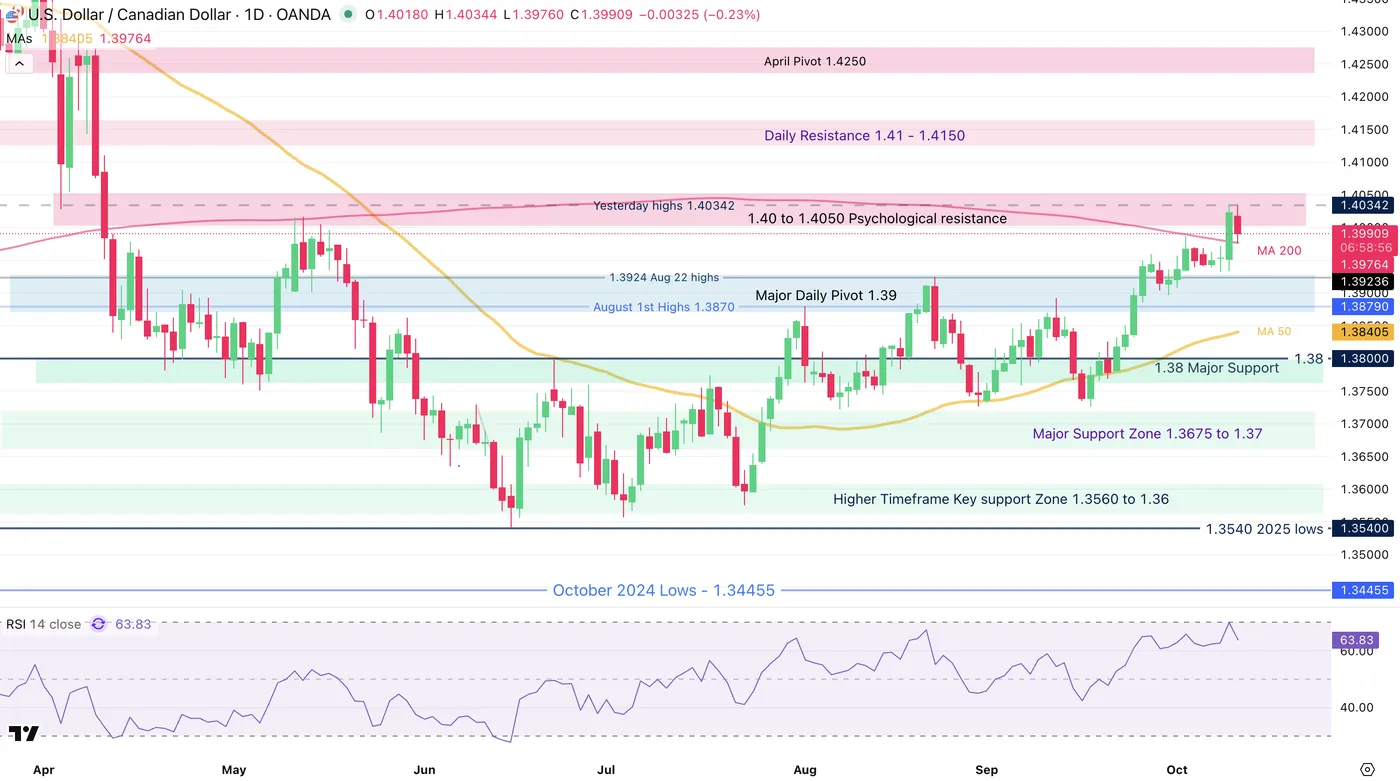
USD/CAD Daily Chart, October 10, 2025 – Source: TradingView
After bearish failure in the pair throughout multiple consolidation periods, USD/CAD has rallied in steps – Initially ranging between 1.36 to 1.38, then 1.37 to 1.39 leading to today.
Some countering elements are blurring the picture looking forward: The price action is bullish, with prices just moving above the 200-Day MA acting as immediate support.
The 1.40 level on the other hand opposes a huge psychological resistance for the pair.
The session and weekly close will be important for the pair: Anything below, traders consider that the trade outlook between US and Canada is not looking too bad.
A close above 1.40 continues the bullish trend to retest April resistances.
4H Chart and levels
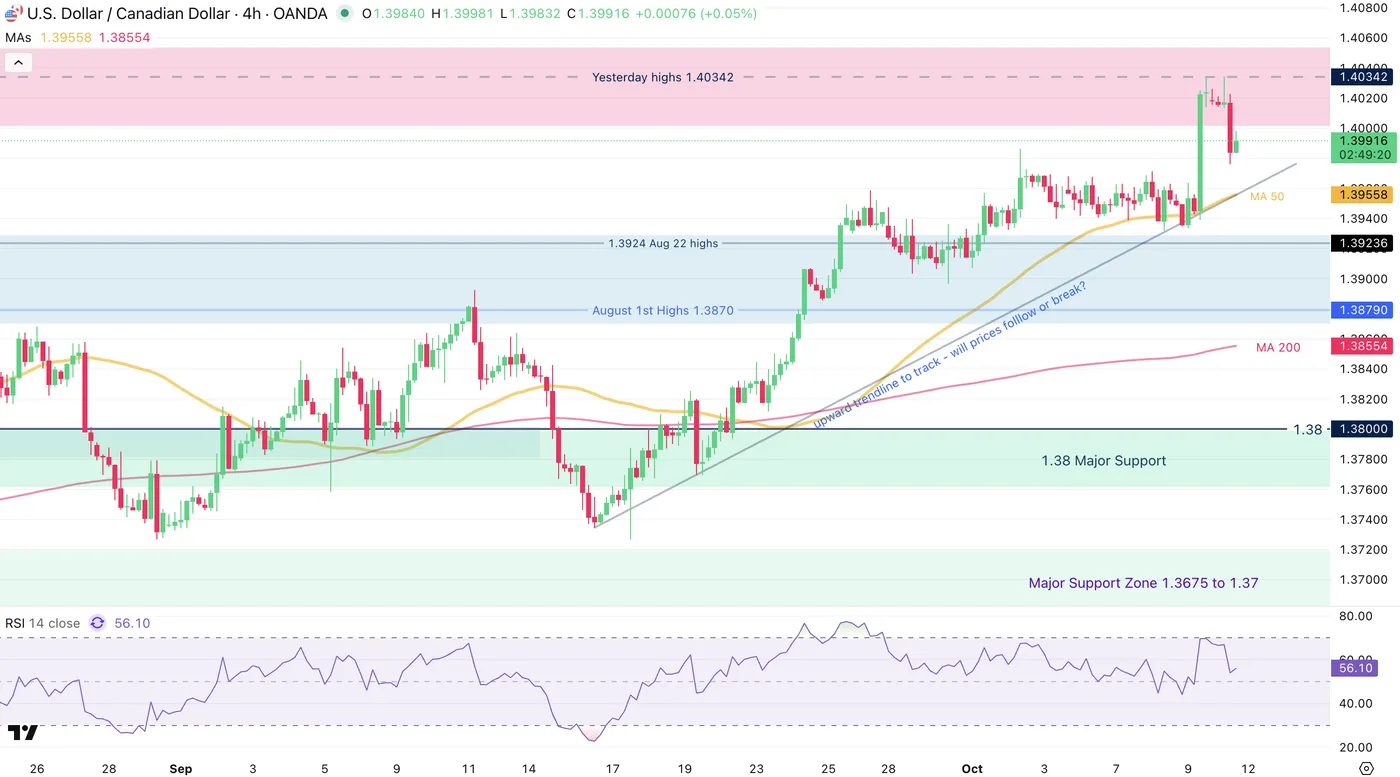
USD/CAD 4H Chart, October 10, 2025 – Source: TradingView
The latest move upward was more due to the broad US Dollar rally than pure Canadian Dollar weakness.
Loonie weakness was at the center of its low performance this year, whcih also invites to look at other CAD pairs for decent opportunities.
One can also track how prices react to a test of the 4H-MA 50 (1.39560) and upward trendline for upcoming trading.
Levels to place on your USDCAD charts:
Resistance Levels
- 1.40 to 1.4050 Psychological resistance
- Yesterday highs 1.40342
- April Resistance 1.41 - 1.4150
- April Pivotal resistance 1.4250
Support Levels
- Major Daily Pivot 1.39
- 200-Day MA 1.39750 (immediate support)
- 1.38 Major Support
- Major Support Zone 1.3675 to 1.37
- 1.3550 Main 2025 Support
1H Chart
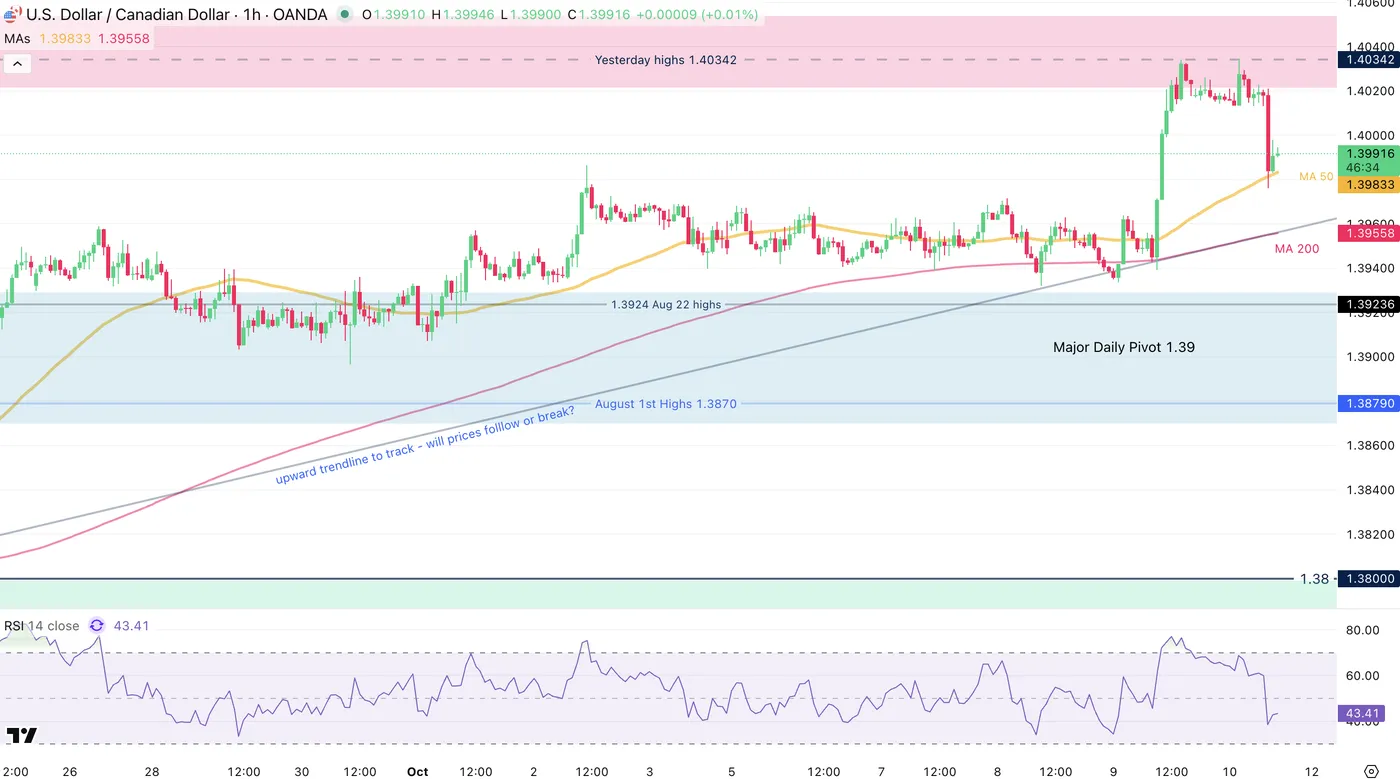
USD/CAD 1H Chart, October 10, 2025 – Source: TradingView
Looking at teh keys to the current price action, USDCAD is in the middle of some key developments.
A break above the weekly highs (1.4030) should turn into a further breakout. Odds of this are increased on a daily close above 1.40.
A break below 1.3550 could accelerate towards the 1.39 Main Pivot, key for future price action.
Any daily close below the zone (1.3880 are the lows) point to a solid re-entry within the 1.36 to 1.39 5-month range.
Safe Trades!
Sunset Market Commentary
Markets
Rating agency Moody’s publishes its verdict tonight on Belgium’s Aa3 rating review. Almost exactly one year ago, they changed the outlook on that rating from stable to negative. The decision reflected the risk that the (then) next government would be unable to implement measures to stabilize the government debt burden. In the absence of a large fiscal consolidation programme, debt will continue to rise due to the material structural increase in expenditures in recent years and persistent spending pressure. Moody’s flagged structural headwinds to fiscal consolidation and the lack of intergovernmental coordination mechanisms to achieve an effort at all levels of governments as other vulnerabilities. Looking back, the Belgian federal government aimed at a 5.4% of GDP deficit by the end of this year. Latest estimates by the Planning Bureau suggest that 5.8% of GDP is the more likely outcome, coming close to the Monitoring Committee’s worst-case scenario of 5.9%. Negotiations for the 2026 budget are currently ongoing, but we’re looking at efforts to stabilize the deficit ratio at best. PM De Wever has stated that at least €10bn in cuts would be the minimum required to meet EU expectations (4.5% of GDP deficit next year), but even within the ruling coalition this is labelled excessive. The Planning Bureau even estimates the deficit to rise again to as much as 6.5% of GDP next year due to persistent structural imbalances and spending pressures. Belgium is currently under the Excessive Deficit Procedure with the EC recommending to limit net expenditure growth to 2.5% next year in order to keep the deficit reduction path toward 3% of GDP by 2029 alive. Long story cut short, there’s a reasonable risk that the downgrade criteria from Moody’s have been met, especially with the debt ratio remaining on a rising trend towards 110% of GDP next year. Back in June, rating agency Fitch was the first to strip Belgium off its AA rating. They stressed the structural weakening of Belgium’s fiscal position over the last few years. They did the same to France in September over exactly the same reasons. Rating agency S&P gives an update on Belgium’s AA rating (negative outlook) on October 24. Both Belgium and especially France are gradually evolving to “sick men in Europe”. A quick look at swapspreads shows France (83 bps) now trading above Italy (81 bps) and Belgium (57 bps) above Spain (55 bps). We continue to see risks for more relative underperformance from Belgium and again especially France. We stick to our view that markets underestimate the risks of snap legislative elections even after Macron announces a new technocrat PM tonight. The more this becomes a market theme, the more it can weigh on the single currency in the short term. EUR/USD holds below the 1.16 handle for now with next technical support at 1.1392.
News & Views
Norwegian headline inflation quickened from -0.6% to 0.4% in September, lifting the annual print from 3.5% to 3.6%. Clothing & footwear (4% m/m), education (2.5%),communications (1.1%) and housing (0.7%) showed some of the largest price increases. Core CPI rose by 0.2% m/m. The yearly 3% that marked the first deceleration (from August’s 3.1%) in four months came as a slight downside surprise, both for consensus (3.1%) and the Norges Bank (3.2%). The central bank last month cut the policy rate to 4% but still-elevated inflation meant it saw virtually no more room for further normalization. The updated forecast indicated one move annually over the next three years. Markets slightly add to the easing bets but nevertheless expect nothing to happen at least through 2026Q1. The Norwegian krone underperforms global peers. EUR/NOK rises to 11.68.
Canadian employment growth blew away expectations, adding 60.4k jobs in September. Analysts braced for a meagre 5k after the combined 105k contraction in July & August. Full-timers more than offset a 45.6k decline in part-time jobs. The unemployment rate stabilized at a four-year high of 7.1% while the participation rate marginally recovered to 65.2% to remain amongst the lowest readings in both the pre- and post-Covid era. The better-than-expected outcome should alleviate some of the concerns at the Bank of Canada. Ottawa lowered rates to 2.5% in September. Aside from diminished upside inflation risks it referred to the two previous disappointing reports as a sign of a weakening labour market which would weigh on household spending in the months ahead. Canadian money markets assumed the BoC to cut rates more or less one more time this year but start doubting now. The market implied probability dropped from 90% to 65%. The Canadian dollar strengthens with USD/CAD dropping back below 1.40 after closing above that level yesterday for the first time since mid-April.