
Sample Category Title
AUD/USD Daily Report
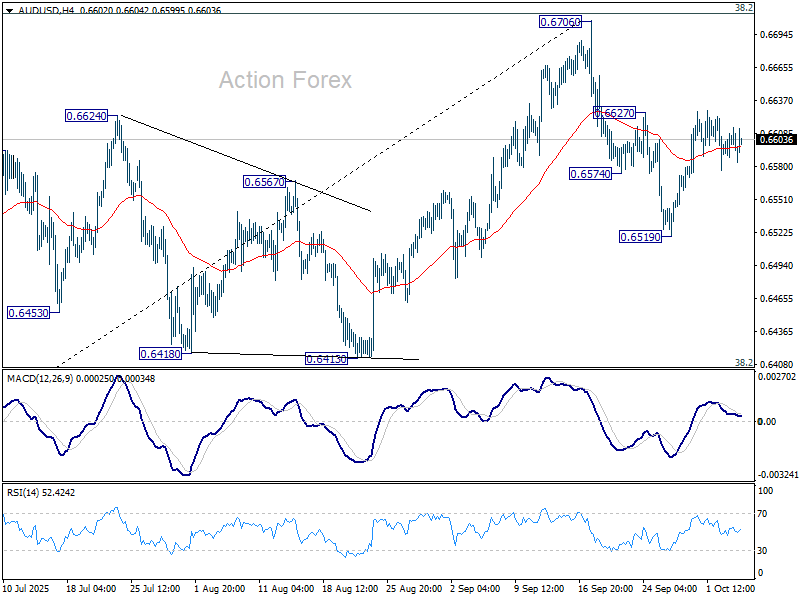
Daily Pivots: (S1) 0.6589; (P) 0.6602; (R1) 0.6614; More...
Intraday bias in AUD/USD remains neutral for the moment. On the upside, firm break of 0.6627 resistance will suggest that pullback from 0.6706 has completed as correction, after drawing support from 55 D EMA (now at 0.6554). That will keep the larger rally from 0.5913 alive and bring retest of 0.6706 high. However, on the downside, sustained trading below 55 D EMA will confirm rejection by 0.6713 fibonacci resistance, and bring deeper fall to 0.6413 cluster support (38.2% retracement of 0.5913 to 0.6706 at 0.6403).
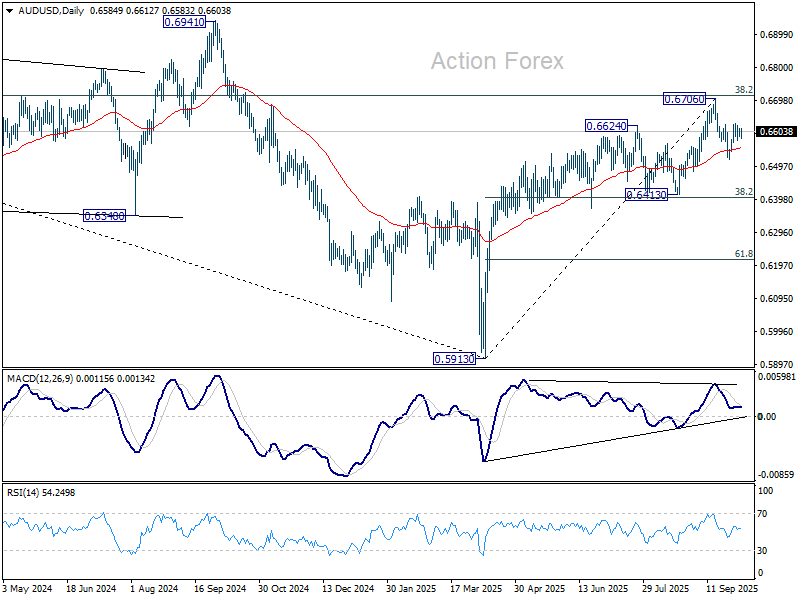
In the bigger picture, there is no clear sign that down trend from 0.8006 (2021 high) has completed. Rebound from 0.5913 is seen as a corrective move. Outlook will remain bearish as long as 38.2% retracement of 0.8006 to 0.5913 at 0.6713 holds. Nevertheless, considering bullish convergence condition in W MACD, sustained break of 0.6713 will be a strong sign of bullish trend reversal, and pave the way to 0.6941 structural resistance for confirmation.
EUR/USD Daily Outlook
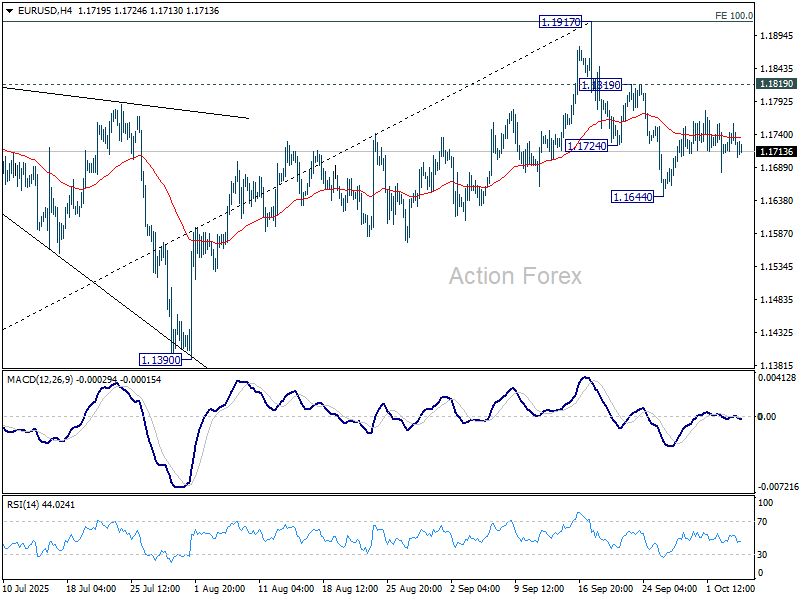
Daily Pivots: (S1) 1.1717; (P) 1.1738; (R1) 1.1763; More...
Intraday bias in EUR/USD remains neutral for the moment, and further fall is in favor as long as 1.1819 resistance holds. Break of 1.1644 and sustained trading below 55 D EMA (now at 1.1679) will indicate medium term topping at 1.1917, on bearish divergence condition in D MACD. Further fall should then be seen to 1.1390 support. Nevertheless, break of 1.1819 will retain near term bullishness and bring retest of 1.1917 high instead.
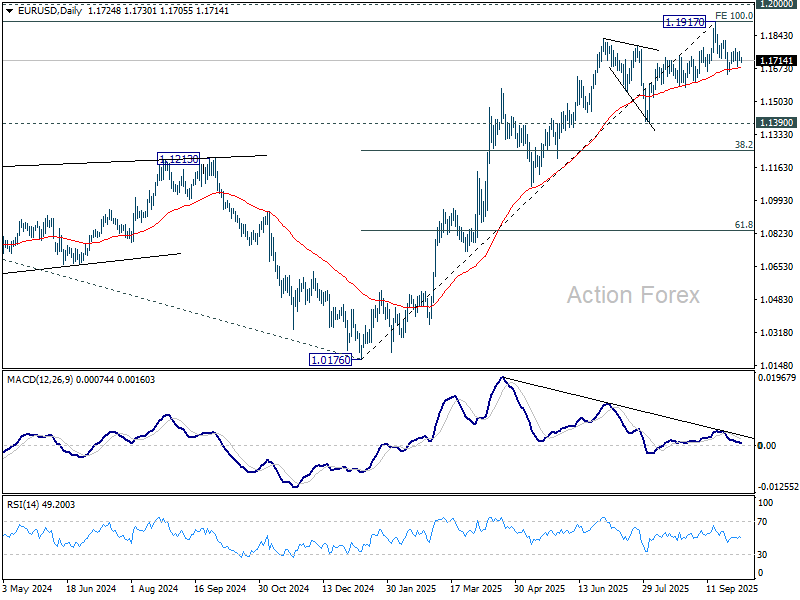
In the bigger picture, rise from 1.0176 (2025 low) is seen as the third leg of the pattern from 0.9534 (2022 low). 100% projection of 0.9534 to 1.1274 from 1.0176 at 1.1916 was already met. For now, further rally will remain in favor as long as 1.1390 support holds, and firm break of 1.2000 psychological level will carry larger bullish implications. However, firm break of 1.1390 will suggest that rise from 1.0176 has already completed and bring deeper fall to 55 W EMA (now at 1.1231).
GBP/USD Daily Outlook
Daily Pivots: (S1) 1.3438; (P) 1.3462; (R1) 1.3502; More...
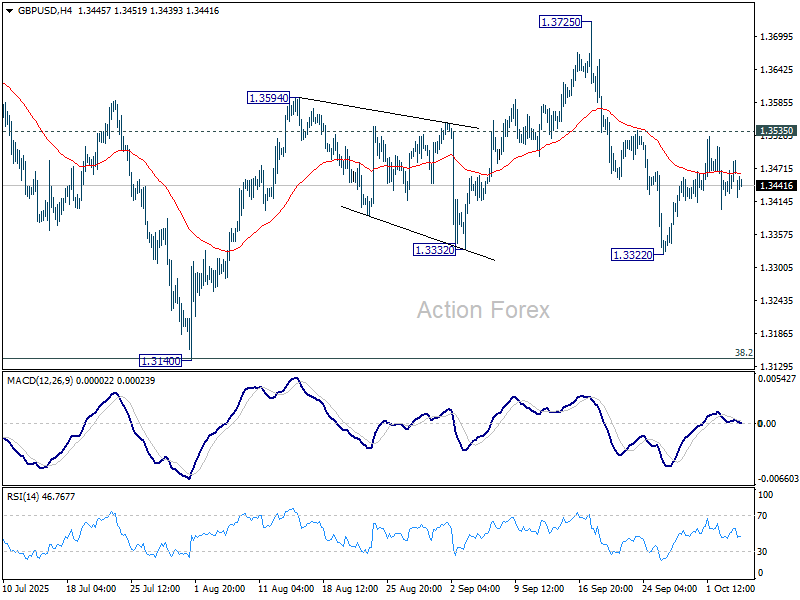
Intraday bias in GBP/USD stays neutral at this point, and further decline remains in favor. On the downside, break of 1.3322 will resume the fall from 1.3725 to 1.3140 support. On the upside, though, firm break of 1.3535 will argue that pullback from 1.3725 has already completed, and bring stronger rise to retest 1.3725/87 key resistance zone.
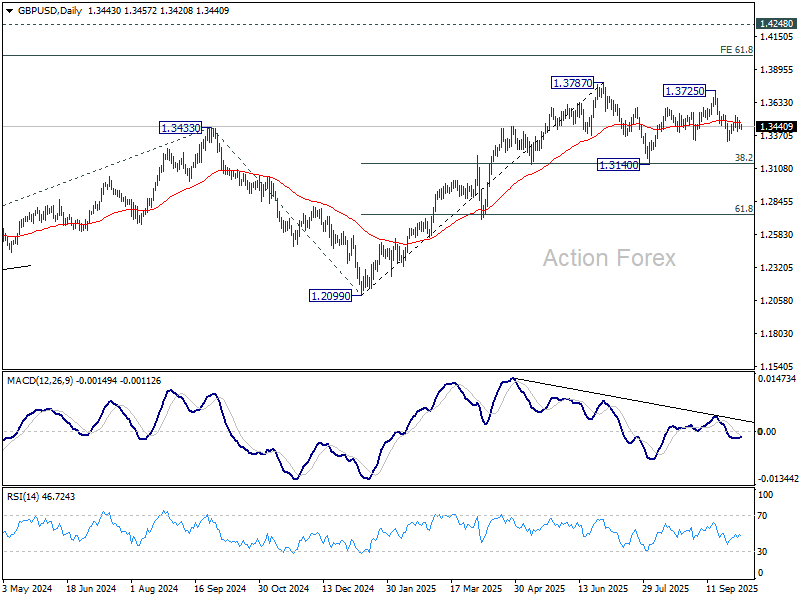
In the bigger picture, rise from 1.0351 (2022 low) is still seen as a corrective move. Further rally could be seen to 61.8% projection of 1.0351 to 1.3433 (2024 high) from 1.2099 (2025 low) at 1.4004. But strong resistance could be seen from 1.4248 (2021 high) to limit upside. Sustained break of 55 W EMA (now at 1.3166) will argue that a medium term top has already formed and bring deeper fall back to 1.2099.
USD/CHF Daily Outlook
Daily Pivots: (S1) 0.7938; (P) 0.7963; (R1) 0.7978; More…
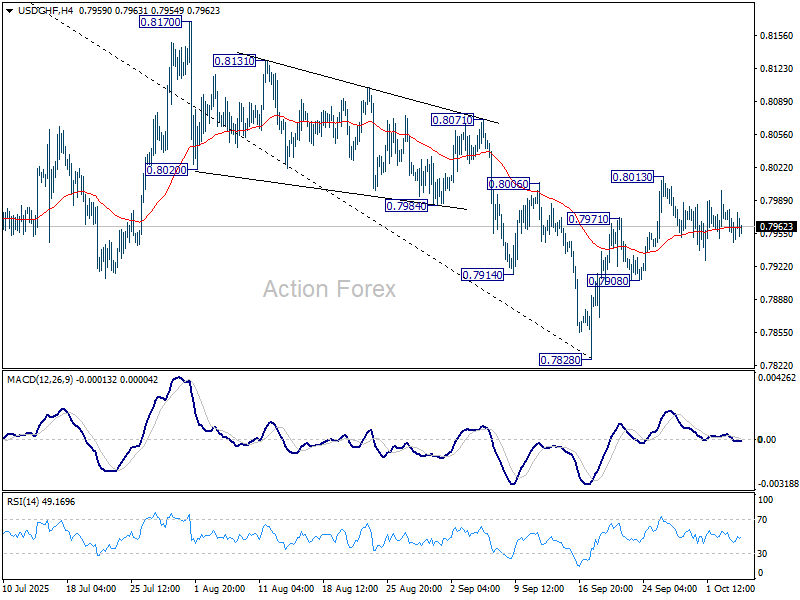
Range trading continues in USD/CHF and intraday bias remains neutral. On the upside, sustained trading above 55 D EMA (now at 0.8006) will suggest that rise from 0.7828 is already correcting whole fall from 0.9200. Further rise should the be seen to 0.8170 resistance and possibly above. However, break of 0.7908 will turn bias back to the downside for retesting 0.7828 low.
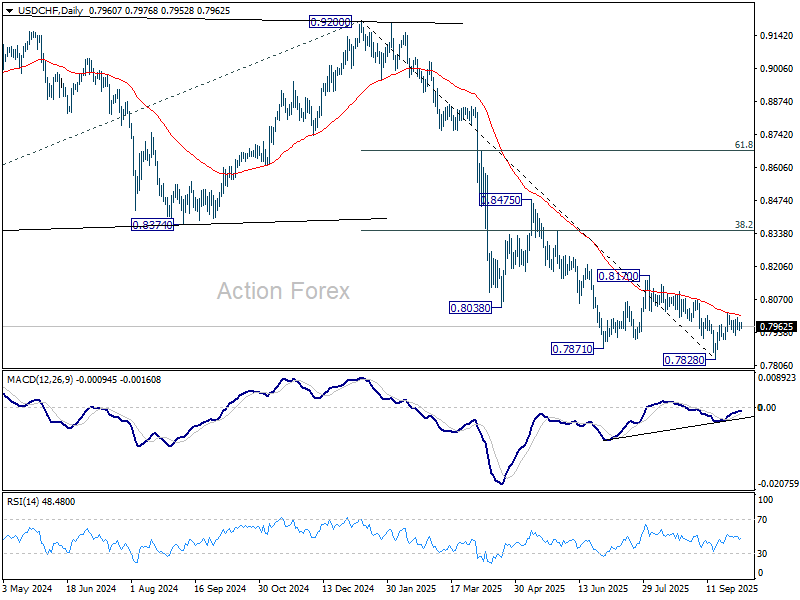
In the bigger picture, long term down trend from 1.0342 (2017 high) is still in progress. Next target is 100% projection of 1.0146 (2022 high) to 0.8332 from 0.9200 at 0.7382. In any case, outlook will stay bearish as long as 0.8332 support turned resistance holds (2023 low).
USD/JPY Daily Outlook
Daily Pivots: (S1) 147.11; (P) 147.47; (R1) 147.84; More...
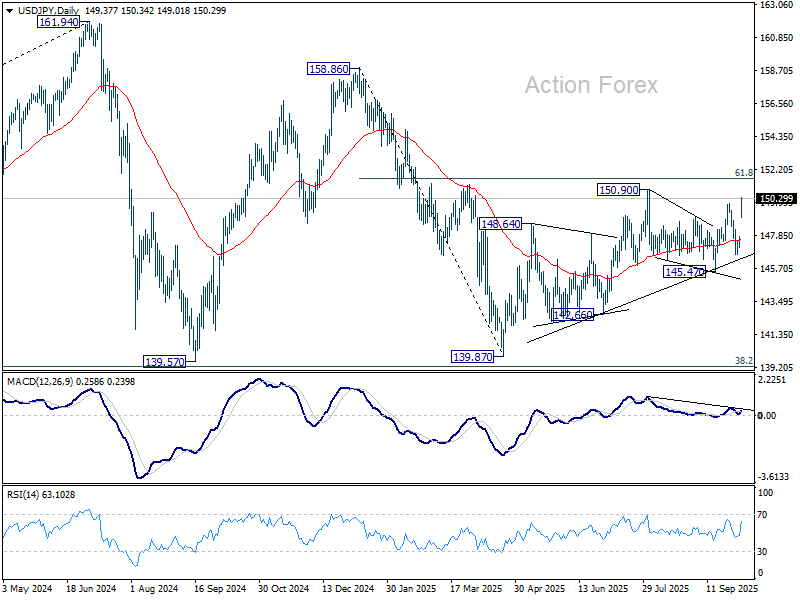
USD/JPY's strong rally and break of 149.95 resistance revived the case that corrective pattern from 150.90 has already completed at 145.47. Intraday bias is back on the upside for 150.90 first. Firm break there will resume larger rally from 139.87 to 151.22 fibonacci level. Sustained break there will carry larger bullish implication. On the downside, below 149.01 will turn intraday bias neutral again first.
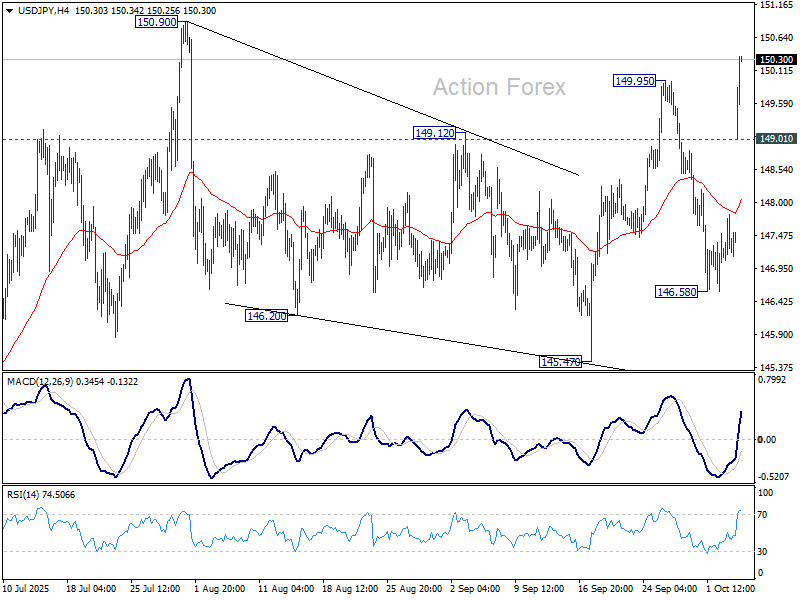
In the bigger picture, price actions from 161.94 (2024 high) are seen as a corrective pattern to rise from 102.58 (2021 low). Decisive break of 61.8% retracement of 158.86 to 139.87 at 151.22 will argue that it has already completed with three waves at 139.87. Larger up trend might then be ready to resume through 161.94 high. In case the corrective pattern extends with another fall, strong support is expected from 38.2% retracement of 102.58 to 161.94 at 139.26 to bring rebound.
Yen Nosedives as Nikkei Surges on Takaichi Optimism; Asia in Holiday Lull
Japan occupies the spotlight in otherwise subdued Asian trading, with much of the region quiet due to Mid-Autumn Festival holidays. Nikkei 225 jumped sharply to another record high, powered by euphoria surrounding Prime Minister-in-waiting Sanae Takaichi, whose pro-growth agenda and fiscal expansion plans have ignited investor optimism.
That optimism came at the expense of the Japanese Yen, which weakened broadly as traders embraced risk and pared back bets on further BoJ tightening in the near term. Renewed skepticism about the central bank’s willingness to hike again, coupled with surging equity sentiment, drove JPY to the bottom of the major currency rankings.
Elsewhere, Aussie and Kiwi outperformed, buoyed by the upbeat risk tone. New Zealand Dollar also found an additional lift after the NZIER’s RBNZ Shadow Board showed a majority calling for a 25 bps cut—not a larger move—at this week’s policy meeting.
Dollar was slightly firmer alongside the Canadian Dollar, with traders keeping one eye on the ongoing U.S. government shutdown and its potential implications. However, the moves were modest, and overall FX conditions remained rangebound amid light holiday liquidity. Among European majors, Sterling lagged, while Euro and Franc were little changed.
With the exception of pronounced Yen weakness, most pairs drifted in narrow ranges, reflecting a market caught between regional optimism and the lack of fresh catalysts ahead of the week’s key central bank updates including Fed and ECB minutes.
In Asia, at the time of writing, Nikkei is up 4.67%. Hong Kong HSI is down -0.61%. China is still on holiday. Singapore Strait Times is up 0.10%. Japan 10-year JGB yield is up 0.005 at 1.670.
Takaichi victory spurs Yen selloff; EUR/JPY targets 180
Yen tumbled sharply in the Asian session as Nikkei 225 soared over 2,000 points, or 4%, to a new record high, after the Liberal Democratic Party elected Sanae Takaichi as its new leader. Markets quickly priced in expectations that Japan’s first female prime minister will pursue aggressive fiscal stimulus and stronger coordination with the private sector to revive growth.
A Takaichi administration is widely expected to overhaul Japan’s economic framework, emphasizing investment expansion and demand creation through public–private partnerships. Her longstanding support for Abenomics-style fiscal expansion has fueled optimism for renewed spending momentum, particularly in infrastructure and industrial policy.
Traders also anticipate that Takaichi will urge the BoJ to maintain its accommodative stance, dampening expectations for further tightening in the near term. Despite recent data supporting a mildly hawkish case, policymakers may tread carefully amid heightened political and fiscal uncertainty during the leadership transition.
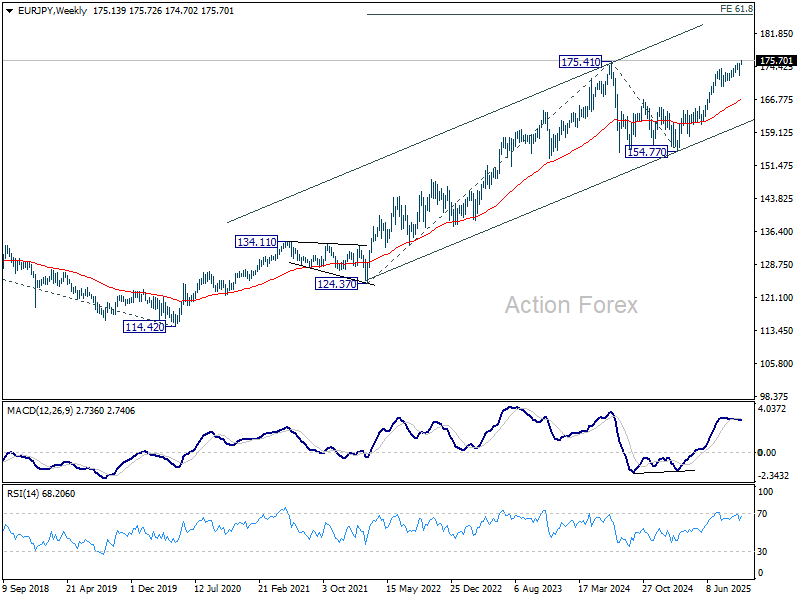
Technically, EUR/JPY broke decisively above 175.41 (2024 high), confirming the resumption of its long-term uptrend. The next target lies at 38.2% projection of 161.06 to 173.87 from 172.24 at 177.13. Firm break there will open the path to 61.8% projection at 180.15.
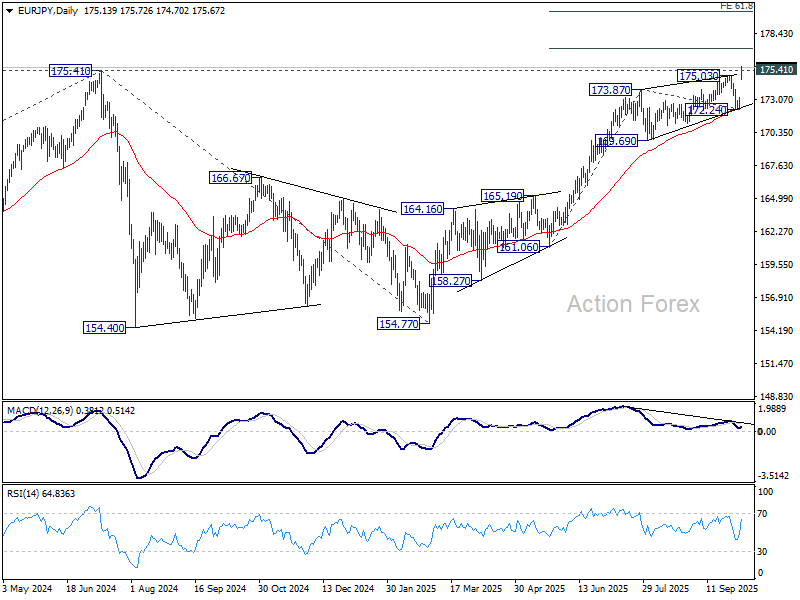
In the medium term, EUR/JPY's rise from 114.42 (2020 low) should now be heading to 61.8% projection of 124.37 to 175.41 from 154.77 at 186.31.
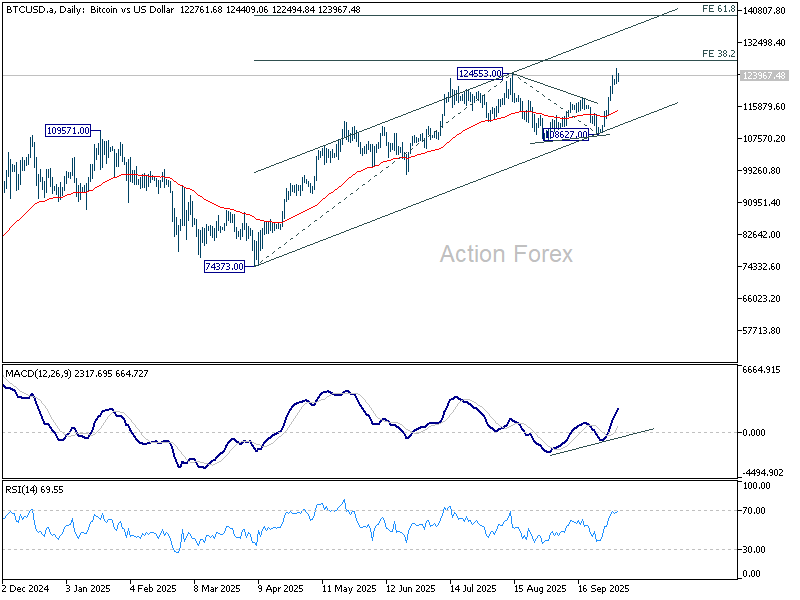
Bitcoin hits record as ‘Uptober’ hype and debasement trade drive demand
Bitcoin surged to a fresh record high over the weekend and held firm in early Asian trading. The move came as risk-on sentiment in U.S. equities spilled over into digital assets. More importantly, the latest rally also reflects a sense of seasonal optimism.
Traders are apparently leaning into Bitcoin’s well-known tendency to outperform in October — a pattern affectionately dubbed “Uptober” by crypto enthusiasts. The self-reinforcing psychology of this historical trend appears to be drawing momentum traders back into the market.
At the same time, speculation is mounting that the U.S. government shutdown could boost demand for hard assets and decentralized stores of value. Some investors see Bitcoin as part of a broader “debasement trade,” alongside Gold, amid concerns about fiscal instability.
Technically, the short-term focus is on 38.2% projection of 74,373 to 124,553 from 108,627 at 125,995. Decisive break above this level would confirm and solidify buying momentum, paving the way toward 61.8% projection at 137,838. For now, the broader outlook remains firmly bullish as long as the 108,627 support holds.
RBNZ to cut, but how deep? Fed and ECB minutes watched too
A center of focus for the week is on New Zealand, where the RBNZ’s October 8 meeting is expected to deliver another rate cut. The question isn’t whether it will ease, but by how much. After a run of dismal data and a deeper-than-expected -0.9% contraction in Q2 GDP, markets have all but concluded that policymakers must act decisively to cushion the economy.
Money markets are fully pricing a 25 bps cut to 2.75%, yet odds for a larger 50 bps move have climbed to 44.5%, up sharply from 25% a week earlier. Views among analysts remain split. Westpac stands out in projecting a half-point cut to 2.50%, arguing that the RBNZ risks falling behind the curve. Others favor a smaller, “insurance-style” move coupled with strong forward guidance signaling further easing ahead.
For traders, this meeting could be one of the most volatile in months. That policy nuance will determine how New Zealand Dollar trades post-decision. A cautious 25 bps cut with dovish tone could support Kiwi temporarily, while a surprise 50 bps move might spark a knee-jerk sell-off before stabilizing on speculations of a floor in the cycle. Either way, volatility is set to surge.
Attention will also pivot to central-bank minutes elsewhere. The Fed’s September FOMC minutes and the ECB’s meeting accounts will reveal how policymakers are parsing the impact of tariffs, inflation, and fiscal uncertainty. Together, they form the week’s macro backbone.
At the Fed, the September meeting delivered a 25 bps cut to 4.00–4.25%, with a 8–1 vote—new Governor Stephen Miran pushing unsuccessfully for a larger 50 bps move. Even dovish voices like Christopher Waller and Michelle Bowman backed the more measured option, highlighting a consensus for steady but cautious easing.
Markets will watch whether the minutes expose any growing urgency within the FOMC. While officials acknowledge that tariff-related price pressures could last longer, most agree the risks are moderate. The greater debate likely centers on labor-market slack and whether deteriorating employment data justify accelerating cuts.
Complicating matters, the U.S. government shutdown continues into its second week, delaying critical data and keeping investors blind to the economy’s near-term health. In this environment, another “insurance cut” in October looks increasingly probable, as policymakers seek to offset potential fiscal drag and uncertainty. But we'd need to hear more comments from Fed officials this week to verify this view.
Meanwhile, the ECB’s September accounts are expected to confirm that officials are broadly content with the deposit rate at 2.00%, reinforcing the sense of policy stability in Europe. The release could turn out to be a non-event.
Other key releases—Eurozone Sentix confidence, Japan’s household spending and cash earnings, Canada’s employment, and U.S. Michigan sentiment and inflation expectations—will round out the week.
Here are some highlights for the week:
- Monday: Swiss unemployment rate; Eurozone Sentix investor confidence, retail sales; UK PMI construction.
- Tuesday: Australia Westpac consumer sentiment; Japan household spending; Germany factory orders; Swiss foreign currency reserves; Canada trade balance, Ivey PMI; US trade balance.
- Wednesday: Japan labor cash earnings, current account; RBNZ rate decision; Germany industrial production; FOMC minutes.
- Thursday: Germany trade balance; ECB meeting accounts.
- Friday: New Zealand BNZ manufacturing; Japan PPI; Swiss SECO consumer climate; Canada employment; US U of Michigan consumer sentiment.
USD/JPY Daily Outlook
Daily Pivots: (S1) 147.11; (P) 147.47; (R1) 147.84; More...
USD/JPY's strong rally and break of 149.95 resistance revived the case that corrective pattern from 150.90 has already completed at 145.47. Intraday bias is back on the upside for 150.90 first. Firm break there will resume larger rally from 139.87 to 151.22 fibonacci level. Sustained break there will carry larger bullish implication. On the downside, below 149.01 will turn intraday bias neutral again first.
In the bigger picture, price actions from 161.94 (2024 high) are seen as a corrective pattern to rise from 102.58 (2021 low). Decisive break of 61.8% retracement of 158.86 to 139.87 at 151.22 will argue that it has already completed with three waves at 139.87. Larger up trend might then be ready to resume through 161.94 high. In case the corrective pattern extends with another fall, strong support is expected from 38.2% retracement of 102.58 to 161.94 at 139.26 to bring rebound.
EUR/USD On Shaky Ground – Recovery Looks Fragile As Bears Lurk Nearby
Key Highlights
- EUR/USD is attempting to recover from 1.1650.
- A major bearish trend line is forming with resistance near 1.1750 on the 4-hour chart.
- GBP/USD is also correcting losses but faced hurdles near 1.3525.
- Gold extended gains and rallied above $3,880.
EUR/USD Technical Analysis
The Euro declined below 1.1720 against the US Dollar before the bulls appeared. EUR/USD tested 1.1650 and recently started a recovery wave.
Looking at the 4-hour chart, the pair recovered above 1.1700 and 1.1750 before it faced resistance. A high was formed at 1.1778 and the pair is now consolidating below the 100 simple moving average (red, 4-hour).
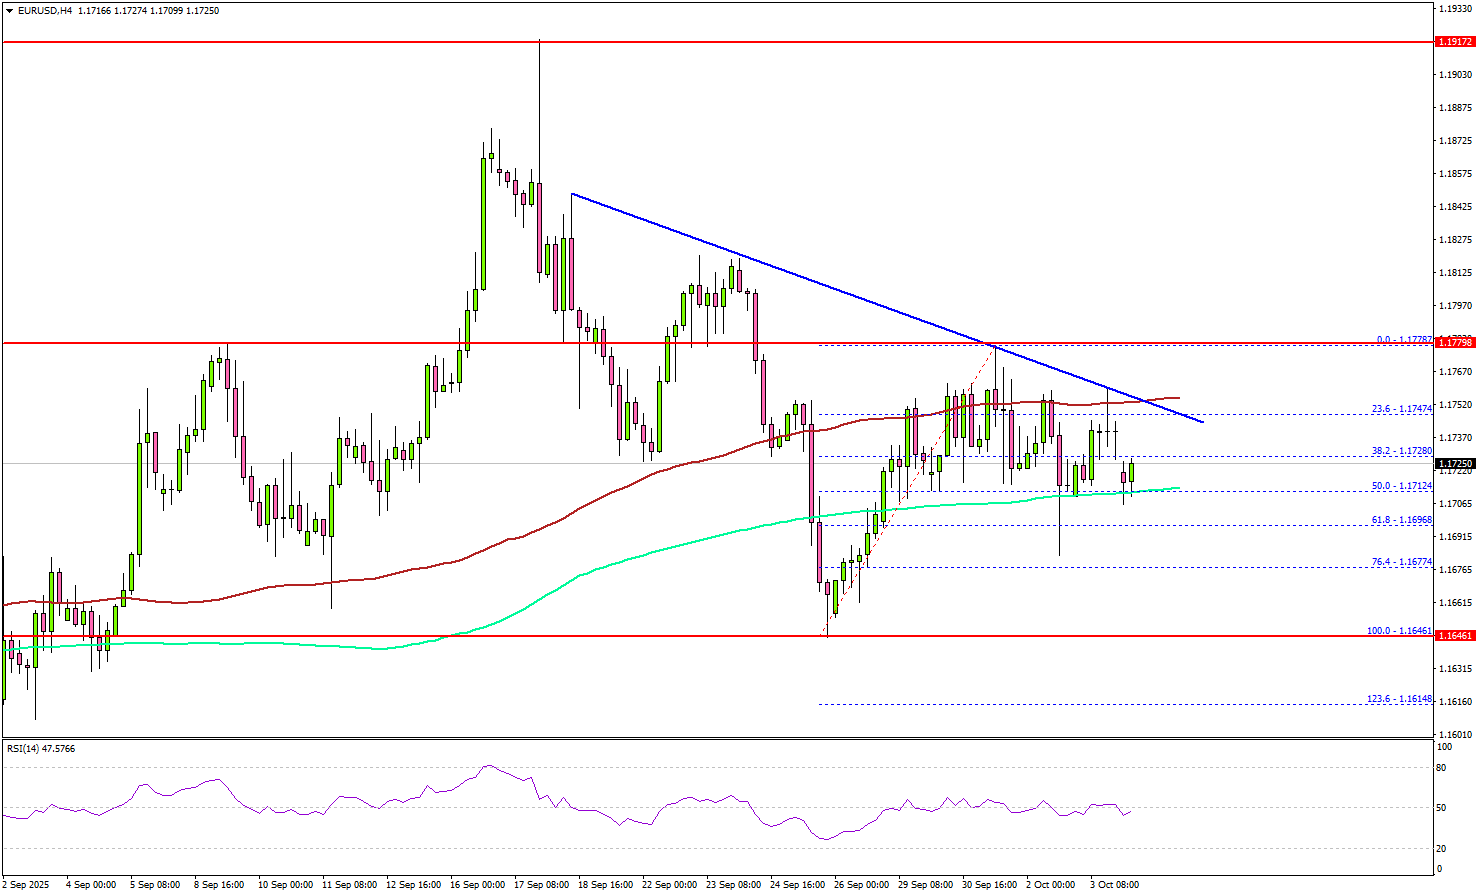
Besides, there is a major bearish trend line forming with resistance near 1.1750. A clear move above 1.1750 could send the pair toward the 1.1780 resistance.
The main hurdle could be near 1.1820. A close above 1.1820 could open the doors for a fresh increase. If not, EUR/USD could decline again. On the downside, there is key support at 1.1710 and the 200 simple moving average (green, 4-hour).
The next area of interest might be 1.1665. The main support could be 1.1650. Any more losses might increase selling pressure and send the pair toward 1.1580.
Looking at GBP/USD, the pair attempted to recover, but the bears are still active below the 1.3525 resistance level.
Upcoming Key Economic Events:
- ECB's President Lagarde speech.
- BoE's Governor Bailey speech.
Bitcoin hits record as ‘Uptober’ hype and debasement trade drive demand
Bitcoin surged to a fresh record high over the weekend and held firm in early Asian trading. The move came as risk-on sentiment in U.S. equities spilled over into digital assets. More importantly, the latest rally also reflects a sense of seasonal optimism.
Traders are apparently leaning into Bitcoin’s well-known tendency to outperform in October — a pattern affectionately dubbed “Uptober” by crypto enthusiasts. The self-reinforcing psychology of this historical trend appears to be drawing momentum traders back into the market.
At the same time, speculation is mounting that the U.S. government shutdown could boost demand for hard assets and decentralized stores of value. Some investors see Bitcoin as part of a broader “debasement trade,” alongside Gold, amid concerns about fiscal instability.
Technically, the short-term focus is on 38.2% projection of 74,373 to 124,553 from 108,627 at 125,995. Decisive break above this level would confirm and solidify buying momentum, paving the way toward 61.8% projection at 137,838. For now, the broader outlook remains firmly bullish as long as the 108,627 support holds.
Takaichi victory spurs Yen selloff; EUR/JPY targets 180
Yen tumbled sharply in the Asian session as Nikkei 225 soared over 2,000 points, or 4%, to a new record high, after the Liberal Democratic Party elected Sanae Takaichi as its new leader. Markets quickly priced in expectations that Japan’s first female prime minister will pursue aggressive fiscal stimulus and stronger coordination with the private sector to revive growth.
A Takaichi administration is widely expected to overhaul Japan’s economic framework, emphasizing investment expansion and demand creation through public–private partnerships. Her longstanding support for Abenomics-style fiscal expansion has fueled optimism for renewed spending momentum, particularly in infrastructure and industrial policy.
Traders also anticipate that Takaichi will urge the BoJ to maintain its accommodative stance, dampening expectations for further tightening in the near term. Despite recent data supporting a mildly hawkish case, policymakers may tread carefully amid heightened political and fiscal uncertainty during the leadership transition.
Technically, EUR/JPY broke decisively above 175.41 (2024 high), confirming the resumption of its long-term uptrend. The next target lies at 38.2% projection of 161.06 to 173.87 from 172.24 at 177.13. Firm break there will open the path to 61.8% projection at 180.15.
In the medium term, EUR/JPY's rise from 114.42 (2020 low) should now be heading to 61.8% projection of 124.37 to 175.41 from 154.77 at 186.31.