Sample Category Title
ECB’s Lagarde: Disinflation over, range of risks narrow
ECB President Christine Lagarde told a European Parliament’s committee that the Eurozone’s "disinflationary process is over", with inflation now hovering around 2% and expected to remain near target over the medium term. She said this backdrop justified the Governing Council’s recent decision to keep interest rates unchanged.
Lagarde noted that risks to economic growth have become "more balanced", as the likelihood of severe tariff-related downside shocks has eased following the trade deal. Still, she warned that renewed trade tensions could weigh on exports, investment, and consumption, while persistent geopolitical uncertainty continues to cloud the outlook for both growth and prices. On the positive side, Lagarde highlighted that higher defence and infrastructure spending and productivity-boosting reforms could support growth momentum ahead.
She also emphasized that the inflation outlook remains "more uncertain than usual", reflecting the “still volatile global trade policy environment” that poses both upside and downside risks. However, she added that the "range of risks on both sides has narrowed" as new data arrives.
Her comments are interpreted as confirmation that the ECB remains firmly on hold, awaiting clearer signals before considering any recalibration of its policy stance.
EURNZD Analysis: Bullish Sequence Targets Further Rally From Lows
Hello traders and welcome to a new blog post. In this one the spotlight will be on the EURNZD currency pair. This pair has been in a long-term bullish sequence since February 2017. Thus, it makes for an interesting instrument to add to the watch list. Is a setup imminent?
EURNZD continues to rise in a long-term bullish sequence from April 2015. Consequently, the long-term target lies between 2.1620 and 2.3900. However, the bullish cycle from February 2017 is corrective. It retraces the bearish impulse that unfolded between February 2009 and April 2015.
Eventually, when this long-term bullish phase ends, the pair should resume the broader bearish trend from February 2009. Still, traders should avoid trying to pick the top. Doing so is like catching a falling knife. Instead, it is safer to trade with the trend. Therefore, traders can keep buying alongside the ongoing corrective phase until the price reaches the 2.1620–2.3900 area, where bearish risk will likely grow stronger.
EURNZD Elliott Wave Analysis- Long term view
The first leg of the corrective cycle began in April 2015 and ended in March 2020, forming a double zigzag. Hence, it is labeled as wave (w) of the supercycle degree on the weekly chart shared with ElliottWave-Forecast.com members. Next, the connector wave (x) of the same degree fell from March 2020 to April 2022. From there, the third leg—wave (y)—started to advance. Interestingly, this wave (y) is unfolding as another double zigzag structure.
Wave w of (y) ended in August 2024, followed by wave x of (y) in September 2024. From that low, wave ((W)) of y of (y) finished at the April 2025 peak. Soon after, wave ((X)) ended the following month. Since then, a clean impulse has started for wave (A) of ((Y)) of y of (y). It extended to a new high within the larger cycle from February 2009. The H4 chart below highlights the sub-waves of wave (A).
EURNZD H4 Chart Analysis
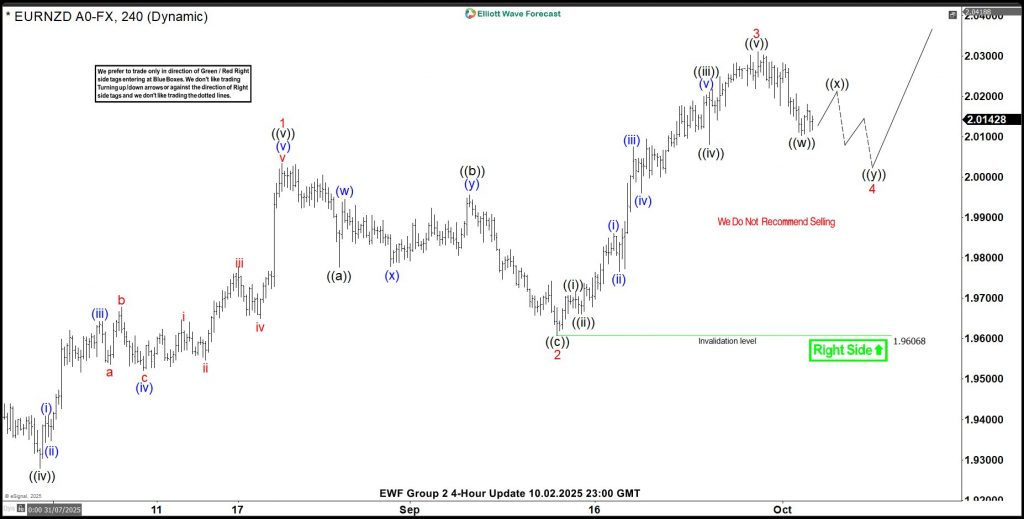
The EURNZD H4 chart above shows waves 1, 2, 3, and 4 of wave (A). Admittedly, this count could be interpreted in two or three different ways. However, every trader can agree on one thing — the pair is in a clear impulsive sequence. Since the February 2009 cycle has not yet reached its extreme, traders can still look for long opportunities from the extremes of a 3, 7, or 11-swing pullback. Moreover, selling such a strong bullish market is not ideal.
Therefore, the ongoing pullback in wave 4 could provide another excellent buying opportunity, especially near the extreme of a possible 7-swing structure. We will continue to monitor this setup and mark the blue box area, where buyers can look to enter with defined stops.
Members know the blue box highlights the high-probability buy zone and the ideal area to place protective stops.
OPEC + Delivers Modest Output Hike, Brent Crude Rises 1.7%. What Next for Oil Prices?
Oil prices have risen at the start of the week after the Organization of the Petroleum Exporting Countries and its allies (OPEC +) once again delivered what I would call a strategic under-delivery of the expected output hike.
OPEC+ announced a modest production increase following their recent meeting, agreeing to raise output by 137,000 barrels per day (bpd).
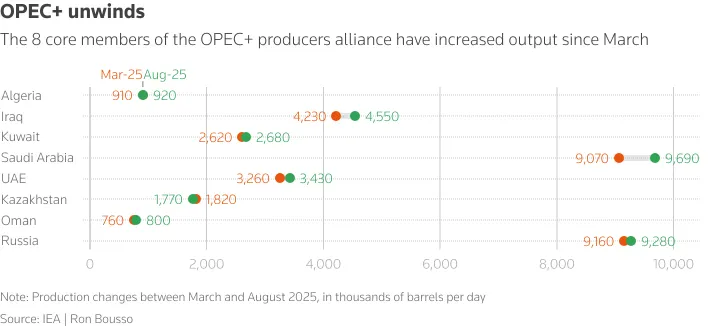
Source: LSEG
What Does the OPEC + Decision Tell Us?
The rise in production may be a signal that OPEC + cares more about keeping supply tight than grabbing extra market share or making oil cheaper for buyers.
I for one had been of the school of thought that the increases were partly down to a desire by the group to gain more market share. However, I am beginning to doubt my own narrative.
A bump of about 137,000 barrels per day may seem almost nothing in a world that moves millions, yet it holds some psychological weight.
It may be read as a small give‑in to political and market pressure while therefore holding members to a disciplined output plan.
By choosing a lift below what many expected, OPEC+ probably tried to dodge a sudden plunge a supply surge could cause.
Moreover, this defensive stance suggests a stable price floor remains especially crucial for budget health for the member economies.
Decoding the Price Action: A Rally Based on Relief, Not Demand Strength
Brent crude settled a little above the $65 per barrel line, around $65.30, a level many traders watch as a mental barrier. This jump in price is similar to the one we saw after the last OPEC + meeting, but more from a sigh of relief in the market.
Market participants' worries about a “big rise” in supply appear to have eased after the group announced its output decision. The less than expected output increase may have led some to cover short exposure to Oil prices which could in part be behind the rally. The rally was nonetheless welcomed after last week's 8% decline.
Navigating a Potential Structural Surplus Moving Forward
While OPEC+ successfully managed short-term price volatility, the longer-term outlook remains shadowed by significant structural bearishness. Market sentiment continues to be fundamentally weighed down by "ongoing concerns about oversupply projected into 2026".
That worry comes mostly from big rises in non‑OPEC output, like the surge in US shale rigs in Texas and new offshore wells off Brazil. Those sources sit outside the cartel’s cap system, so OPEC+ ends up fighting a tactical cut war while the rest of the world keeps adding barrels.
The International Energy Agency tossed out a figure that a record surplus could show up in 2026. If that number sticks, it backs the idea that growth in oil production will beat demand.
Prices have slipped year‑to‑date, and a bigger surplus could push them even lower. That would leave OPEC+ with little room to breathe. They may need to carve deep cuts, hurting their own members, to stop prices from falling below the target zones. Yet, some claim a softer approach, hoping demand‑side shifts could balance things out.
Technical Analysis - Brent Crude
From a technical analysis standpoint, Brent Crude is back above the $65/barrel mark with upside likely to remain limited.
There is a host of hurdles just ahead of current price with the 20,50 and 100-day MAs all resting between the 66.71 and 67.58 handle.
This confluence zone may prove a tough nut to crack and may cap any attempt at a move higher for Oil prices.
Looking at the downside, immediate support below the 65.00 handle may be found at the swing low printed on May 30 which rests at 62.60.
Below that, the next key point of interest will be the psychological 60.00 mark which could offer support should price reach those levels.
Brent Crude Oil Daily Chart, October 6, 2025
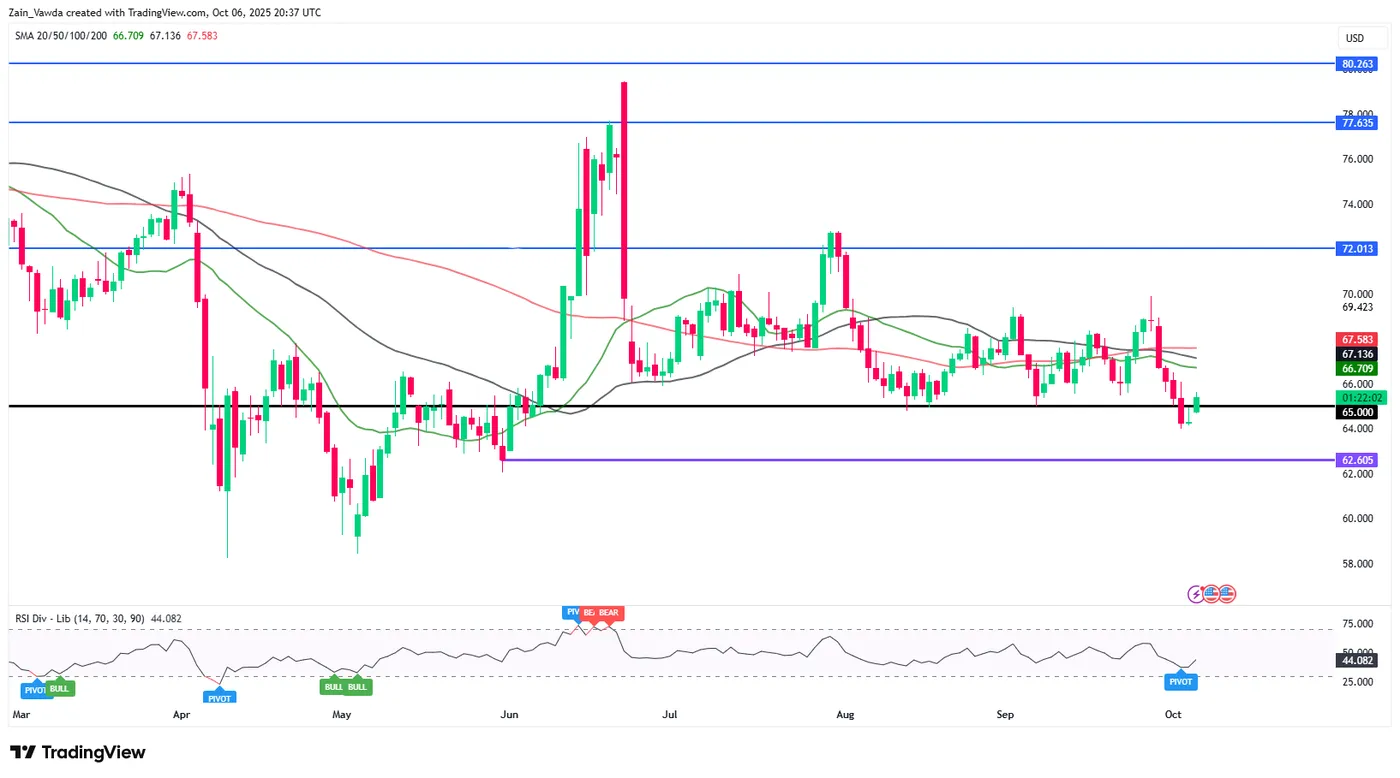
Source: TradingView (click to enlarge)
Gold (XAU/USD) Set to Challenge $4,000 as Prices Renew All-Time Highs in Today’s Session – Potential Targets and Price...
In today’s session, gold (XAU/USD) trades at $3960 per troy ounce, up an astounding +1.91%, and has yet again comfortably renewed all-time highs.
With gold pricing up over 50% year-to-date, markets now turn their gaze to the key level of $4,000, having only rallied above $3,000 for the first time in history less than seven months ago.
As ever, let’s take a look at some of the macro themes affecting precious metal markets, alongside some likely price targets for this week’s trading.
Gold (XAU/USD): Key takeaways 06/10/2025
- While wind has remained in the sails of precious metals for much of 2025, news of the US government has provided further tailwind to the current rally, with heightened market uncertainty boosting gold prices north of $3950
- A higher level of market conviction regarding the Federal Reserve’s path to further rate cuts is also boosting gold pricing, with some sources reporting a 92.5% probability that US interest rates will be cut again in the upcoming decision
- Otherwise, a persistent feeling of market uncertainty, particularly concerning worldwide sovereign debt, adds to the current precious metals premium
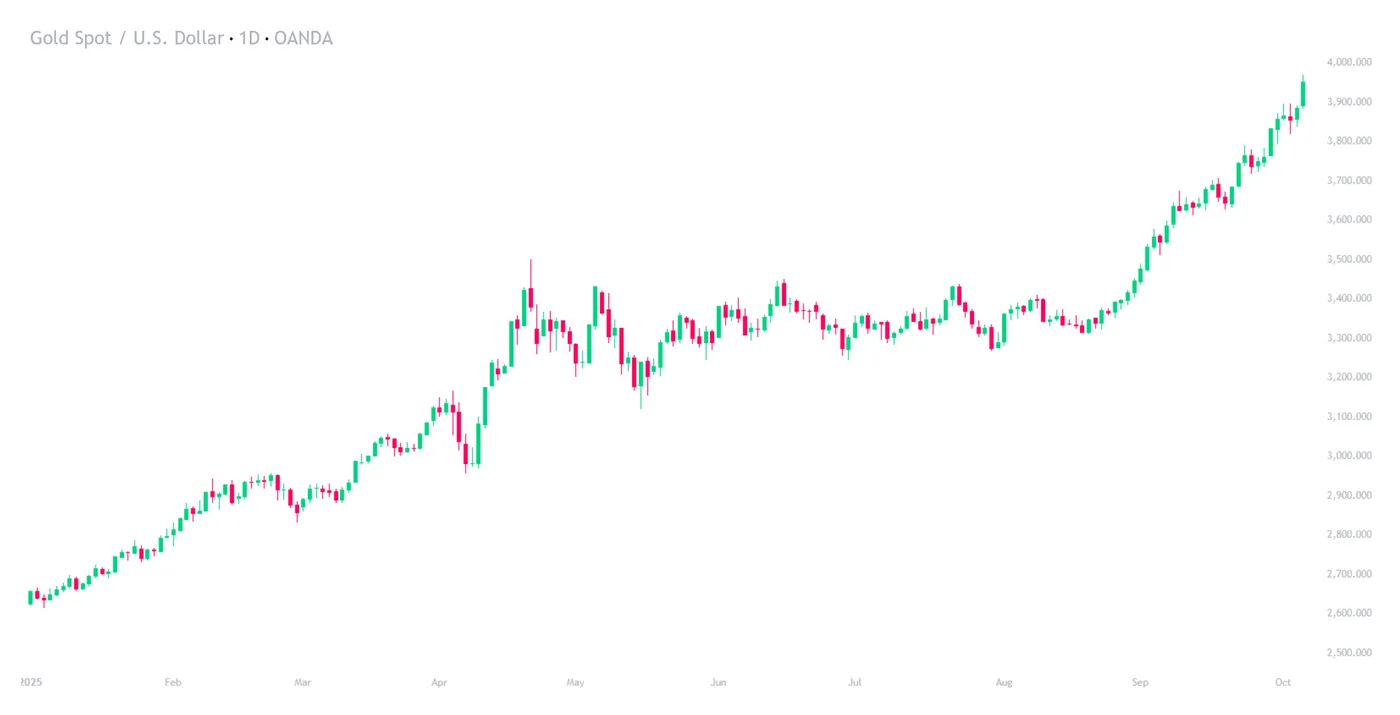
Gold (XAU/USD) YTD, OANDA, TradingView, 06/10/2025
Gold blasts above $3,900, posting fresh all-time highs
Another day, another session, and another all-time high for the world’s favourite yellow metal
Bar one major exception, the fundamental analysis picture for gold remains virtually unchanged from last week’s coverage, with markets remaining demonstrably bullish.
While gold and silver pricing continue to impress, let’s break down some significant developments in the last seven days, and, most importantly, how bullion trades within touching distance of $4,000 for the first time in history:
US government shutdown: While there will be no prizes for those who correctly predicted the aforementioned exception would be the recent shutdown of the US government, major disruption to the US federal government has proven, somewhat predictably, incredibly positive for gold pricing.
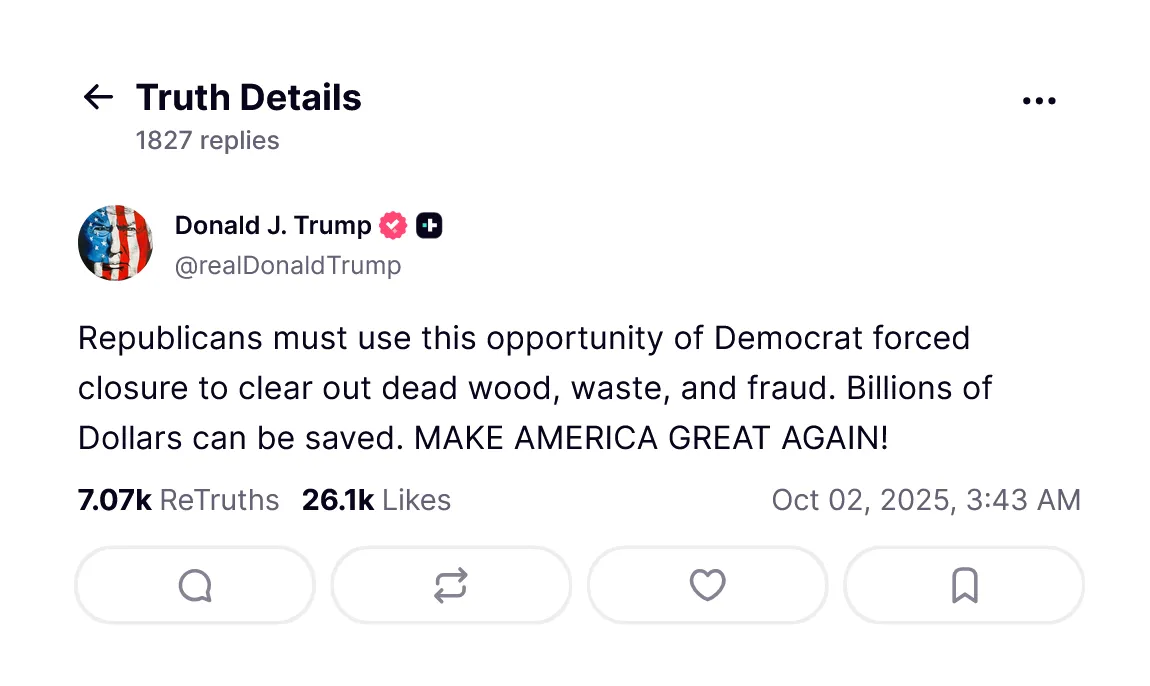
@realDonaldTrump, Truth Social, 02/10/2025
While the recent Senate disagreement is not the first time, dare I say, nor the last, that Republicans and Democrats have clashed over government funding, the event is the first of its kind in over six years, adding to a growing feeling of market uncertainty.
Market conviction on Federal Reserve easing path: Defying the odds of a staunchly hawkish Federal Reserve for much of 2025, gold has still rallied to new highs multiple times this year. While an increasingly dovish Federal Reserve has been the prevailing narrative for some time, most notably signified by a reduction in interest rates in their September decision, markets are now more convinced than ever that a second rate cut will follow in October, directly benefiting precious metal pricing.
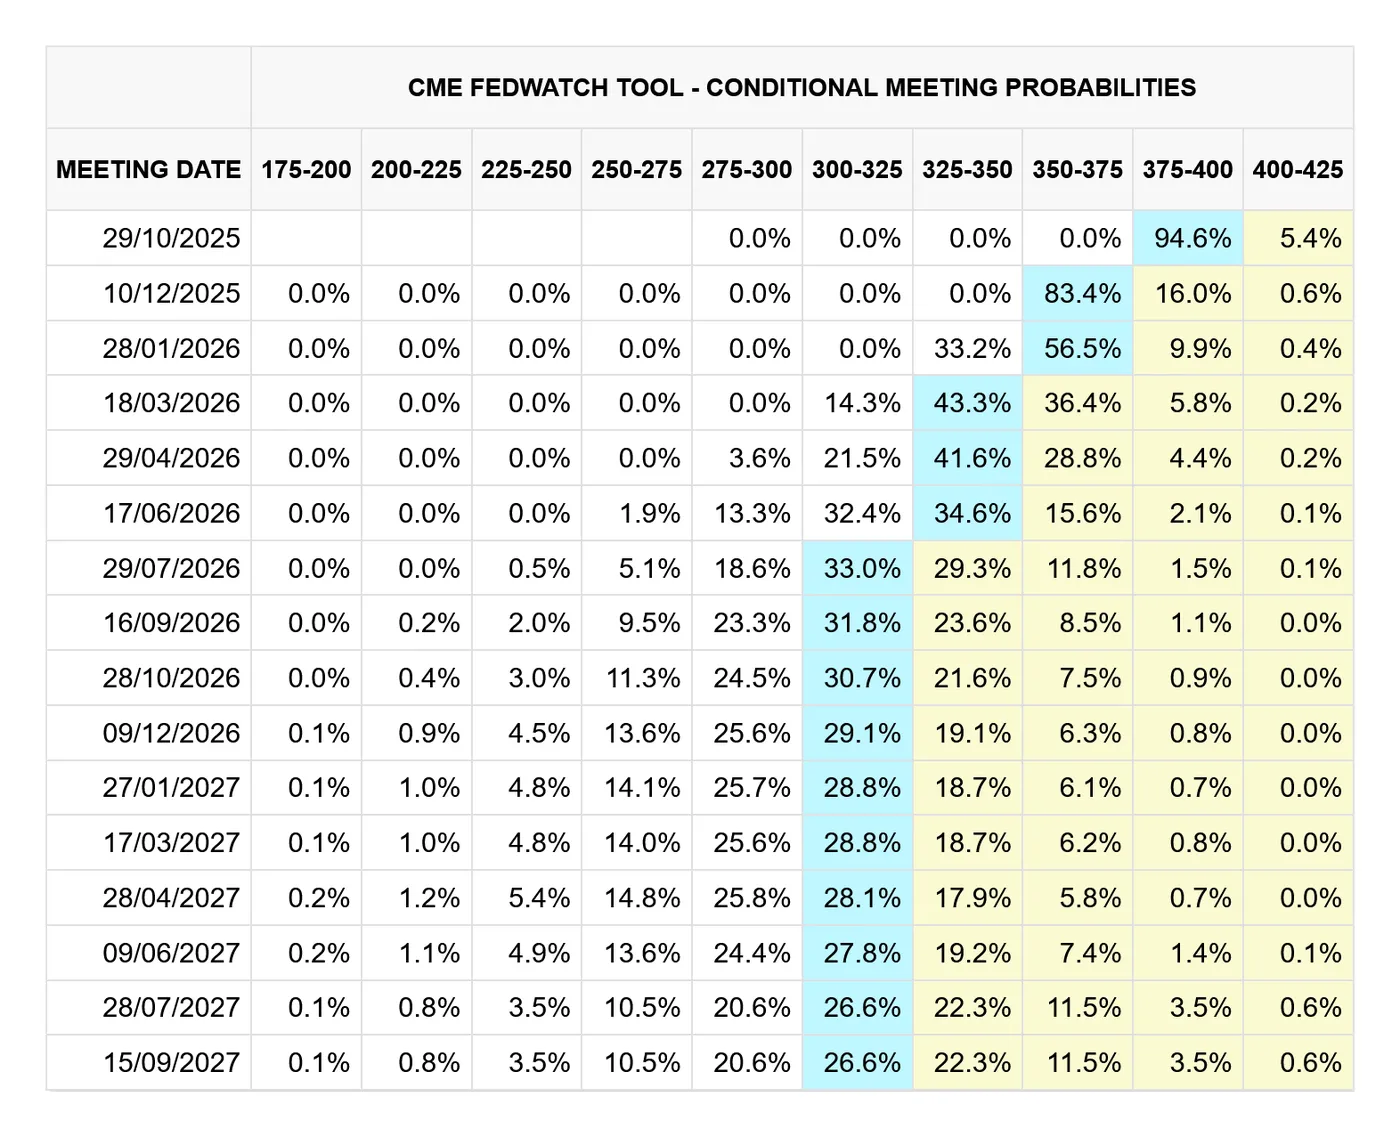
CME FedWatch, 06/10/2025
To add a further level of complication, and owing to the aforementioned government shutdown, key economic data reports like nonfarm payrolls, CPI, and PCE have been suspended until further notice, which puts the Federal Reserve in an unenviable position if it wishes to maintain its mandate of ‘both stable prices and maximum sustainable employment’, effectively flying blind. This goes double when considering that extended periods of shutdown can significantly hinder economic performance, providing further rationale for a potential rate reduction.
Put simply, the Federal Reserve’s shift from hawkish to dovish has removed a prominent anchor to current precious metal upside, pushing the existing rally even higher.
Gold (XAU/USD): Technical Analysis 06/10/2025
Shifting our focus to market technicals, let’s begin by examining the monthly chart, then move on to the daily.
Gold (XAU/USD): Weekly (W) chart analysis (06/10/2025):
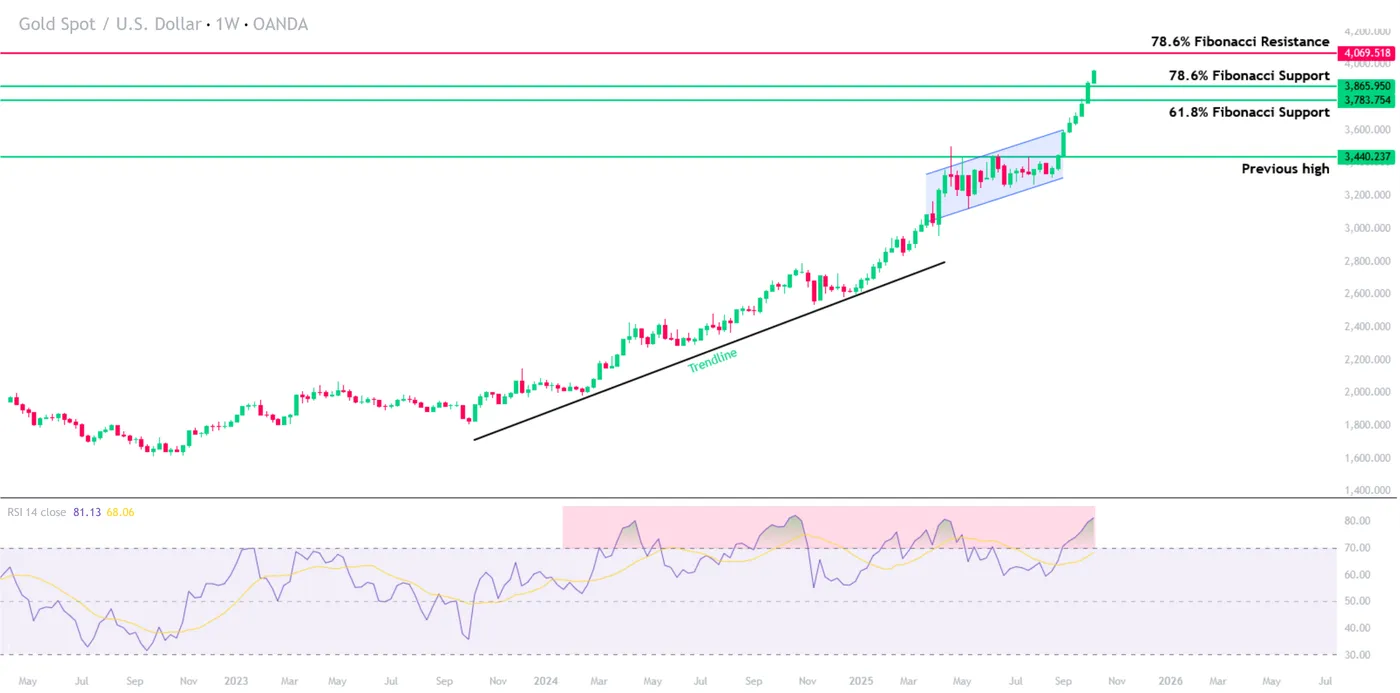
Gold (XAU/USD) W, OANDA, TradingView, 06/10/2025
If I had shown you this chart unlabelled, one would be forgiven for thinking this was the five-minute chart, especially considering the past eight candles or so.
While sustained upside, as shown above, is rare on the weekly chart, gold bulls will undoubtedly be pleased with recent performance, with price action virtually parabolic.
Having broken out of an upwards channel, with the upper boundary held around $3,602, what followed was an explosive move to the upside, marking fresh all-time highs.
While no candlestick structure to the upside could otherwise offer resistance, traders should be aware that a short-term correction remains possible, with the RSI reporting gold pricing as ‘overbought’ for the fourth time this year.
Otherwise, should price stage a move higher, we can expect some profit-taking at the key level of $4,000.
Price targets and support/resistance levels:
- Price target 1: Key psychological level: $4,000
- Price target 2: 78.6% Fib: $4,096
- Support 1: 78.6% Fib: $3,866
- Support 2: 61.8% Fib: $3,783
- Support 3: Previous high: $3,440
While it seems remiss to mention a potential for bearish momentum all things considered, a fall below the 9-day moving average, currently held at $3,629, could encourage bears, albeit few in number at present.
Gold (XAU/USD): Daily (D1) chart analysis (06/10/2025):
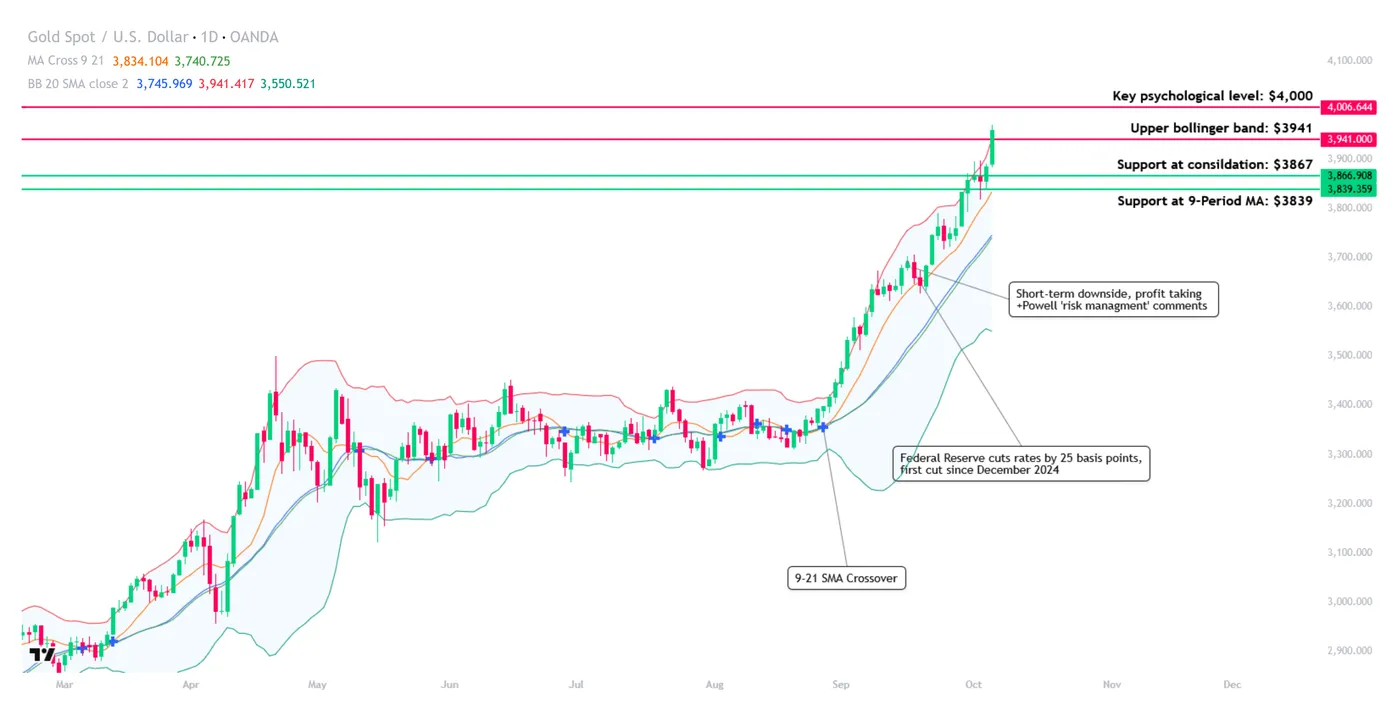
Gold (XAU/USD) D1, OANDA, TradingView, 06/10/2025
At the current pace markets are moving, gold could stage a serious challenge for $4,000 in the next few days.
Price targets and support/resistance levels:
- Price target 1: Key psychological level: $4,000
- Resistance 1: Upper Bollinger band limit: $3,941
- Support 1: Consolidation: $3,867
- Support 2: 9-period Ma: $3,839
With the current upside bookmarked by a 9-21 MA crossover, price is currently testing the upper limit of the 20-day Bollinger band, suggesting a period of consolidation or a retracement towards the baseline is likely to follow recent bullish momentum.
If prices do retrace, traders would be well-advised to confirm the response at key levels of support, offering a potential entry point for those looking to enter a long position.
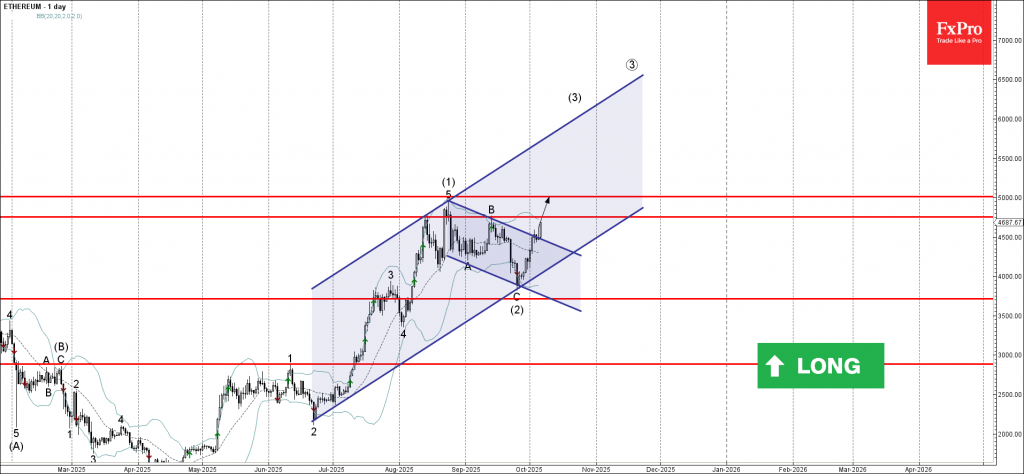
Ethereum Wave Analysis
Ethereum: ⬆️ Buy
- Ethereum broke daily down channel
- Likely to rise to resistance levels 4755.00 and 5000.00
Ethereum cryptocurrency recently broke the resistance trendline of the daily down channel from the end of August (which encloses the previous intermediate ABC correction (2)).
The breakout of this down channel accelerated the active intermediate impulse wave (3) – which started earlier from the round support level 4000.00.
Given the clear daily uptrend, Ethereum cryptocurrency can be expected to rise to the next resistance level 4755.00 (top of the earlier wave B) – the breakout of which will open the way for further gains toward 5000.00.
Sunset Market Commentary
Markets
France and Japan were a rude awakening to markets lulled to sleep by very low volatility on FI and FX markets. Asia’s third largest economy is on track to have its first female prime minister in history after the LDP chair elections this weekend. Sanae Takaichi’s reputation as a fiscal dove is a blessing for local stock markets but a nightmare for government bonds, particularly at the long end of the curve. Add a central bank in tightening mode (both rate hikes and QE tapering) and already above-target inflation and you have rates cranking up 15 bps (40-year tenor). The 30-year maturity (+14 bps) closed at a record high. European bonds are caught in the crossfire. France stands out following prime minister Lecornu’s unexpected resignation in the early morning. He just announced his new government. But basically being a copy paste of the previous one under Bayrou it prompted a backlash, not only from opposition parties that he needs for his minority government to survive, but also from within. Lecornu felt he wouldn’t be able to navigate much-needed fiscal consolidation through such a fractured, dysfunctional parliament. President Macron has three options: call new elections (1), appoint yet another prime minister (2) or resign himself (3). (1) risks stripping established parties (including his own) from even more voters to the benefit of the likes of Rassemblement National, (2) is Einstein insanity and (3) is just not an option Macron is really considering. The bottom line is that if there’s ever going to be fiscal consolidation, it will be watered down to meaningless efforts. The deadline for a budget is next week Monday but won’t be met in this universe, meaning France will have to resort to emergency measures. French credit risk premia (vs swap) rise to the highest level since January this year. We spot spillovers to the likes of Belgium, which faces a similar daunting budget task. German yields add up to 3 bps with the rise only temporarily interrupted by safe haven flows. Treasuries and Gilts join the trend lower. US yields add 1.2-3.2 bps in a steepener. UK yields top that slightly by rising 1.3-4.5 bps across the curve. JPY and EUR are today’s laggards in the FX landscape. EUR/JPY briefly shot up beyond 176 for the first time ever before paring gains to the July 2024 record close of 175.11. USD/JPY returned from above 150 to below (a threshold which one of Takaichi’s advisors said is undesirable for JPY to weaken beyond). The pair is still trading 2 big figures higher than Friday’s close though. The French impasse weighs EUR/USD down to just south of 1.17. The weaker euro allows GBP to benefit marginally (EUR/GBP around 0.87). European stock markets cope well with the bout of uncertainty. The EuroStoxx50 slid around 1% but pared losses to just 0.15%. The French CAC40 underperforms (-1.3%). WS opens mixed.
News & Views
The Czech statistical of published preliminary CPI data for September. Prices decreased a faster than expected 0.6% M/M slowing the yearly figure 2.3% (was +0.1% M/M and 2.5% Y/Y in August). The consensus expected -0.3% M/M and 2.6% Y/Y. Food prices were 0.6% lower compared to August (2.9% Y/Y from 4%), energy prices declined 0.7% M/M (-3.3% Y/Y vs -4.4%). Goods prices fell 0.4% M/M to be 0.8% higher Y/Y (was 1.1% Y/Y in august). Services prices were 0.9% lower M/M but this left the y/y measure unchanged at 4.7% as season factors were in play. In its summer economic forecast, the Czech National Bank (CNB) expected September inflation at 2.6% Y/Y. The Czech 2-y swap yield declines 5 bps. It’s too early to draw conclusions for CNB policy. An important part of the better outcome was due to volatile food and energy prices and the CNB will take the impact of a potentially more stimulative fiscal policy into consideration in the wake of the outcome of this weekend’s parliamentary elections. The Czech korona eases modestly today, trading near EUR/CZK 24.31 compared to a 24.26 close on Friday.
The Bank of Japan today released its quarterly report on the country’s regional economies. All nine regions reported that their respective economies had been recovering moderately, picking up, or picking up moderately, although some weakness had been seen in part. However, the assessment from one region (Hokkaido) was slightly downwardly revised. In press conference after a branch manager meeting held today, the manager of the Osaka branch indicated that there was not enough information available on the wage growth, which is a key parameter for BoJ policy. ‘Wage increases will likely continue as a trend, due to structural labour shortages. But it's hard to know what will happen in next year's wage talks, as the impact of tariffs on corporate profits will only start to show from now on," Kazuhiro Masaki, said.
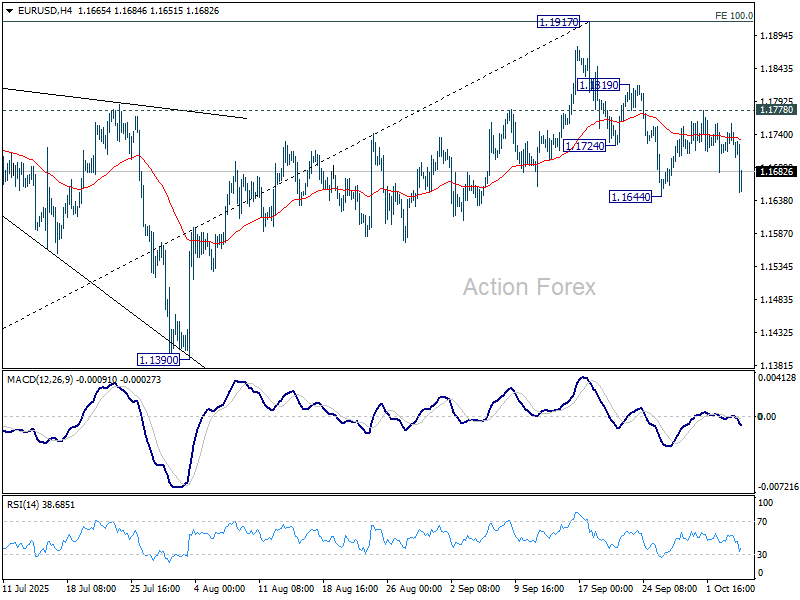
EUR/USD Mid-Day Outlook
Daily Pivots: (S1) 1.1717; (P) 1.1738; (R1) 1.1763; More...
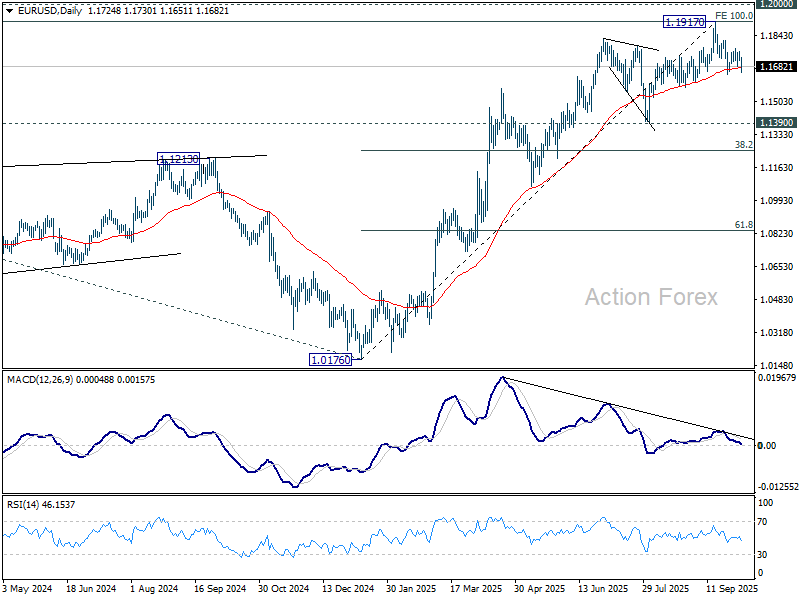
EUR/USD falls notably today but stays above 1.1644 support. Intraday bias remains neutral first. On the downside, break of 1.1644 and sustained trading below 55 D EMA (now at 1.1679) will indicate medium term topping at 1.1917, on bearish divergence condition in D MACD. Further fall should then be seen to 1.1390 support. Nevertheless, break of 1.1778 resistance will retain near term bullishness and bring retest of 1.1917 high instead.
In the bigger picture, rise from 1.0176 (2025 low) is seen as the third leg of the pattern from 0.9534 (2022 low). 100% projection of 0.9534 to 1.1274 from 1.0176 at 1.1916 was already met. For now, further rally will remain in favor as long as 1.1390 support holds, and firm break of 1.2000 psychological level will carry larger bullish implications. However, firm break of 1.1390 will suggest that rise from 1.0176 has already completed and bring deeper fall to 55 W EMA (now at 1.1265).
GBP/USD Mid-Day Outlook
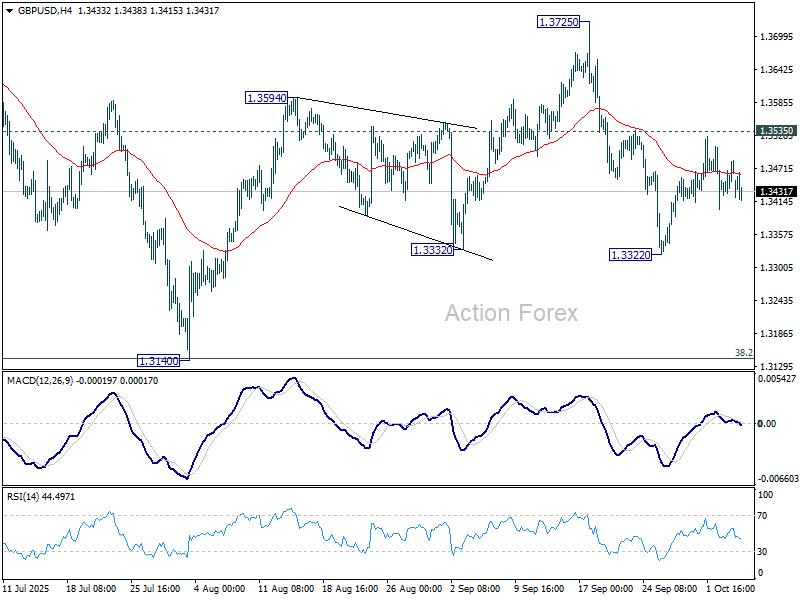
Daily Pivots: (S1) 1.3438; (P) 1.3462; (R1) 1.3502; More...
Intraday bias in GBP/USD remains neutral and further decline is still in favor. On the downside, break of 1.3322 will resume the fall from 1.3725 to 1.3140 support. On the upside, though, firm break of 1.3535 will argue that pullback from 1.3725 has already completed, and bring stronger rise to retest 1.3725/87 key resistance zone.
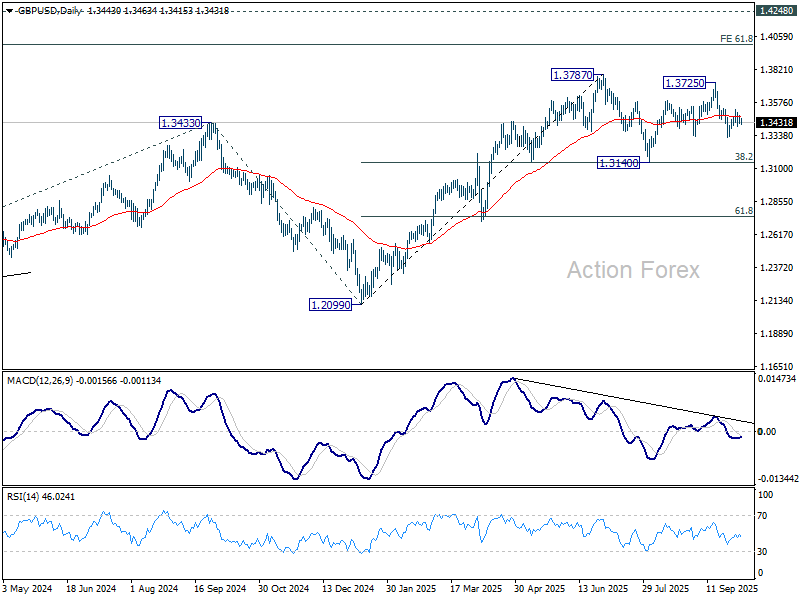
In the bigger picture, rise from 1.0351 (2022 low) is still seen as a corrective move. Further rally could be seen to 61.8% projection of 1.0351 to 1.3433 (2024 high) from 1.2099 (2025 low) at 1.4004. But strong resistance could be seen from 1.4248 (2021 high) to limit upside. Sustained break of 55 W EMA (now at 1.3176) will argue that a medium term top has already formed and bring deeper fall back to 1.2099.
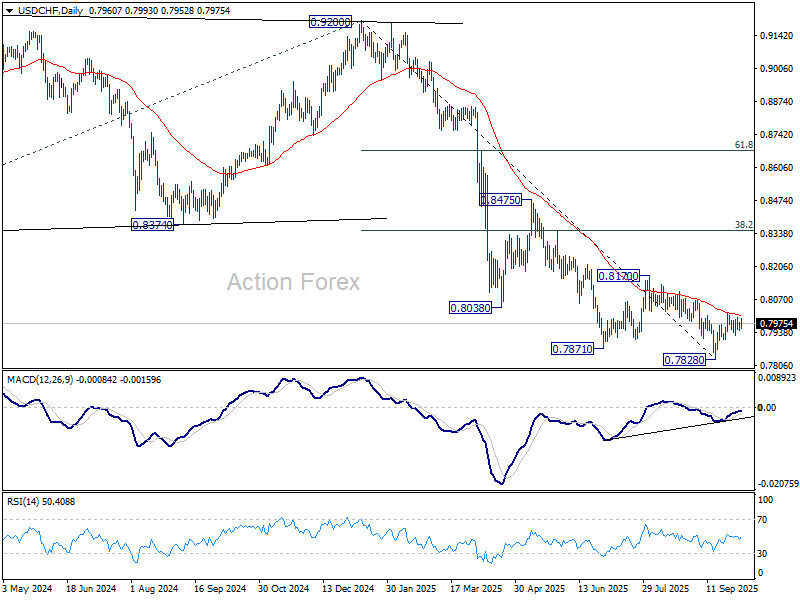
USD/CHF Mid-Day Outlook
Daily Pivots: (S1) 0.7938; (P) 0.7963; (R1) 0.7978; More…
Intraday bias in USD/CHF stays neutral at this point. On the upside, sustained trading above 55 D EMA (now at 0.8006) will suggest that rise from 0.7828 is already correcting whole fall from 0.9200. Further rise should the be seen to 0.8170 resistance and possibly above. However, break of 0.7908 will turn bias back to the downside for retesting 0.7828 low.
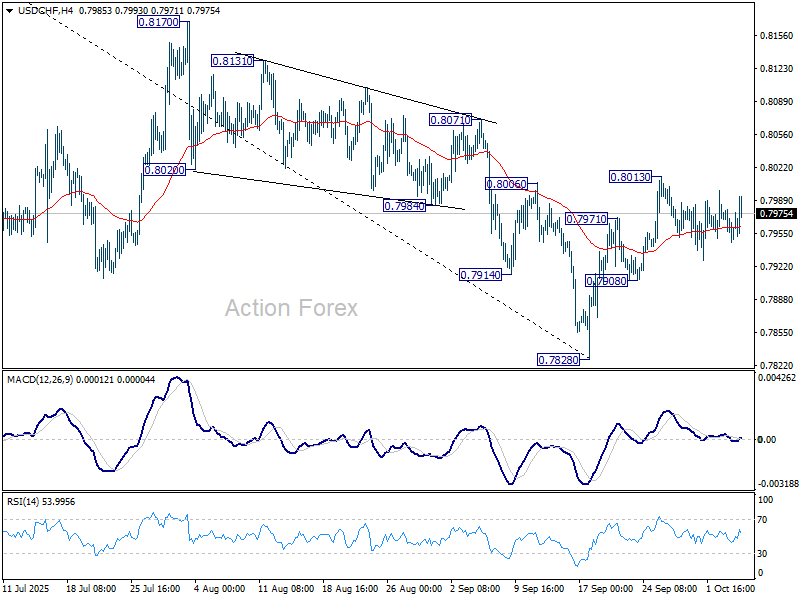
In the bigger picture, long term down trend from 1.0342 (2017 high) is still in progress. Next target is 100% projection of 1.0146 (2022 high) to 0.8332 from 0.9200 at 0.7382. In any case, outlook will stay bearish as long as 0.8332 support turned resistance holds (2023 low).