
Sample Category Title
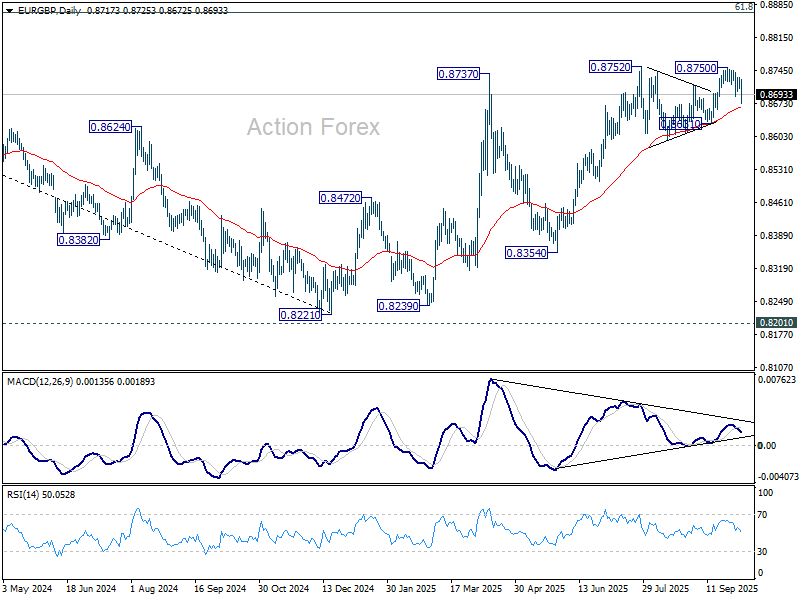
EUR/GBP Mid-Day Outlook
Daily Pivots: (S1) 0.8704; (P) 0.8717; (R1) 0.8727; More…
EUR/GBP's fall from 0.8750 resumed by breaking through 0.8688 and intraday bias is back on the downside for 0.8631 support. Decisive break there will indicate near term reversal and turn outlook bearish. On the upside, though, above 0.8728 will bring retest of 0.8750 first. Firm break there will resume the larger rally towards 0.8867 fibonacci level.
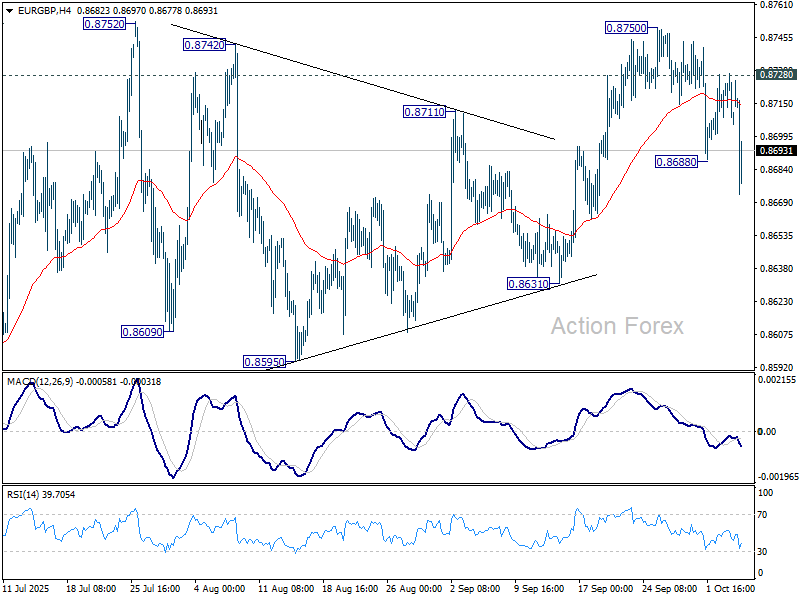
In the bigger picture, rise from 0.8221 medium term bottom is seen as a corrective move. While further rally cannot be ruled out, upside should be limited by 61.8% retracement of 0.9267 to 0.8221 at 0.8867. Considering bearish divergence condition in D MACD, firm break of 0.8631 support will be the first sign that this corrective bounce has completed. Sustained trading below 55 W EMA (now at 0.8539) will confirm, and bring retest of 0.8221 low.
Euro Weakens as French Government Implodes, Macron Faces New Crisis
Domestic politics dominated global markets today, driving sharp moves in both European and Asian trading sessions. In Europe, political instability in France rattled sentiment, while in Japan, optimism over new leadership sparked a broad equity surge and a dramatic selloff in the Yen.
In European, CAC 40 slumped and Euro is sold off broadly, after French Prime Minister Sebastien Lecornu and his newly formed government resigned just hours after unveiling their cabinet lineup. The collapse, just 14 hours after formation, deepened France’s ongoing political turmoil and marked the shortest-lived administration in modern history.
Lecornu cited the impossibility of governing amid threats from both coalition partners and the opposition to topple his government. The fallout was immediate, with opposition parties calling on President Macron to resign or trigger early elections. The episode underscores growing public fatigue and political fragmentation that risk eroding investor confidence in French assets.
Yet, Yen’s dramatic selloff overshadowed Europe’s turmoil. The currency plunged below 150 per dollar for the first time since early August and touched a record low versus Euro, as Japanese equities soared. Traders rushed into risk assets, betting that Prime Minister-designate Sanae Takaichi's incoming administration will prioritize fiscal expansion and encourage continued BoJ accommodation.
The move rippled across bond markets, sending short-term JGB yields to two-week lows as traders cut back expectations for further tightening. Market pricing for a BoJ hike by year-end fell sharply to near 40% from 68% at the end of last week, as confidence grew that the central bank will stay on hold through October.
Governor Kazuo Ueda’s cautious tone in recent weeks aligns with this view, suggesting that policymakers see little urgency to resume tightening. With political stability and fiscal stimulus prospects improving, investors appear comfortable re-engaging in carry trades, accelerating Yen’s decline.
For now, Dollar leads as the day’s strongest performer, followed by Loonie and Aussie. At the other end, Yen remains the weakest, trailed by Euro and Swiss Franc, while Sterling and Kiwi hover mid-pack in largely risk-driven trade.
In Europe, at the time of writing, FTSE is up 0.15%. DAX is up 0.25%. CAC is down -1.27%. UK 10-year yield is up 0.044 at 4.739. Germany 10-year yield is up 0.021 at 2.723. Earlier in Asia, Nikkei rose 4.75%. Hong Kong HSI fell -0.67%. China Shanghai SSE rose 0.52%. Singapore Strait Times rose 0.22%. Japan 10-year JGB yield rose 0.015 to 1.680.
ECB’s Lane: No pre-commitment on rate path, policy to stay data-driven
ECB Chief Economist Philip Lane reiterated in a speech today that monetary policy will remain data-driven and meeting-by-meeting, with “no pre-commitment to a particular rate path.” He emphasized said the ECB’s policy decisions will hinge not only on the baseline inflation forecast but also on "shifts in the risk distribution".
The downside inflation risks outlined in September include a stronger Euro, weaker export demand caused by higher global tariffs, and the possibility of rising market volatility linked to trade tensions.
Conversely, Lane highlighted several upside risks that could keep inflation elevated. These include "fragmentation of global supply chains"; surge in defence and infrastructure spending that boosts medium-term demand; and climate-related disruptions.
He elaborated that persistent Euro movements tends to have "multi-year impact" on both inflation and growth, with the size of the impact depending on its source. Appreciation stemming from external weakness or capital flows tends to depress inflation more sharply. On the other hand, changes driven by domestic demand strength or domestic risk premiums carry a smaller inflationary force.
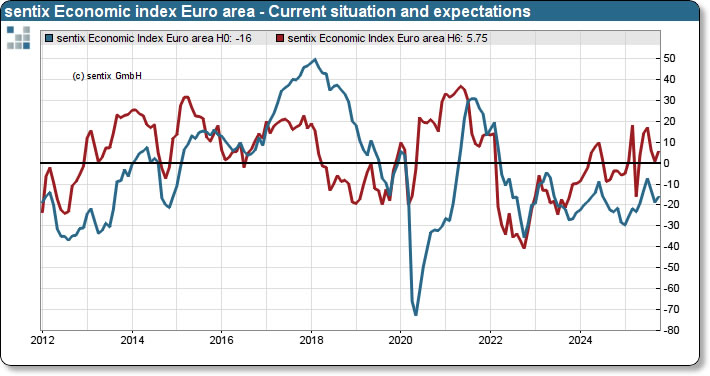
Eurozone Sentix rises to -5.4, mood brightens from exaggerated pessimism
Investor sentiment in the Eurozone improved in October, with Sentix Investor Confidence Index rising from -9.2 to -5.4, topping forecasts of -7.7. Current Situation Index advanced from -18.8 to -16.0, while Expectations climbed sharply from 0.8 to 5.8.
Sentix said the latest data initially looks like the long-awaited economic turning point, with strong improvements seen across Germany, Austria, and Switzerland as well. However, it cautioned that the improvement may not mark a lasting turnaround. Most country-level readings and the Eurozone composite still sit below August’s levels, implying that September’s pessimism was "negatively exaggerated".
Meanwhile, Sentix also noted that inflation remains a key worry, with its related index barely rising to -17.75. Still, markets appear to expect that the ECB will maintain a steady policy stance, and perhaps even lean slightly supportive, despite mounting fiscal pressures. Sentix warned that such expectations may have a “limited half-life,” as growing debt levels and persistent inflation could restrain the scope for policy easing in the months ahead.
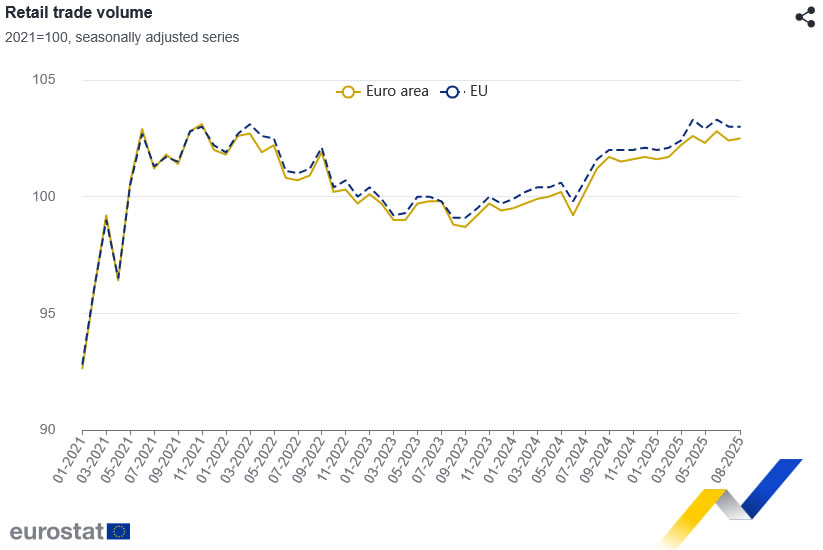
Eurozone retail sales edge up 0.1% mom in August, momentum muted
Eurozone retail sales rose 0.1% mom in August, matching expectations and signaling only a modest pickup in consumer activity. The increase was driven by 0.3% rise in food, drinks, and tobacco sales and 0.4% gain in automotive fuel, partly offset by a -0.1% decline in non-food product demand.
Across the wider European Union, retail sales were flat on the month. Among member states, Lithuania (+1.7%), Cyprus and Malta (+1.5%), and Sweden (+1.1%) posted the strongest gains, while Romania (-4.0%), Poland (-0.8%), and Luxembourg and Portugal (both -0.7%) recorded notable declines.
BoJ report highlights resilient recovery but tariffs cloud wage, capex outlook
The BoJ’s Regional Economic Report released today painted a mixed picture of recovery, with assessments for eight regions left unchanged and one downgraded. Most local economies were described as “recovering moderately” or “picking up” .
Businesses in some areas reported that they may scale back wage hikes if tariffs begin to bite into profits, a risk that could slow Japan’s nascent wage-led inflation. Still, several regions pointed to ongoing wage pressures from tight labor markets and rising living costs, suggesting that the underlying trend in income growth remains intact for now.
The survey also revealed continued commitment to capital investment, particularly in automation and IT-related projects, as firms seek efficiency gains. However, a number of companies plan to delay or reassess spending amid uncertainty over global demand and the evolving impact of tariffs.
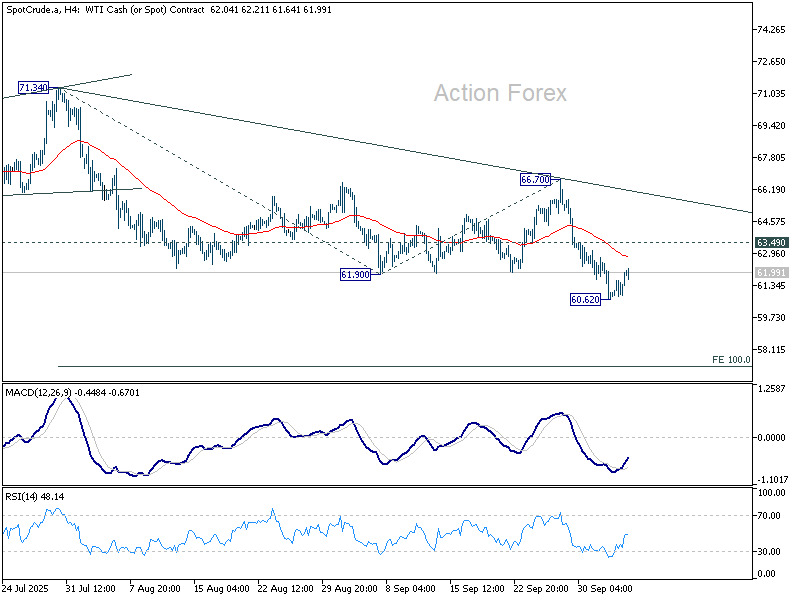
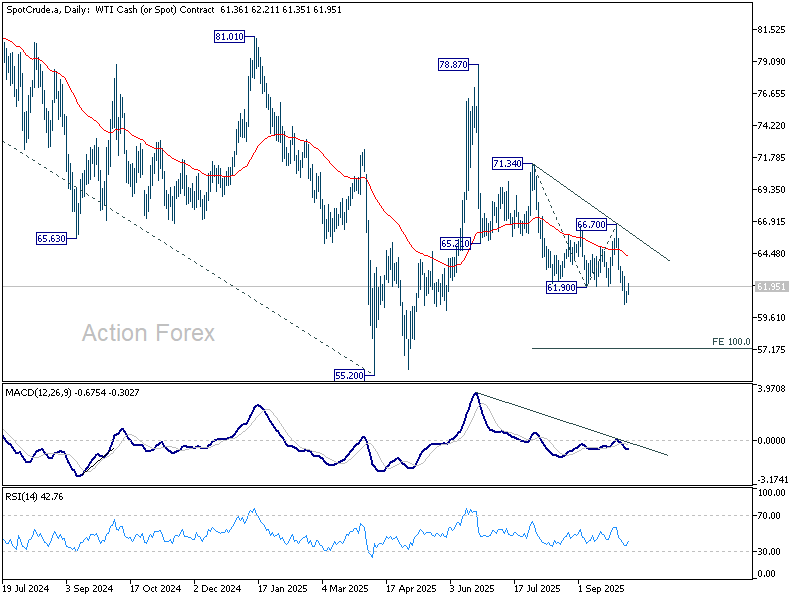
WTI oil recovers ahead of 60 after OPEC+ opts for measured output hike
Oil prices recovered modestly in today after the OPEC+ alliance confirmed a small production increase of 137,000 barrels per day for November, matching the rise announced for October. The restrained decision eased fears of a larger supply boost.
Following Sunday’s ministerial meeting, OPEC+ said the move was made “in view of a steady global economic outlook and current healthy market fundamentals.” The statement emphasized low global inventories as evidence that supply-demand conditions remain tight enough to justify a gradual output approach.
The limited hike contrasts with speculation that major producers—particularly Saudi Arabia and Russia—might push for a faster restoration of supply to reclaim market share. Instead, the decision reflects caution amid volatile demand signals and lingering uncertainty over global growth.
Technically, for WTI oil, some consolidations would be seen above 60.62 temporary low for the near term. But risk will stay on the downside as long as 63.49 minor resistance holds.
Break of 60.62 will resume the whole decline from 78.87. Next target is 100% projection of 71.34 to 61.90 from 66.70 at 57.26. However, firm break of 63.49 will bring stronger rebound back to 66.70 resistance instead.
EUR/GBP Mid-Day Outlook
Daily Pivots: (S1) 0.8704; (P) 0.8717; (R1) 0.8727; More…
EUR/GBP's fall from 0.8750 resumed by breaking through 0.8688 and intraday bias is back on the downside for 0.8631 support. Decisive break there will indicate near term reversal and turn outlook bearish. On the upside, though, above 0.8728 will bring retest of 0.8750 first. Firm break there will resume the larger rally towards 0.8867 fibonacci level.
In the bigger picture, rise from 0.8221 medium term bottom is seen as a corrective move. While further rally cannot be ruled out, upside should be limited by 61.8% retracement of 0.9267 to 0.8221 at 0.8867. Considering bearish divergence condition in D MACD, firm break of 0.8631 support will be the first sign that this corrective bounce has completed. Sustained trading below 55 W EMA (now at 0.8539) will confirm, and bring retest of 0.8221 low.
Crypto Market Electrified by Shutdown
Market Picture
The crypto market cap hit a new record high on late Sunday, rising to $4.27 trillion. On Monday, the market retreated slightly from its highs to $4.24 trillion but still recorded a 1.4% increase over the past 24 hours. This was due to the steady rise of BTC, which pushed it to new all-time highs.
The sentiment index rose to 71, reaching 74 (greed) on Sunday, showing the highest values since mid-August, when we saw a similar surge in Bitcoin.
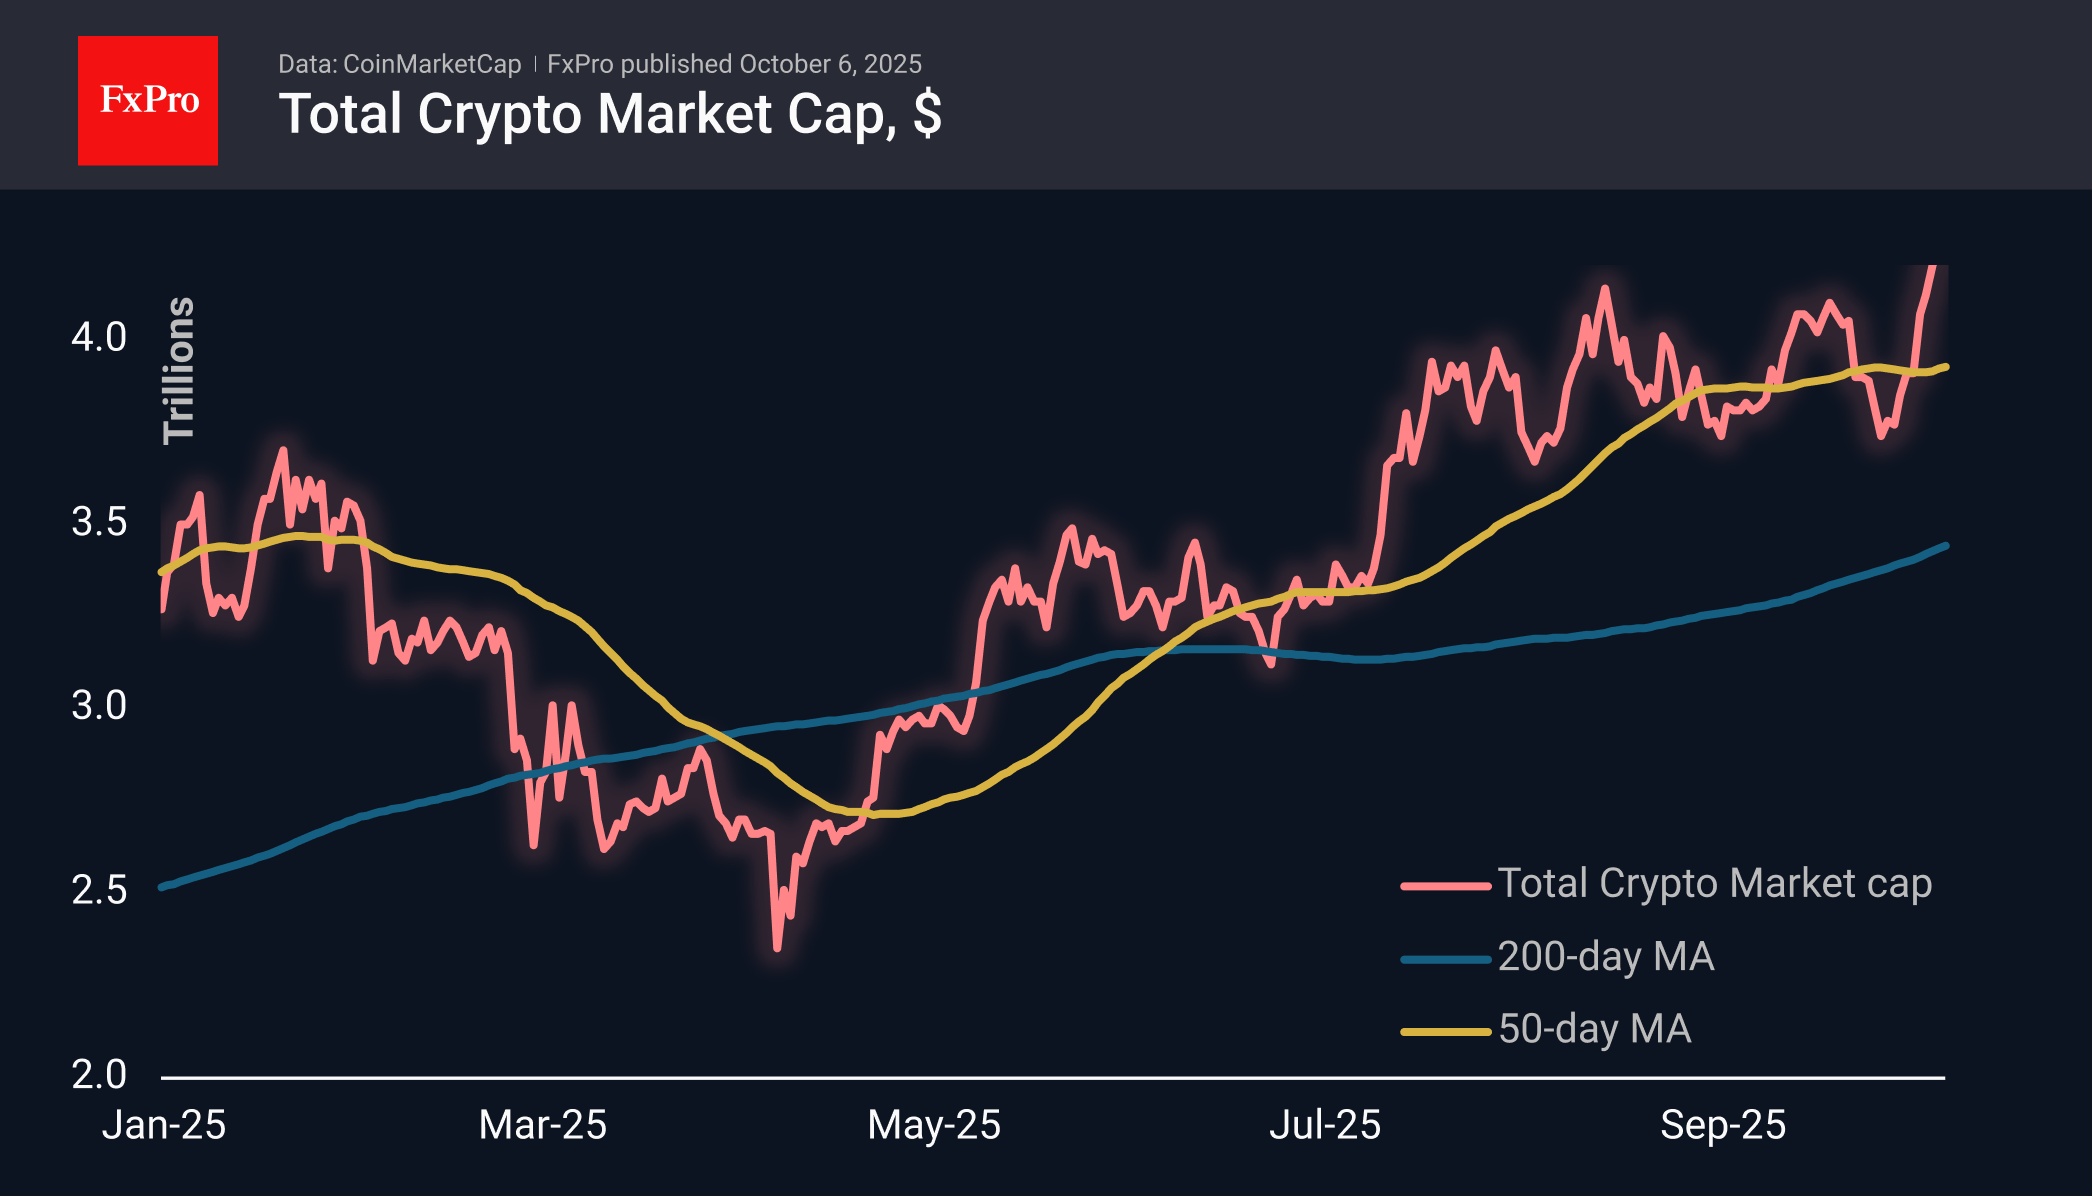
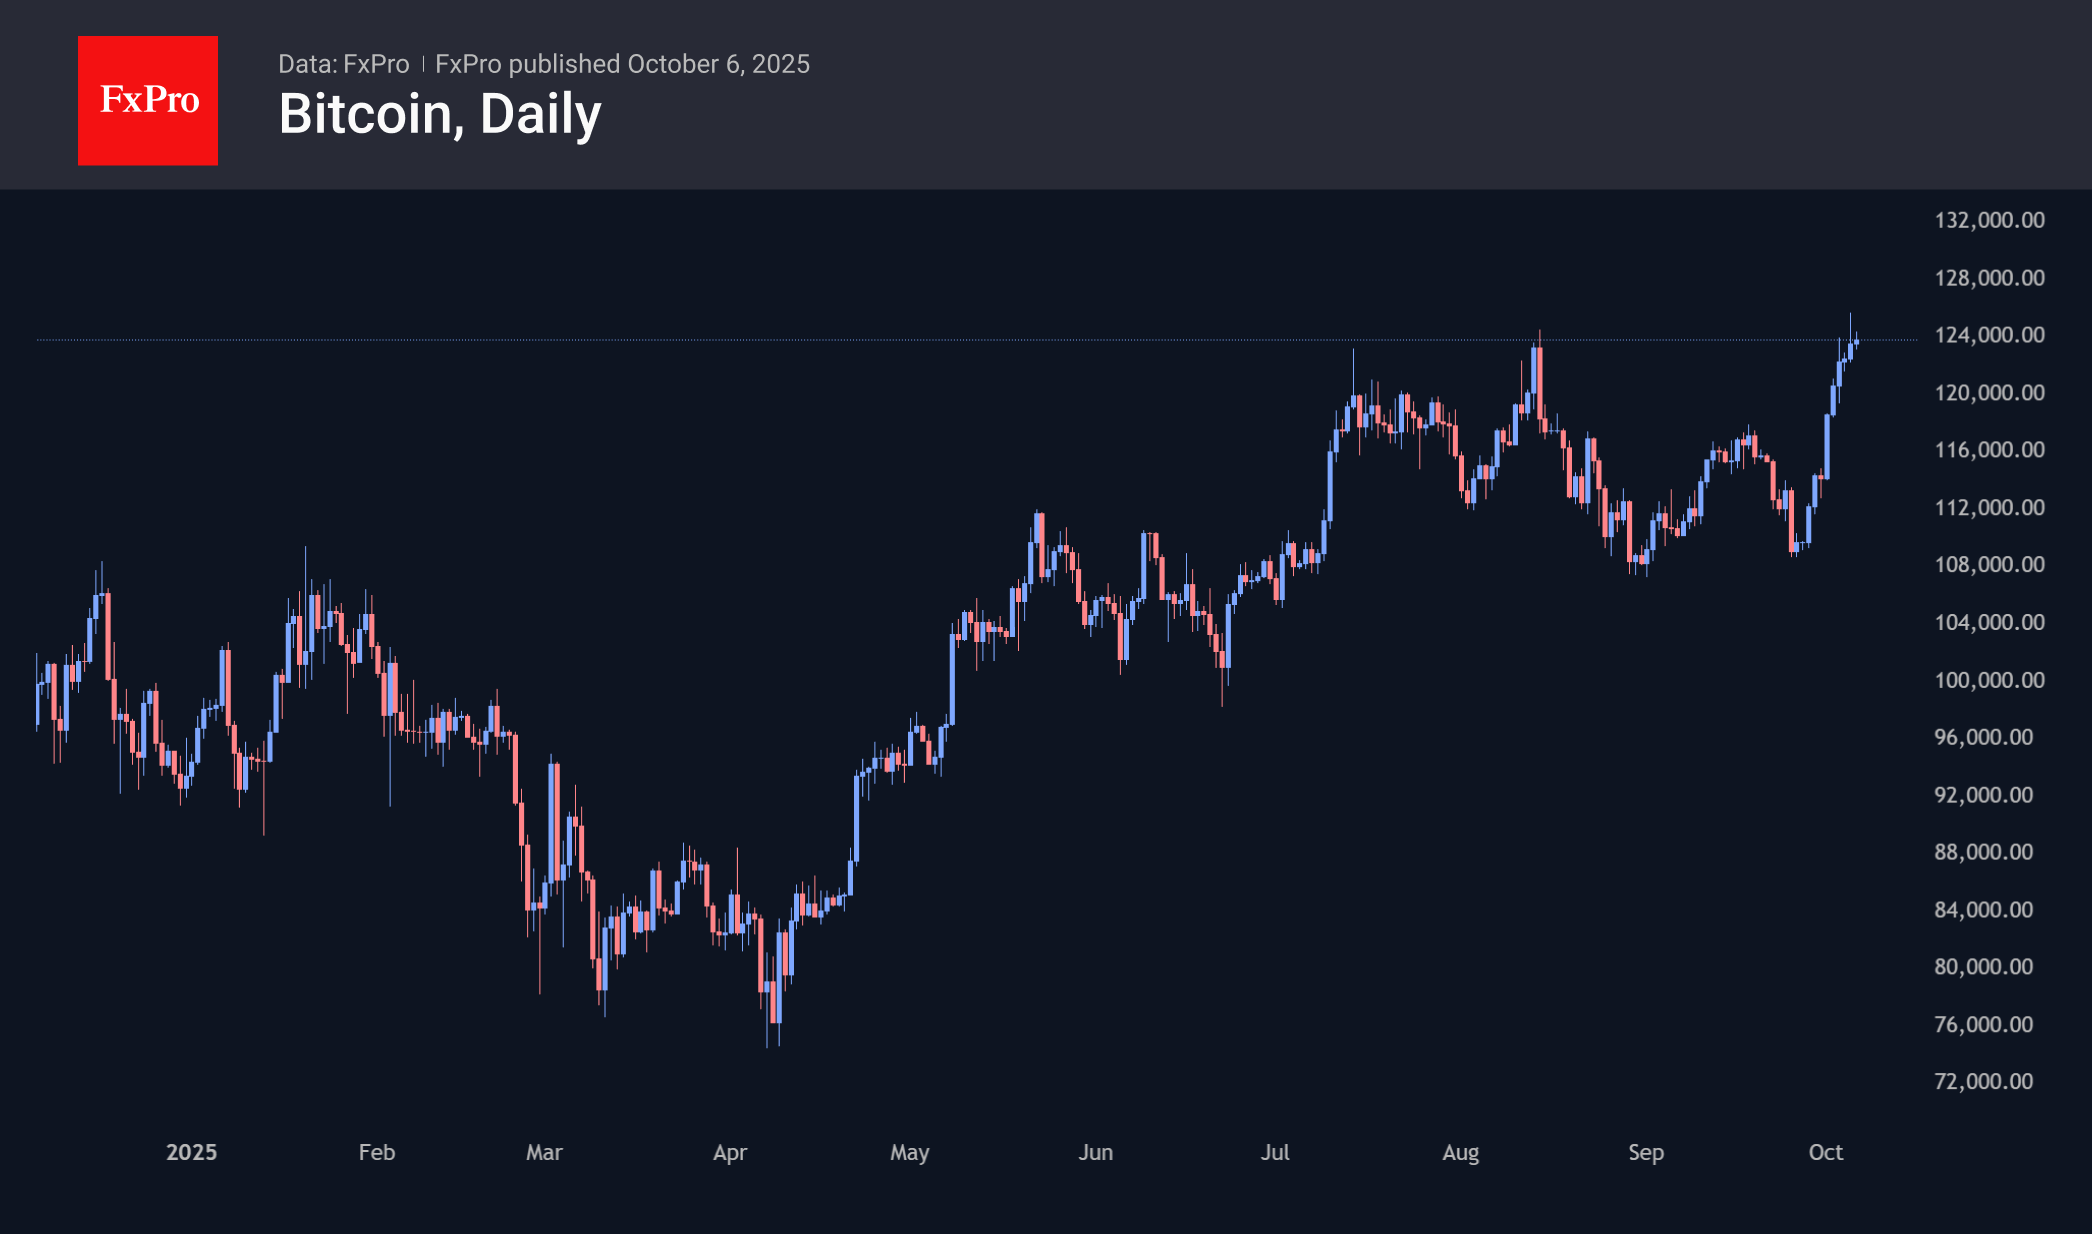
Bitcoin set a new all-time high of $125.6k, correcting to $123.6k by the start of active trading in Europe. Over seven days, BTCUSD gained over 15%, but we must consider the reduced liquidity on Sunday, which fuels the amplitude of the movement. There was a similar pattern in July and August, when a sharp increase followed the update of highs at approximately these levels in sales.
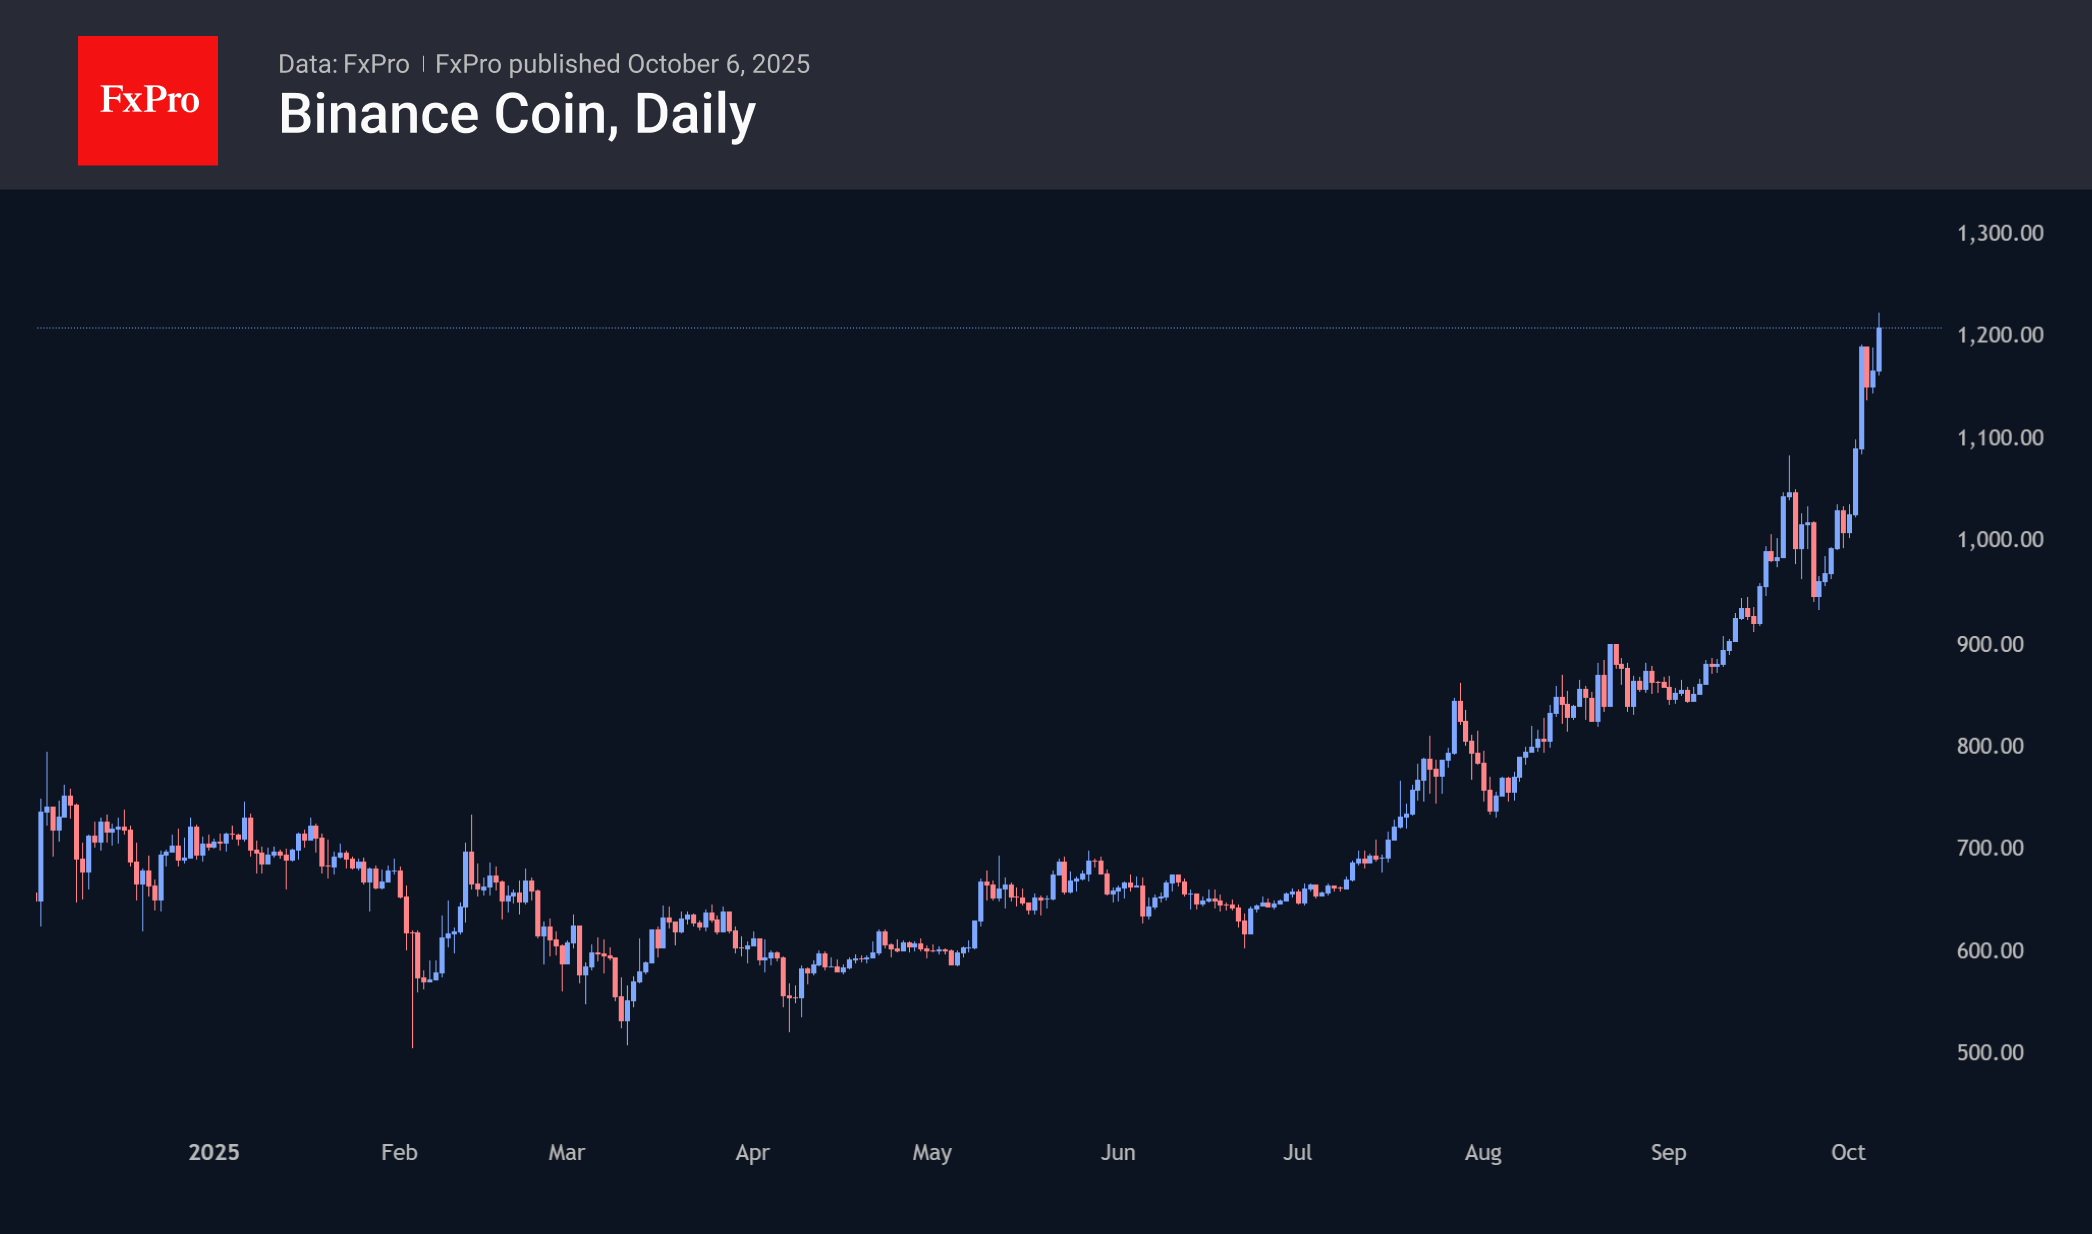
However, there are also differences from previous months. In July, XRP saw strong growth, in August, it was Ethereum, and in September, Solana made a significant leap. However, there was a clear winner all this time — BNB, which has been updating its historical highs for the fourth month in a row, shooting up 20% in seven days and 40% in 30 days, with a new record of $1,220 set on Monday.
News Background
One of the likely reasons for the growth of cryptocurrencies in the last week was the suspension of the US government’s work on 1 October. Earlier, during three of the last five shutdowns, there was also an increase in Bitcoin, as traders fear a fall in the value of fiat currencies, which also plays into the hands of gold and stocks.
According to SoSoValue, net weekly inflows into spot BTC ETFs amounted to $3.24 billion, the highest since November last year and the second highest in history. Total inflows since the approval of Bitcoin ETFs in January 2024 have increased to $60.05 billion.
The net weekly inflow into ETH ETFs was $1.30 billion, the highest in the last seven weeks. Total net inflows since the launch of ETFs in July 2024 have grown to $14.42 billion.
According to Glassnode, the total balance of Bitcoin on exchanges has fallen to a six-year low of 2.83 million coins. In 30 days, almost 170,000 BTC were withdrawn from trading platforms. VanEck believes that the ‘first official deficit’ could occur as early as Monday.
As a result of the latest recalculation, the difficulty of mining Bitcoin has increased by 5.9%, setting a record of 150.8 T. According to BitcoinMiningStock, public mining companies have increased their share of total computing power to 39.8%.
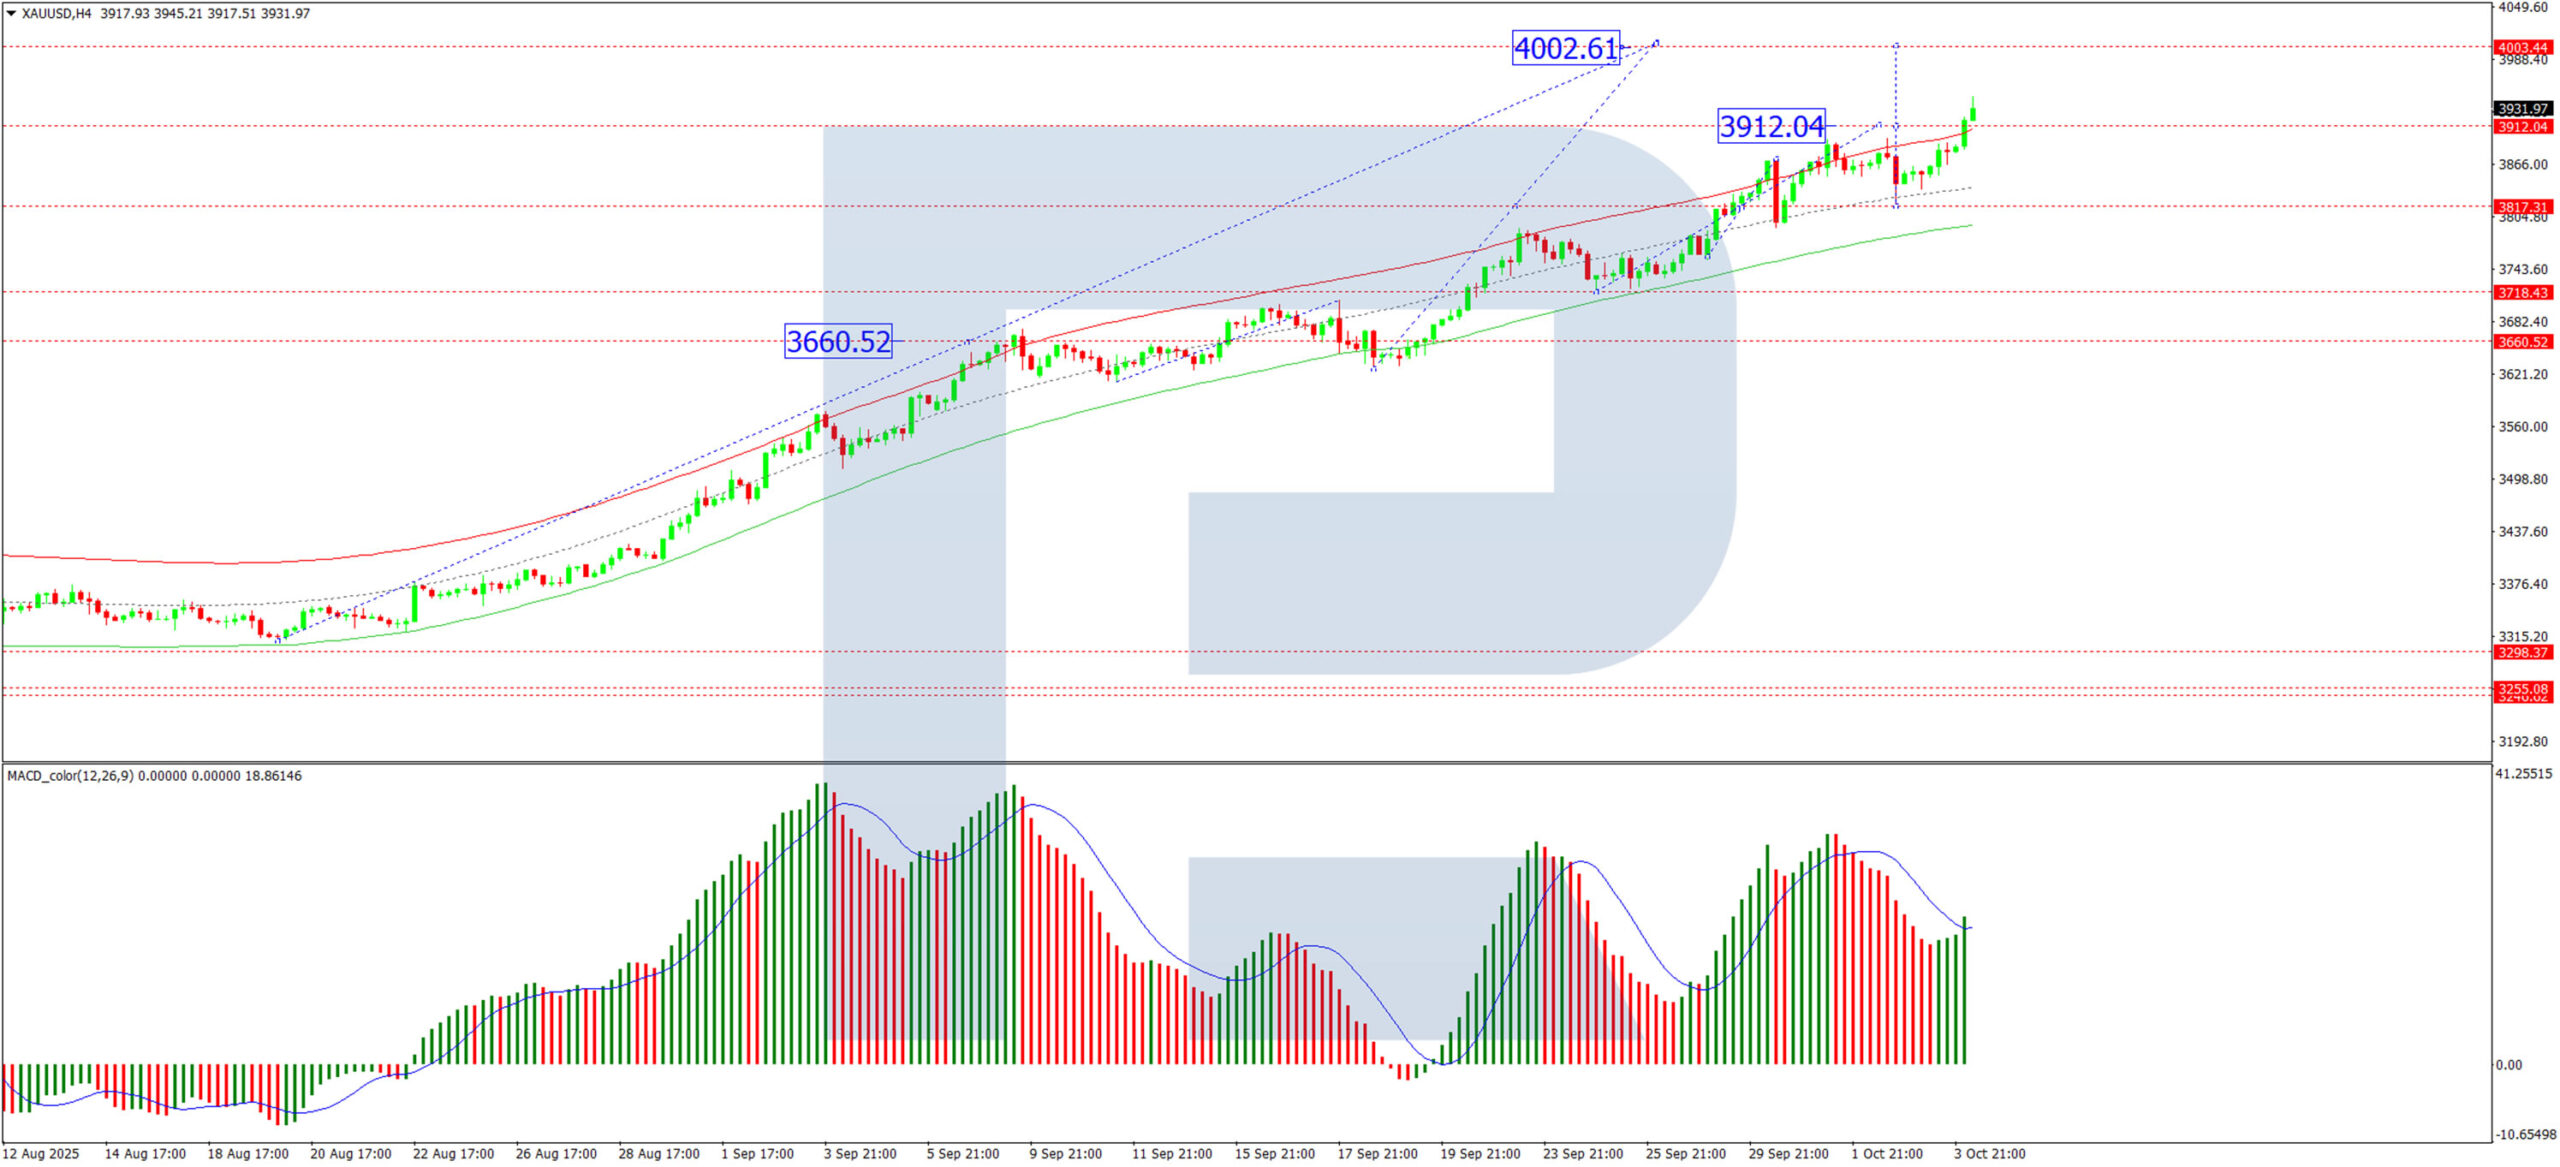
Gold Price Reaches Record High
As shown in the charts, XAU/USD quotations have reached historic peaks today. According to media reports, gold is behaving as a safe haven amid growing uncertainty, which is intensifying as the U.S. government shutdown continues. Meanwhile:
→ Gold prices may rise above $3,950 in the coming days, approaching the psychological level of $4,000. The chart underlines the firm dominance of demand forces.
Technical Analysis of the XAU/USD Chart
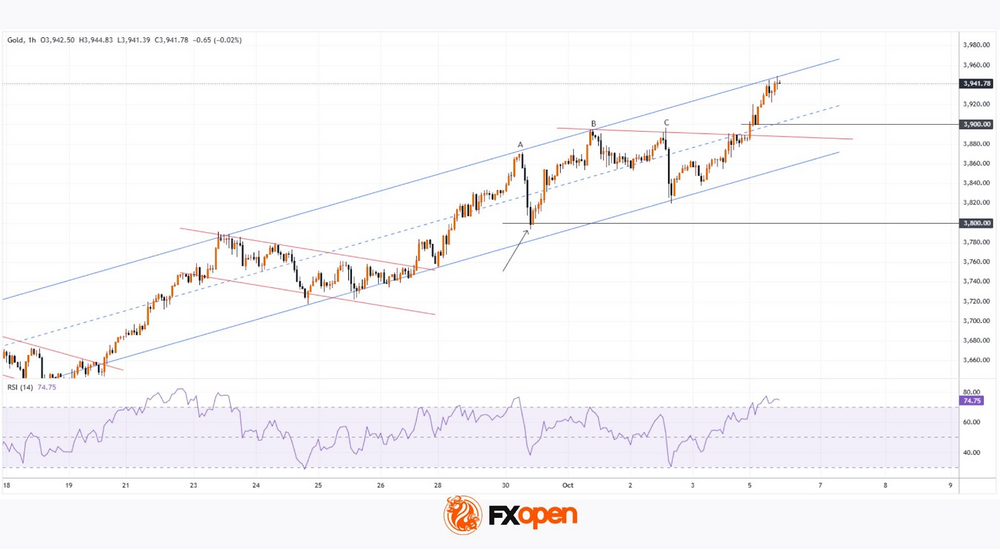
Analysing gold price fluctuations suggests the formation of an ascending channel, which has remained relevant since mid-last month.
On 30 September (when the price formed peak A) we noted that:
→ the sharp drop from peak A indicated bear confidence;
→ the price might correct towards $3,800, as bulls were exhausted, requiring another consolidation period to resume upward movement and form a “bull flag” pattern.
Indeed, the price soon tested the $3,800 level (shown by the arrow), after which bulls regained strength. However, a new “bull flag” did not form; instead, three peaks of a “head and shoulders” pattern (A–B–C) emerged, which did not lead to a reversal. This failed bearish pattern emphasised the bulls’ strength in today’s gold market.
From a bullish perspective, the price confidently broke above $3,900, where a local resistance line (shown in red) and the ascending channel’s median lie.
On the other hand, the price has approached the upper boundary of the channel, and the RSI indicator is already in the overbought zone.
If sentiment does not shift significantly, bulls’ attempt to reach the psychological level of $3,950 could make XAU/USD more vulnerable to a pullback – in which case the channel’s median could become the nearest target for sellers.
Start trading commodity CFDs with tight spreads. Open your trading account now or learn more about trading commodity CFDs with FXOpen.
This article represents the opinion of the Companies operating under the FXOpen brand only. It is not to be construed as an offer, solicitation, or recommendation with respect to products and services provided by the Companies operating under the FXOpen brand, nor is it to be considered financial advice.
Eurozone retail sales edge up 0.1% mom in August, momentum muted
Eurozone retail sales rose 0.1% mom in August, matching expectations and signaling only a modest pickup in consumer activity. The increase was driven by 0.3% rise in food, drinks, and tobacco sales and 0.4% gain in automotive fuel, partly offset by a -0.1% decline in non-food product demand.
Across the wider European Union, retail sales were flat on the month. Among member states, Lithuania (+1.7%), Cyprus and Malta (+1.5%), and Sweden (+1.1%) posted the strongest gains, while Romania (-4.0%), Poland (-0.8%), and Luxembourg and Portugal (both -0.7%) recorded notable declines.
Eurozone Sentix rises to -5.4, mood brightens from exaggerated pessimism
Investor sentiment in the Eurozone improved in October, with Sentix Investor Confidence Index rising from -9.2 to -5.4, topping forecasts of -7.7. Current Situation Index advanced from -18.8 to -16.0, while Expectations climbed sharply from 0.8 to 5.8.
Sentix said the latest data initially looks like the long-awaited economic turning point, with strong improvements seen across Germany, Austria, and Switzerland as well. However, it cautioned that the improvement may not mark a lasting turnaround. Most country-level readings and the Eurozone composite still sit below August’s levels, implying that September’s pessimism was "negatively exaggerated".
Meanwhile, Sentix also noted that inflation remains a key worry, with its related index barely rising to -17.75. Still, markets appear to expect that the ECB will maintain a steady policy stance, and perhaps even lean slightly supportive, despite mounting fiscal pressures. Sentix warned that such expectations may have a “limited half-life,” as growing debt levels and persistent inflation could restrain the scope for policy easing in the months ahead.
ECB’s Lane: No pre-commitment on rate path, policy to stay data-driven
ECB Chief Economist Philip Lane reiterated in a speech today that monetary policy will remain data-driven and meeting-by-meeting, with “no pre-commitment to a particular rate path.” He emphasized said the ECB’s policy decisions will hinge not only on the baseline inflation forecast but also on "shifts in the risk distribution".
The downside inflation risks outlined in September include a stronger Euro, weaker export demand caused by higher global tariffs, and the possibility of rising market volatility linked to trade tensions.
Conversely, Lane highlighted several upside risks that could keep inflation elevated. These include "fragmentation of global supply chains"; surge in defence and infrastructure spending that boosts medium-term demand; and climate-related disruptions.
He elaborated that persistent Euro movements tends to have "multi-year impact" on both inflation and growth, with the size of the impact depending on its source. Appreciation stemming from external weakness or capital flows tends to depress inflation more sharply. On the other hand, changes driven by domestic demand strength or domestic risk premiums carry a smaller inflationary force.
Gold Surges 50% Year-to-Date with Further Gains Expected
Gold soared to a fresh record high on Monday, breaching 3,923 USD per ounce as demand for safe-haven assets intensified. The protracted US government shutdown continues to be a primary catalyst for the rally.
The budget crisis has extended into the new week following a failed Senate vote on Friday, leading to prolonged delays in key macroeconomic data publications—including the critical September non-farm payrolls report. In the absence of official statistics, investors are relying on indirect indicators that suggest a gradual softening of the US labour market.
With a vacuum in fresh economic data, market attention has turned to commentary from Federal Reserve officials for any clarity on the future path of monetary policy.
Since the start of the year, gold has appreciated by nearly 50%. This remarkable rally has been driven by a confluence of factors: persistent economic and geopolitical uncertainty, expectations of a protracted Fed easing cycle, and consistent investment inflows into gold-backed ETFs.
Technical Analysis: XAU/USD
H4 Chart:
On the H4 chart, XAU/USD found strong support at the 3,820 USD level and is now advancing within a growth wave targeting 4,000 USD. This is considered a local target. Upon reaching it, a corrective pullback towards 3,820 USD is anticipated. Following this correction, the formation of another upward wave targeting 4,170 USD is expected. This bullish outlook is technically confirmed by the MACD indicator, whose signal line is positioned above zero and pointing sharply upward.
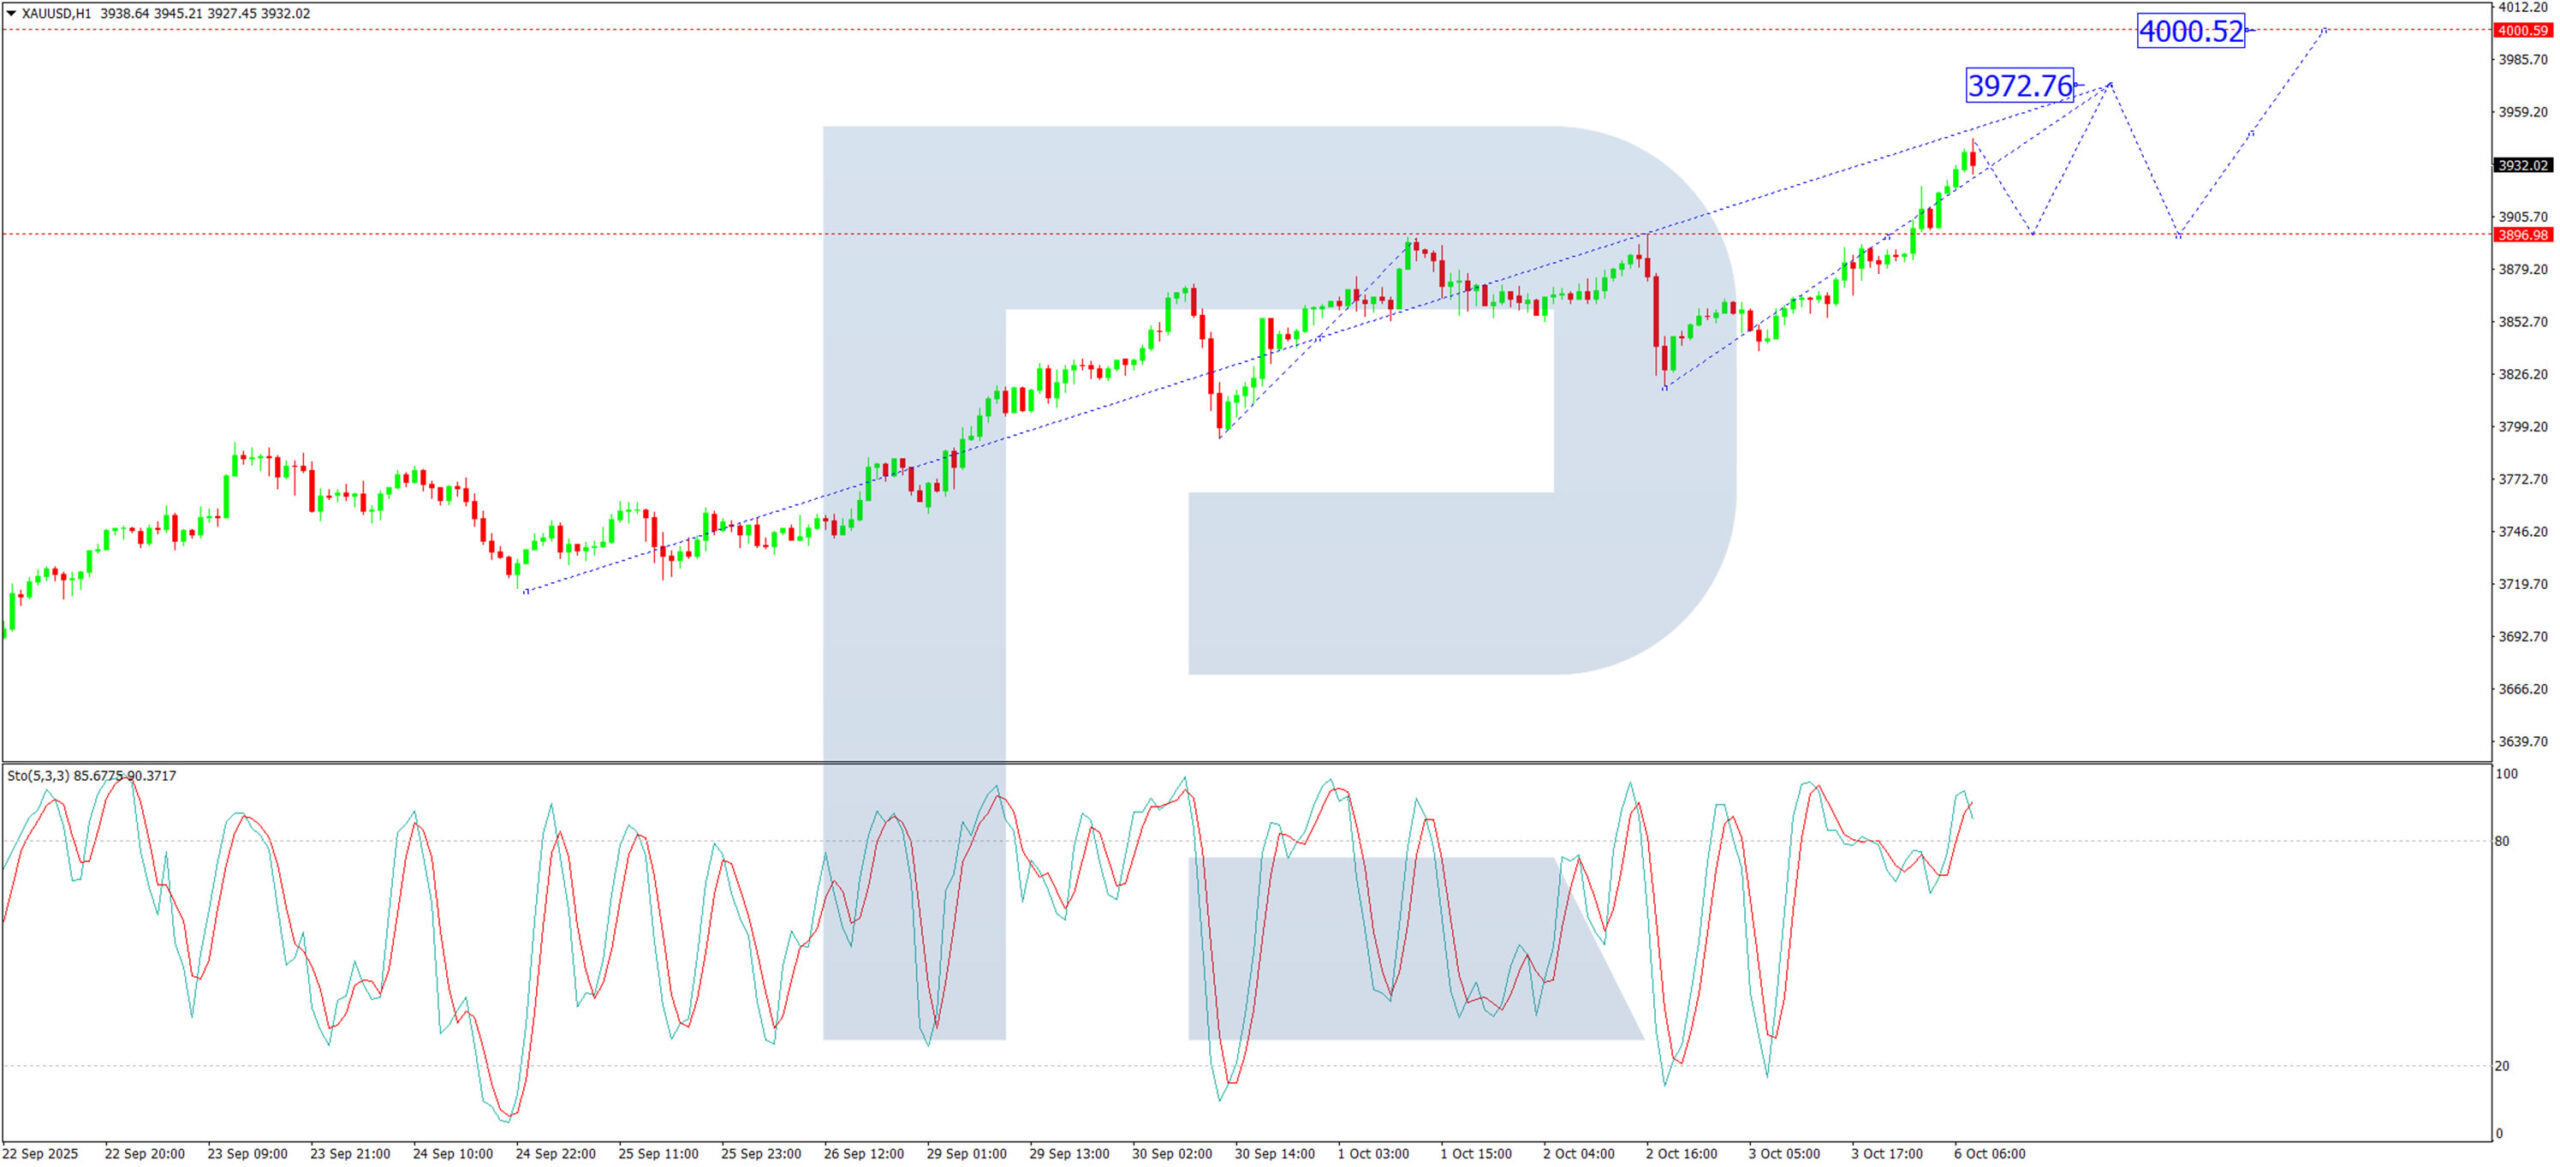
H1 Chart:
The H1 chart shows the pair breaking above the 3,896 USD resistance, subsequently forming a consolidation range around this level. Today's upside breakout has confirmed the continuation of the bullish impulse towards 3,972 USD. A correction back to 3,896 USD is likely upon reaching this target, after which a resumption of the uptrend towards 4,000 USD is expected. The Stochastic oscillator corroborates this view, with its signal line currently above 80 and poised to decline towards 50, indicating potential for a short-term pullback before further gains.
Conclusion
Gold's record-breaking rally shows no signs of abating, underpinned by a supportive macroeconomic backdrop and strong technical momentum. While a short-term correction is increasingly likely as the market becomes overbought, the broader bullish trend remains firmly intact, with clear technical targets projecting further gains ahead.
AUD/USD and NZD/USD Hold Firm, More Upside Moves On The Way?
AUD/USD started a fresh increase above 0.6550 and 0.6575. NZD/USD is also rising and might aim for more gains above 0.5840.
Important Takeaways for AUD USD and NZD USD Analysis Today
- The Aussie Dollar started a decent increase above 0.6575 against the US Dollar.
- There is a key declining channel forming with resistance at 0.6615 on the hourly chart of AUD/USD at FXOpen.
- NZD/USD is consolidating gains above the 0.5800 pivot level.
- There is a major bullish trend line forming with support at 0.5815 on the hourly chart of NZD/USD at FXOpen.
AUD/USD Technical Analysis
On the hourly chart of AUD/USD at FXOpen, the pair started a fresh increase from 0.6520. The Aussie Dollar was able to clear 0.6550 to move into a positive zone against the US Dollar.
There was a close above the 0.6575 resistance and the 50-hour simple moving average. Finally, the pair tested 0.6630. A high was formed near 0.6628 and the pair recently started a consolidation phase. There was a minor decline below 0.6600.
There was a move below the 23.6% Fib retracement level of the upward move from the 0.6520 swing low to the 0.6628 high. On the upside, the AUD/USD chart indicates that the pair is now facing resistance near 0.6615 and a key declining channel.
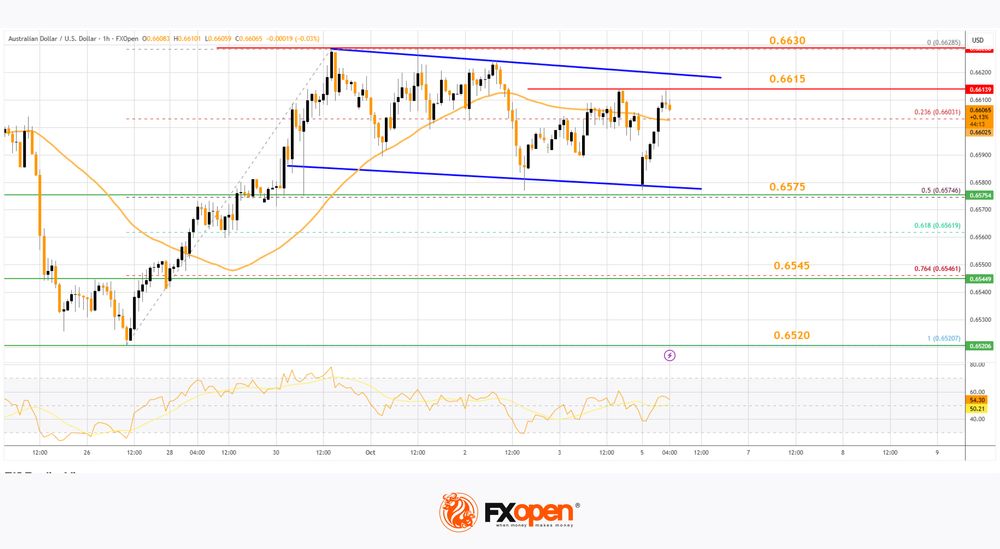
The first major hurdle for the bulls might be 0.6630. An upside break above 0.6630 might send the pair further higher. The next stop is near 0.6650. Any more gains could clear the path for a move toward the 0.6700 handle.
On the downside, initial support is near the 50% Fib retracement at 0.6575. The next area of interest could be 0.6545. If there is a downside break below 0.6545, the pair could extend its decline toward the 0.6520 zone. Any more losses might signal a move toward 0.6500.
NZD/USD Technical Analysis
On the hourly chart of NZD/USD on FXOpen, the pair started a fresh increase from 0.5755. The New Zealand Dollar broke the 0.5790 barrier to start the recent rally against the US Dollar.
The pair settled above 0.5800 and the 50-hour simple moving average. It tested 0.5840 and is currently consolidating gains. There was a minor pullback below 0.5825 and the 23.6% Fib retracement level of the upward move from the 0.5754 swing low to the 0.5842 high.
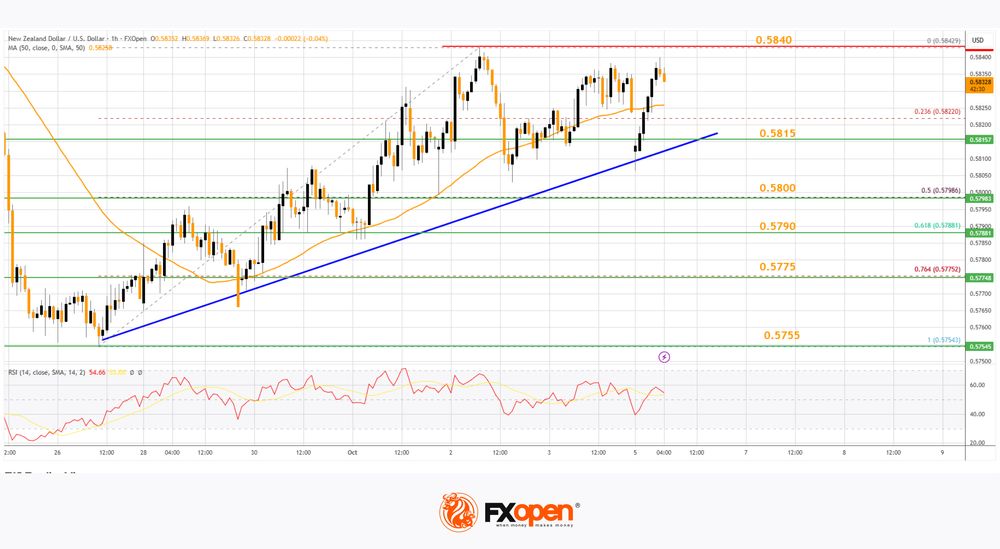
The NZD/USD chart suggests that the RSI is stable above 50. On the upside, the pair might struggle near 0.5840. The next major resistance is near the 0.5880 level. A clear move above 0.5880 might even push the pair toward 0.5920. Any more gains might clear the path for a move toward the 0.6000 handle in the coming days.
On the downside, immediate support is near the 0.5815 level and a major bullish trend line. The first key zone for the bulls sits at 0.5800 and the 50% Fib retracement. The next key level is 0.5790. If there is a downside break below 0.5790, the pair might slide toward 0.5775. Any more losses could lead NZD/USD into a bearish zone to 0.5755.
Trade over 50 forex markets 24 hours a day with FXOpen. Take advantage of low commissions, deep liquidity, and spreads from 0.0 pips. Open your FXOpen account now or learn more about trading forex with FXOpen.
This article represents the opinion of the Companies operating under the FXOpen brand only. It is not to be construed as an offer, solicitation, or recommendation with respect to products and services provided by the Companies operating under the FXOpen brand, nor is it to be considered financial advice.
WTI oil recovers ahead of 60 after OPEC+ opts for measured output hike
Oil prices recovered modestly in today after the OPEC+ alliance confirmed a small production increase of 137,000 barrels per day for November, matching the rise announced for October. The restrained decision eased fears of a larger supply boost.
Following Sunday’s ministerial meeting, OPEC+ said the move was made “in view of a steady global economic outlook and current healthy market fundamentals.” The statement emphasized low global inventories as evidence that supply-demand conditions remain tight enough to justify a gradual output approach.
The limited hike contrasts with speculation that major producers—particularly Saudi Arabia and Russia—might push for a faster restoration of supply to reclaim market share. Instead, the decision reflects caution amid volatile demand signals and lingering uncertainty over global growth.
Technically, for WTI oil, some consolidations would be seen above 60.62 temporary low for the near term. But risk will stay on the downside as long as 63.49 minor resistance holds.
Break of 60.62 will resume the whole decline from 78.87. Next target is 100% projection of 71.34 to 61.90 from 66.70 at 57.26. However, firm break of 63.49 will bring stronger rebound back to 66.70 resistance instead.