Sample Category Title
Shutdown Fails to Shake Risk Appetite; Dollar Slips, Not Sinks
A week with political paralysis in Washington ended with record highs on Wall Street — a telling sign of how investors are prioritizing Fed policy over fiscal drama. The U.S. government shutdown, now in effect after Congress failed to pass a funding bill, has frozen major data releases and paralyzed parts of the bureaucracy. Yet for markets, the episode has so far reinforced the belief that the Fed will be compelled to cut rates again this month to cushion a softening economy. Dollar, thus, slipped on the back of falling yields, closing as one of the weakest currencies of the week.
The other laggard was Loonie, dragged lower by tumbling oil prices. WTI crude plunged around 8% as reports surfaced that OPEC+ could drastically raise its planned output increase, potentially flooding the market at a time of weak global demand. That combination — cheaper oil and a dovish BoC — left Canadian Dollar as the week’s worst performer.
In contrast, the Australian Dollar held firm near multi-month highs after the RBA’s hawkish hold. However, by week’s end, the rally began to stall as traders reassessed whether the hawkish tone could still justify more upside.
Meanwhile, Yen led the currency board. The early push came as speculation built over a BoJ rate hike following a hawkish turn from a traditionally dovish board member. But enthusiasm moderated after mixed domestic data and a cautious speech from Governor Kazuo Ueda. Adding a political twist, Sanae Takaichi’s weekend victory in the LDP leadership race made her Japan’s first female prime minister — a milestone that would shape both fiscal and monetary direction.
Taken together, the week captured a global market in transition: U.S. stocks thriving amid fiscal chaos, oil sliding on supply fears, Aussie cooling after a hawkish burst, and Yen strengthening into Japan’s political dawn.
Government Shutdown Boosts Odds of Another Fed Insurance Rate Cut
US equities closed another week on a strong note, showing remarkable resilience even as the US federal government entered its latest shutdown. S&P 500 advanced 1.1% over the week, while DOW and NASDAQ each rose 1.3%, extending the post-summer rally. The optimism reflects investors’ continued faith that lower policy rates and AI-related growth can offset mounting signs of a cooling economy.
Historically, US government shutdowns have had little lasting market impact, and this one has proven no different so far. Political gridlock in Washington has delayed some key data releases, most notably the non-farm payroll report. Yet, traders have quickly filled the gap with alternative indicators that suggest the labor market is turning down faster than expected.
Private-sector payrolls contracted by 32,000 in September, the third decline in four months according to ADP data. Both ISM employment sub-indexes remained mired in contraction territory, with manufacturing employment rising modestly to 45.3 and services improving slightly to 47.2. These readings point to a job market that is clearly deteriorating.
If the shutdown prevents official data from being published before the October 28-29 Fed meeting, these proxy measures may carry unusual weight. Fed will rather err on the side of supporting jobs, and deliver another quarter-point reduction as an “insurance cut".
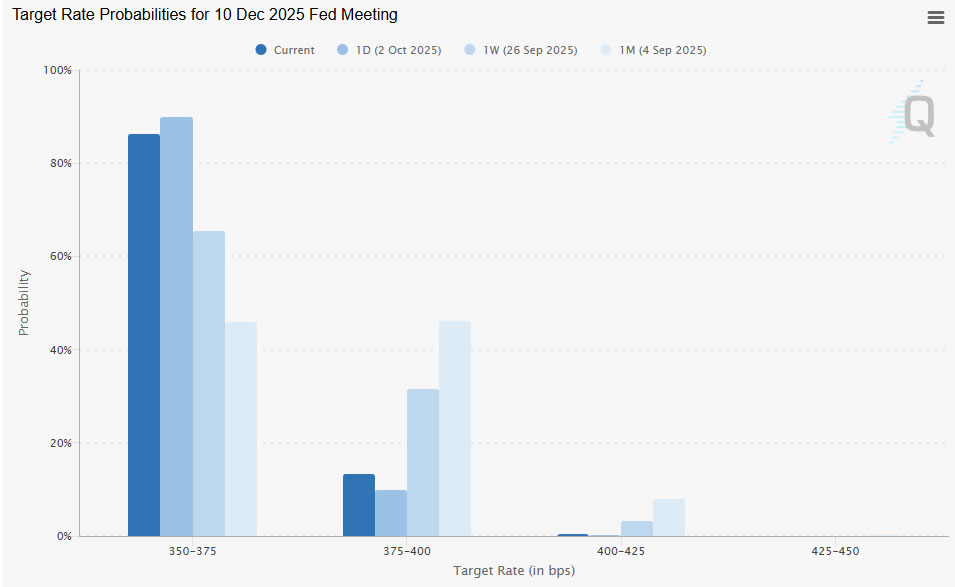
Futures markets now assign 96.2% probability to a quarter-point rate cut, taking the target range down to 3.75%–4.00% on October 29. Expectations for another reduction in December have risen back to 86.3%. Nevertheless, it's still premature to draw a conclusion beyond October.
Equity markets, meanwhile, continue to look through the economic softness. Investors are betting that a dovish Fed will help extend the bull market.
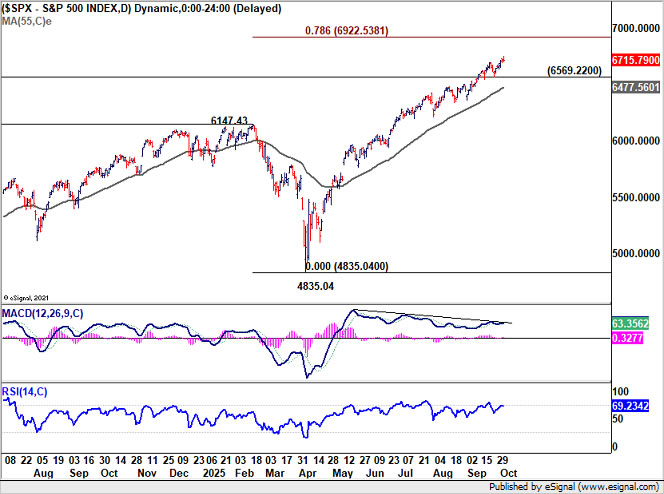
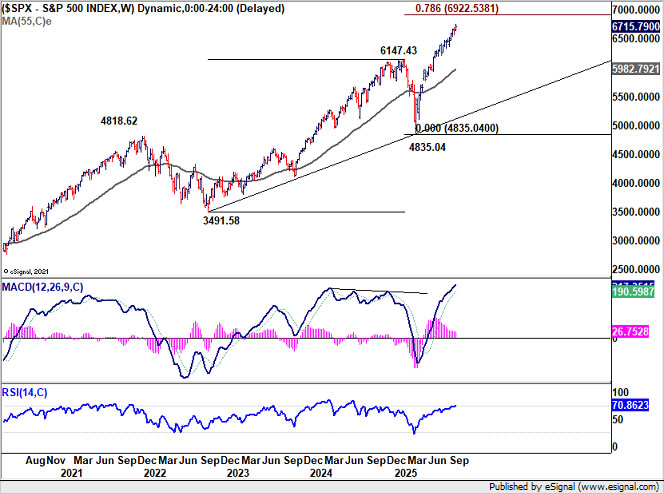
Technically, near term outlook will stay bullish in S&P 500 as long as 6569.22 support holds. Current up trend should target 78.6% projection of 3491.58 to 6147.43 from 4835.04 at 6922.53. Strong resistance would likely be seen around 7000 psychological level to bring pullback, at least on first attempt.
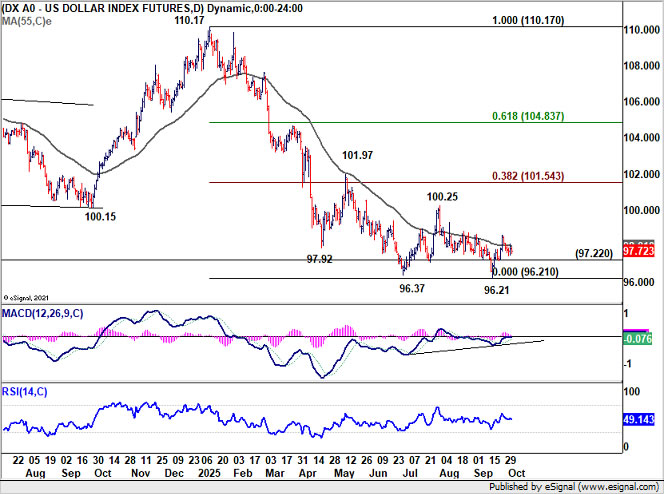
The greenback has softened in tandem with falling yields, as risk appetite improved and traders repositioned for faster Fed easing. Dollar Index's rebound from 96.21 short term bottom lost momentum and closed back below 55 D EMA (now at 98.01).
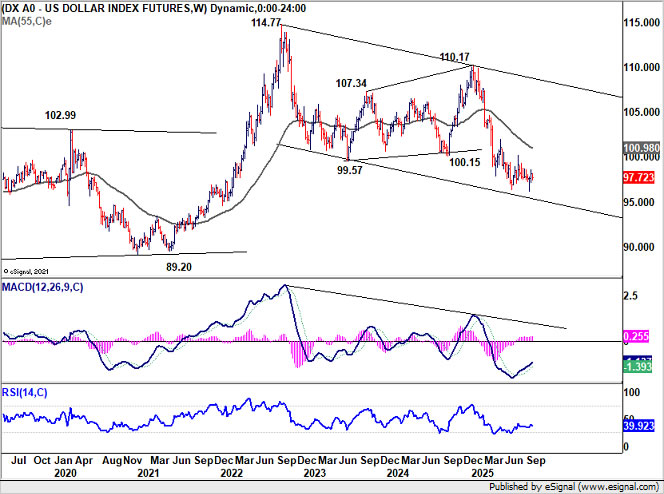
Still, further rise would remain mildly in favor as long as 97.22 support holds. Price actions from 96.21 are seen as correcting the whole decline from 110.17. Thus, further rally should be seen to 100.25 resistance. Nevertheless, strong resistance could be seen from the zone between 38.2% retracement of 110.17 to 96.21 at 101.54 and 55 W EMA (now at 100.98) to limit upside. Meanwhile, break of 97.22 will dampen this bullish view, and bring retest of 96.21 low.
Oil Slumps as OPEC+ Eyes Output Hike; Loonie Feels the Heat
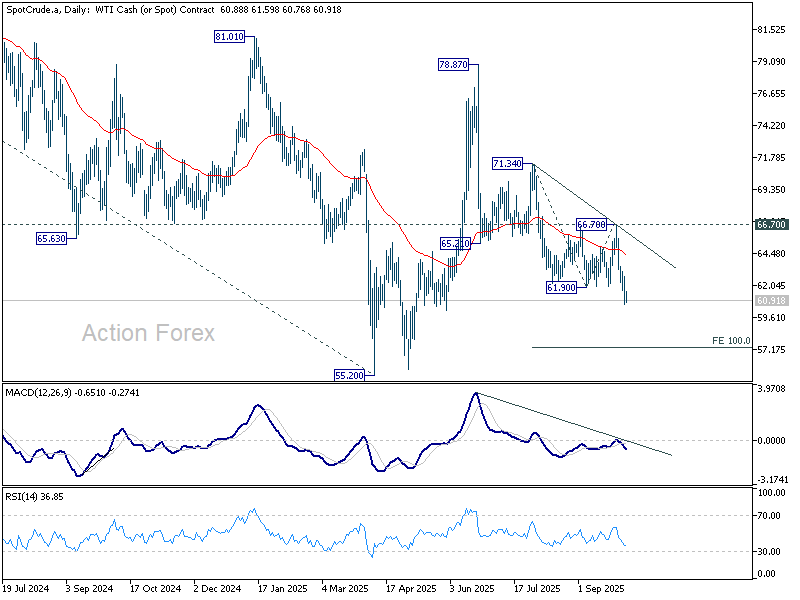
Oil prices fell sharply last week, posting their steepest weekly loss in more than three months as supply expectations shifted dramatically. WTI crude tumbled around 8%, breaking key technical levels after reports emerged that OPEC+ members were preparing another round of output increases in November.
According to sources familiar with internal talks, eight OPEC+ producers are likely to back a fresh supply hike at Sunday’s meeting. Saudi Arabia is reportedly leading calls for a sizeable increase to regain market share, while Russia prefers a smaller rise.
The proposed output hike, possibly as large as 500,000 barrels per day, follows a string of production increases this year that have already added more than 2.5 million barrels per day to global supply. Traders fear this could tip the market into surplus in the fourth quarter, particularly as demand indicators in China and Europe remain lackluster.
Geopolitical developments have added further pressure. Hamas has reportedly entered discussions with the Trump administration over a potential peace plan, with Washington giving the group until Sunday night to agree to terms aimed at ending the Gaza conflict. Any progress could remove a geopolitical premium that has lingered over Middle Eastern crude, reinforcing the recent downward momentum.
Technically, the damage is clear. WTI’s decline from June high at 78.87 re-accelerated after breaking 61.90 support. As long as 55 Day EMA (now at 64.33) caps the upside, risk stays skewed to the downside with next target at 100% projection of 71.34 to 61.90 from 66.70 at 57.26. Nevertheless, Strong support should emerge near 55.20 to contain the fall and allow for a rebound.
The slide in crude has amplified pressure on Canadian Dollar, which was already undermined by dovish expectations for the BoC. Loonie ended the week as one of the weakest majors, with CAD/JPY leading the losses with a -1.38% drop.
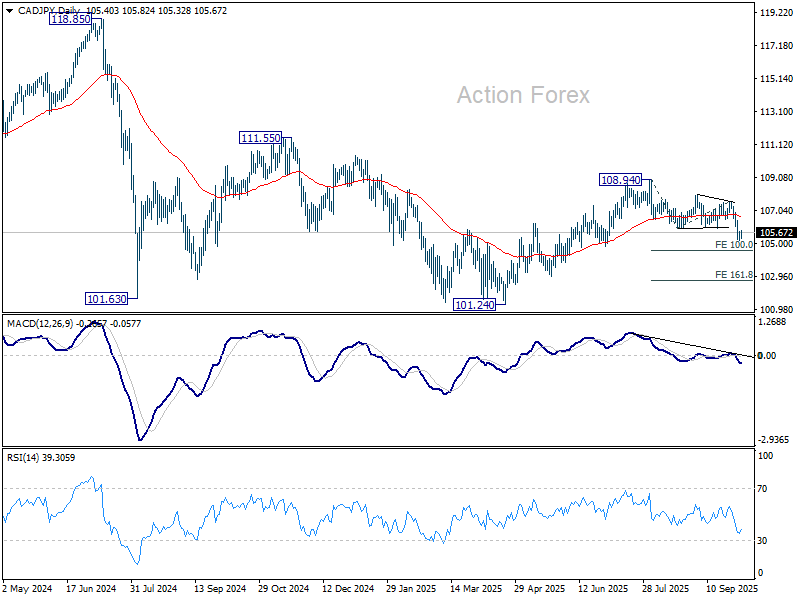
Technically, CAD/JPY’s fall from 108.94 resumed last week. The cross is now targeting 100% projection of 108.94 to 105.93 from 107.61 at 104.60. Decisive break there could prompt downside acceleration to 161.8% projection at 102.73.
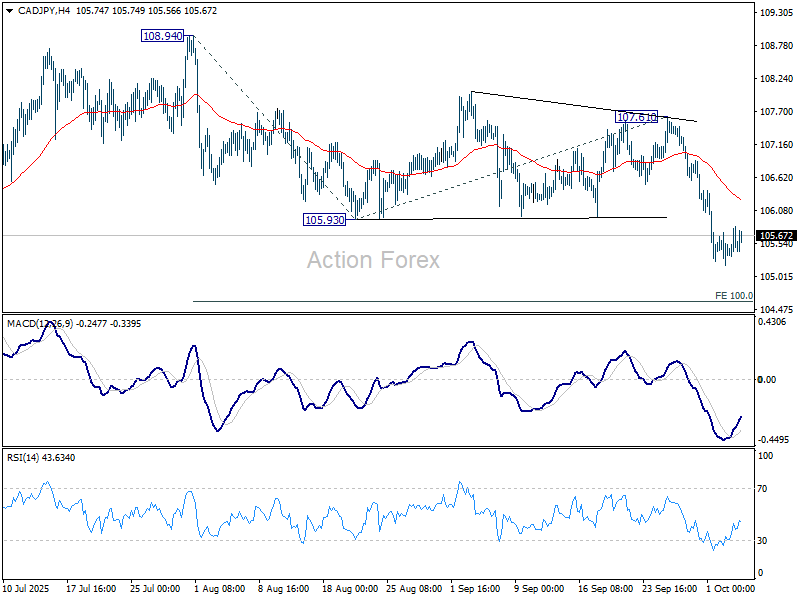
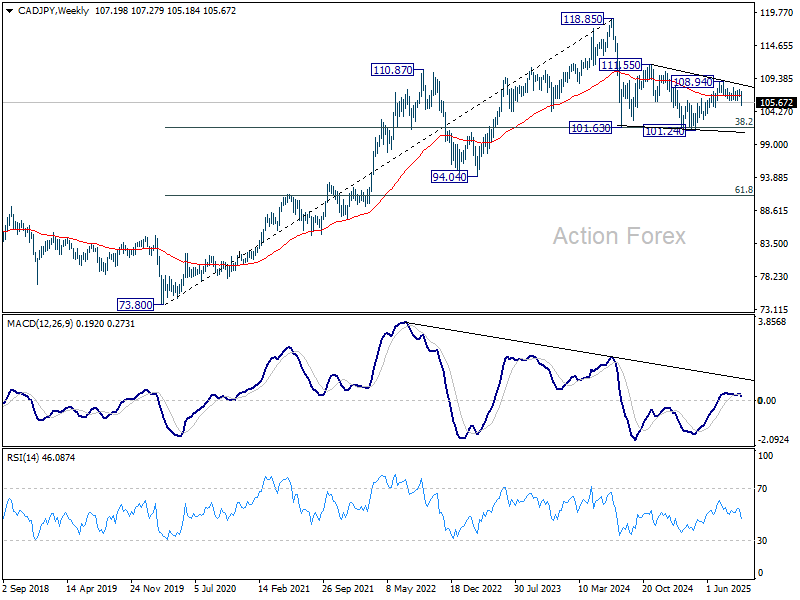
More importantly, any near term downside acceleration will raise the chance that whole medium term corrective pattern from 101.63 has already completed. And the decline from 118.85 (2024 high) is ready to resume. This is worth some attention in the next few weeks.
Aussie Rally Fades as RBA Hawkish Tilt Meets Market Fatigue
Australian Dollar started last week on a strong footing, rallying after the RBA kept its cash rate unchanged at 3.60% and leaned slightly hawkish in tone. However, by the end of the week, the momentum faded as Aussie looks exhausted after recent strong rise.
The key takeaway from the RBA’s October meeting was its warning that third-quarter inflation may surprise to the upside. The Bank’s statement noted that recent data—though volatile—suggested price pressures had not cooled as quickly as anticipated. Governor Michele Bullock refrained from committing to a specific policy path, telling reporters she would not “predict what the interest rate is going to be in the next three to six months.” That cautious phrasing was interpreted as a signal that the central bank is more comfortable holding rates steady for longer.
Major banks quickly updated their forecasts. Commonwealth Bank of Australia scrapped expectations of another rate cut this year. It now sees the next easing move pushed back to February 2026, citing a “shift in tone” from the RBA and stronger inflation dynamics. CBA expects Q3 trimmed mean inflation to rise 0.8% quarter-on-quarter, keeping the annual pace steady at 2.7%.
National Australia Bank also turned less dovish. Chief Economist Sally Auld said she now expects the RBA to stay on hold through May 2026, with only one more 25-basis-point cut thereafter. NAB removed its earlier projections for two rate reductions in November and February, aligning with the view that inflation persistence will delay further easing.
Westpac and ANZ are still penciling in a November cut, but both have softened their conviction. Analysts at Westpac noted that while disinflation remains broadly on track, recent strength in household spending and services inflation could force the RBA to wait for more evidence before pulling the trigger.
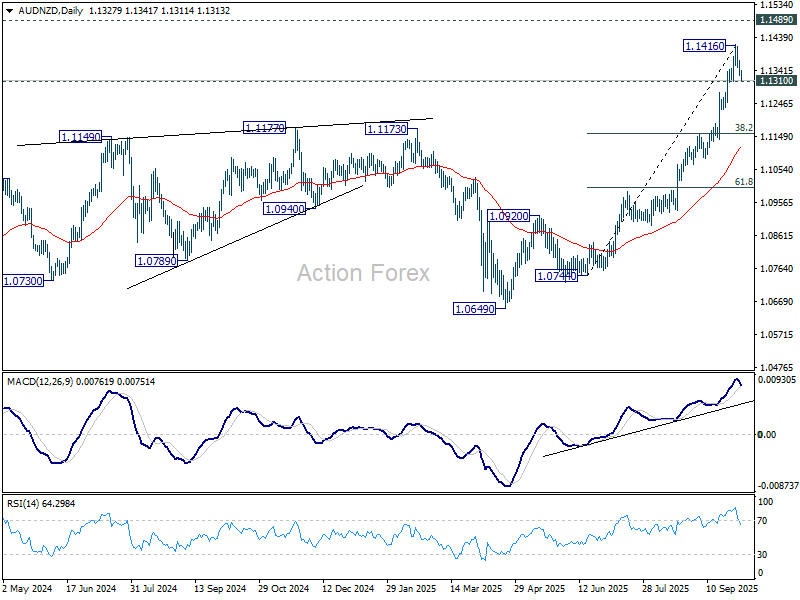
Nevertheless, traders appear reluctant to chase the currency higher, suggesting that the hawkish tilt might have already been well priced in. The fading momentum in AUD/NZD captures this fatigue most clearly, with the cross retreating after peaking at 1.1416.
Technically, the immediate focus is now on 1.1310 support. Decisive break there would confirm short-term top at 1.1416 and set the stage for a correction of the entire rally from 1.0744. In that case, the next target would be 38.2% retracement of 1.0744 to 1.1416 at 1.1159.
EUR/JPY Weekly Outlook
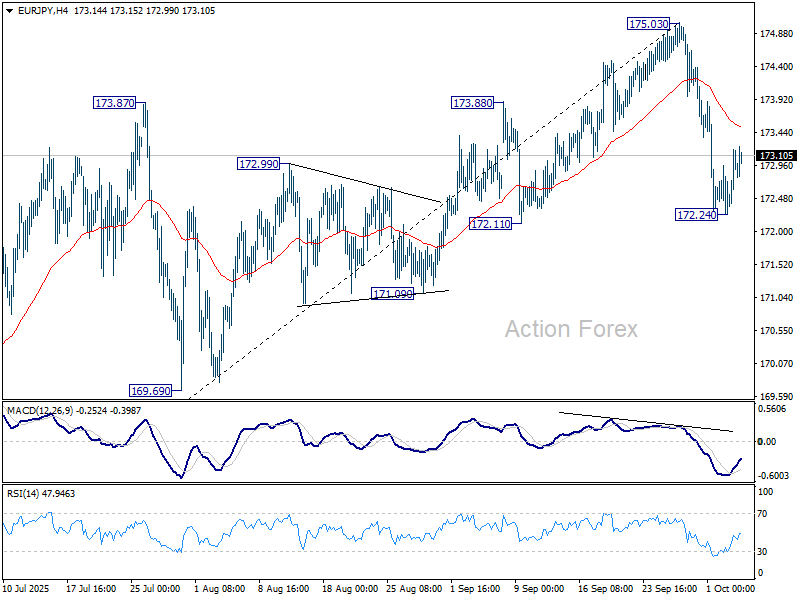
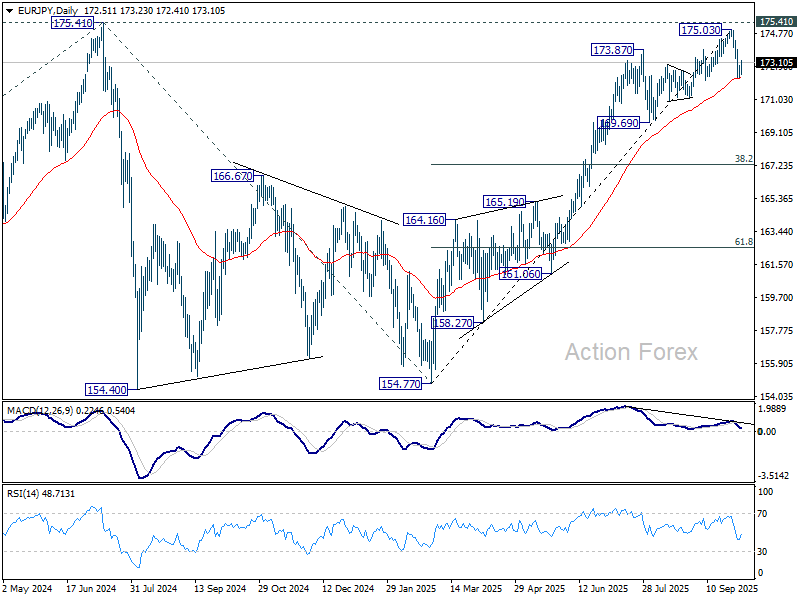
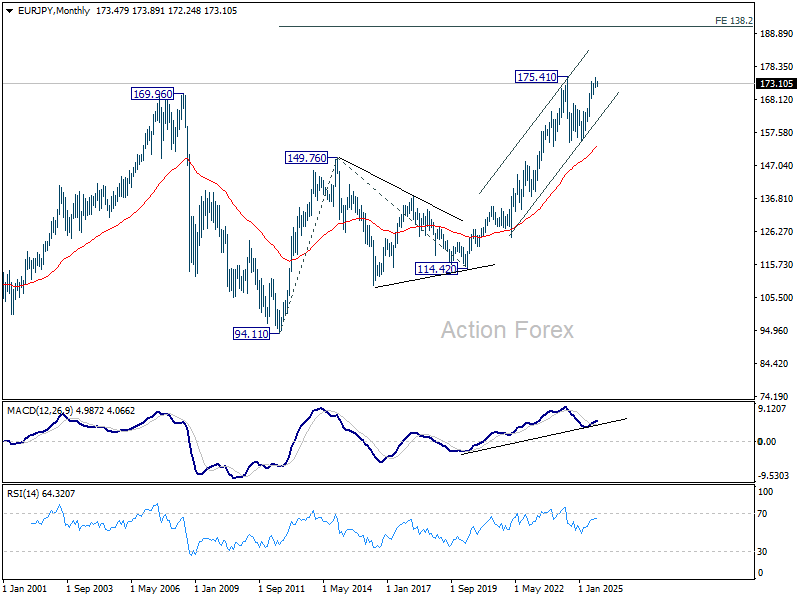
EUR/JPY's steep pullback last week confirmed short term topping at 175.03, just ahead of 175.41 high. But the cross then recovered after hitting 55 D EMA (now at 172.25). Initial bias remains neutral this week, with risk staying on the downside as long as 175.03 resistance holds. Considering bearish divergence condition in D MACD, sustained trading below 55 D EMA will indicate that whole five-wave rise from 154.77 has completed. Deeper decline should then be seen to 169.69 support next, and possibly to 38.2% retracement from 154.77 to 175.03 at 167.29.
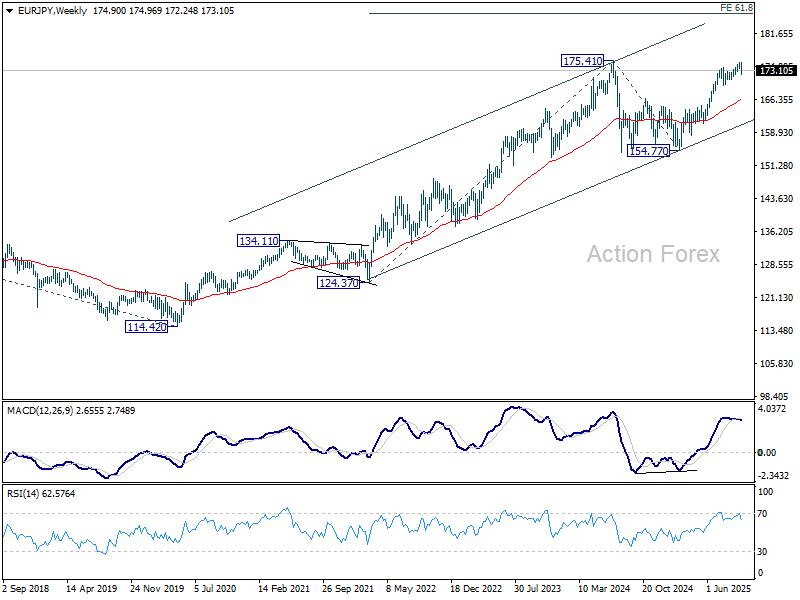
In the bigger picture, rise from 154.77 is seen as resuming the larger up trend from 114.42 (2020 low). While initial set back could be seen as it tests 175.41 (2024 high), outlook will stay bullish as long as 55 W EMA (now at 166.48) holds. However, sustained break of the 55 W EMA will dampen this bullish case, and bring deeper fall back to 154.77 to extend the pattern from 175.41.
In the long term picture, up trend from 94.11 (2021 low) is still in progress. On resumption, next target is 138.2% projection of 94.11 to 149.76 (2014 high) from 114.42 (2020 low) at 191.32. This will remain the favored case as long as 154.77 support holds.
EUR/USD Weekly Outlook
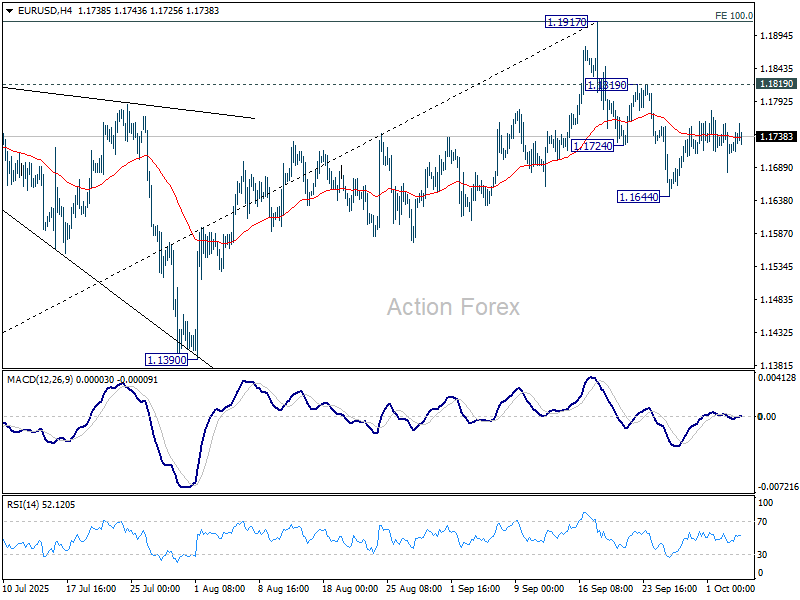
EUR/USD's stayed in range above 1.1644 last week and outlook is unchanged. Further fall is in favor as long as 1.1819 resistance holds. Break of 1.1644 and sustained trading below 55 D EMA (now at 1.1675) will indicate medium term topping at 1.1917, on bearish divergence condition in D MACD. Further fall should then be seen to 1.1390 support. Nevertheless, break of 1.1819 will retain near term bullishness and bring retest of 1.1917 high instead.
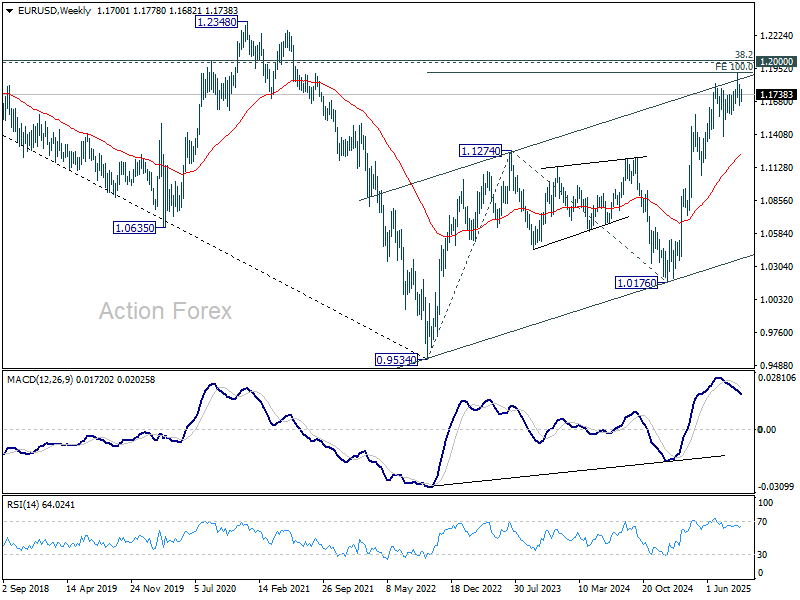
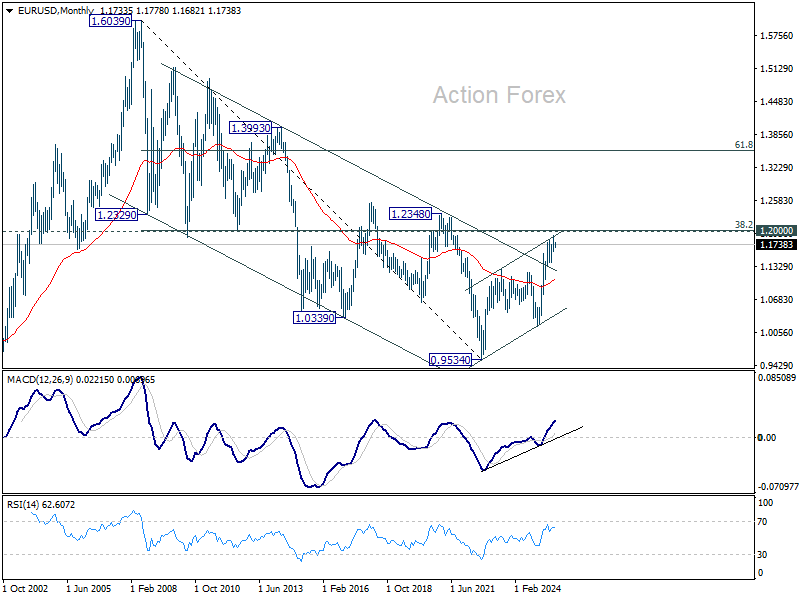
In the bigger picture, rise from 1.0176 (2025 low) is seen as the third leg of the pattern from 0.9534 (2022 low). 100% projection of 0.9534 to 1.1274 from 1.0176 at 1.1916 was already met. For now, further rally will remain in favor as long as 1.1390 support holds, and firm break of 1.2000 psychological level will carry larger bullish implications. However, firm break of 1.1390 will suggest that rise from 1.0176 has already completed and bring deeper fall to 55 W EMA (now at 1.1231).
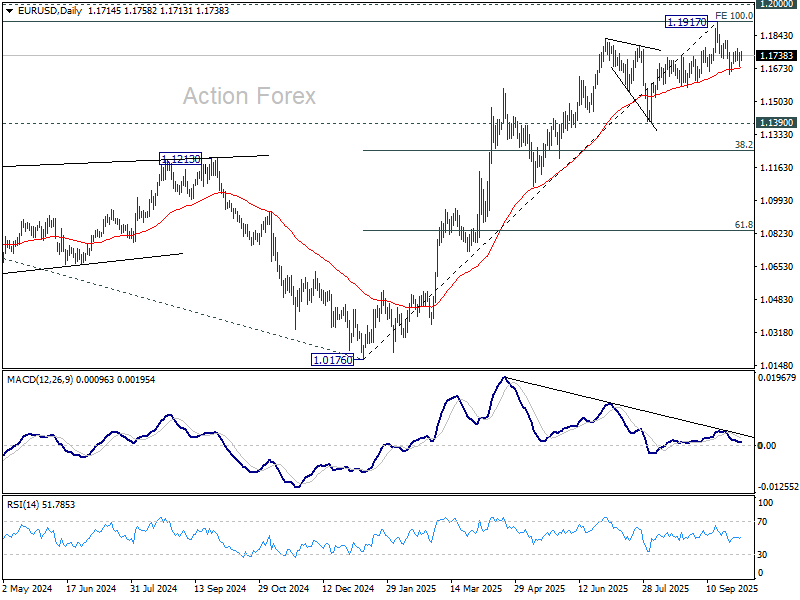
In the long term picture, 38.2% retracement of 1.6039 to 0.9534 at 1.2019, which is close to 1.2000 psychological level is the key for the outlook. Rejection by this level will keep the multi decade down trend from 1.6039 (2008 high) intact, and keep outlook neutral at best. However, decisive break of 1.2000/19, will suggest long term bullish trend reversal, and target 61.8% retracement at 1.3554.
USD/JPY Weekly Outlook
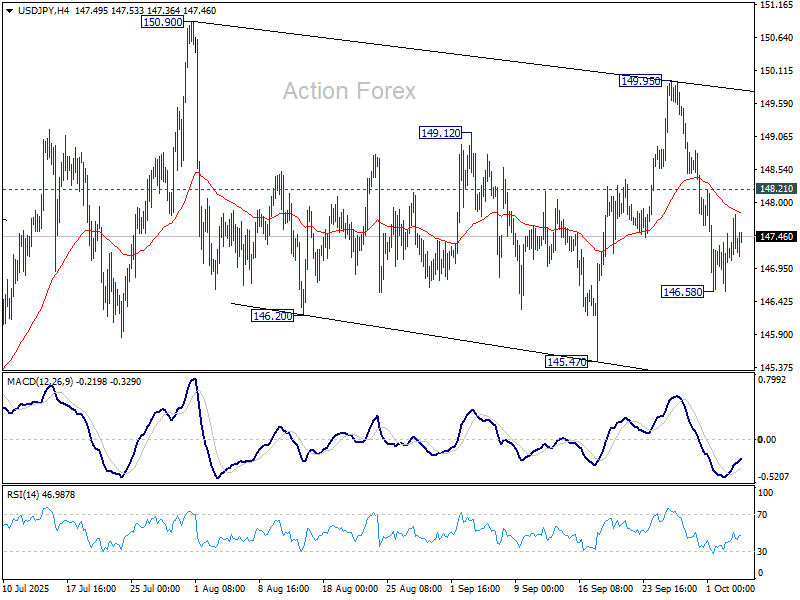
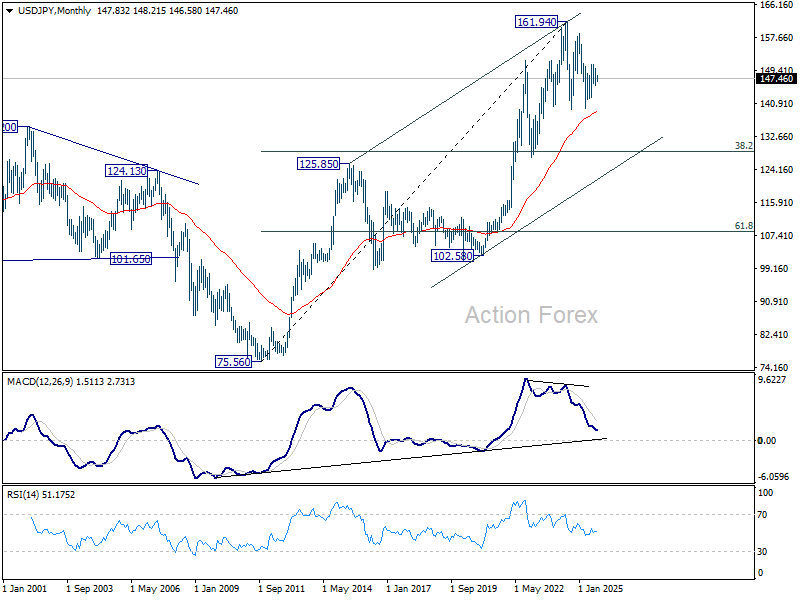
USD/JPY's steep decline last week suggests that rebound from 145.47 has completed at 149.95. But as a temporary low was formed at 146.58, initial bias remains neutral this week first. Overall, price actions from 150.90 are still seen as a corrective pattern. Above 148.21 will bring stronger rebound to 149.95 first. Firm break there should resume the whole rise from 139.87 to 151.22 fibonacci level. On the downside, though, below 146.58 will bring deeper fall to 145.47 support. Decisive break of 145.47 will indicate near term reversal.
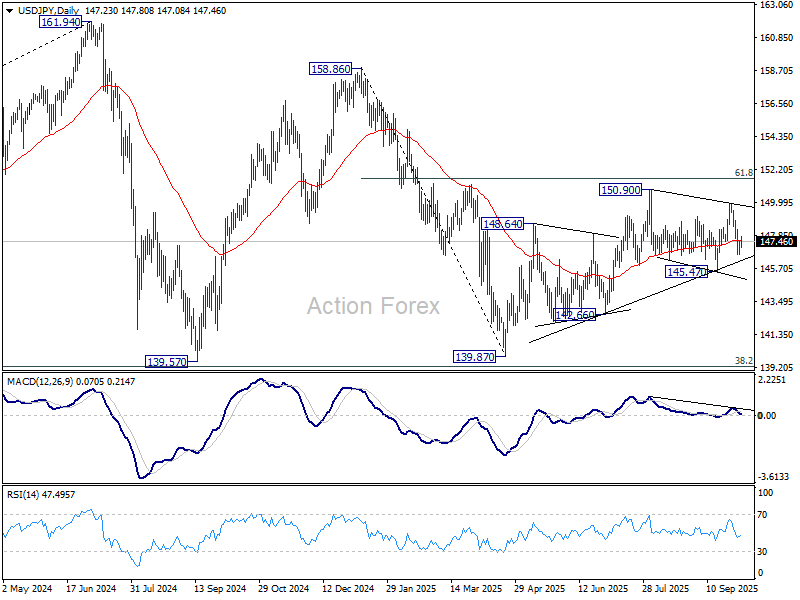
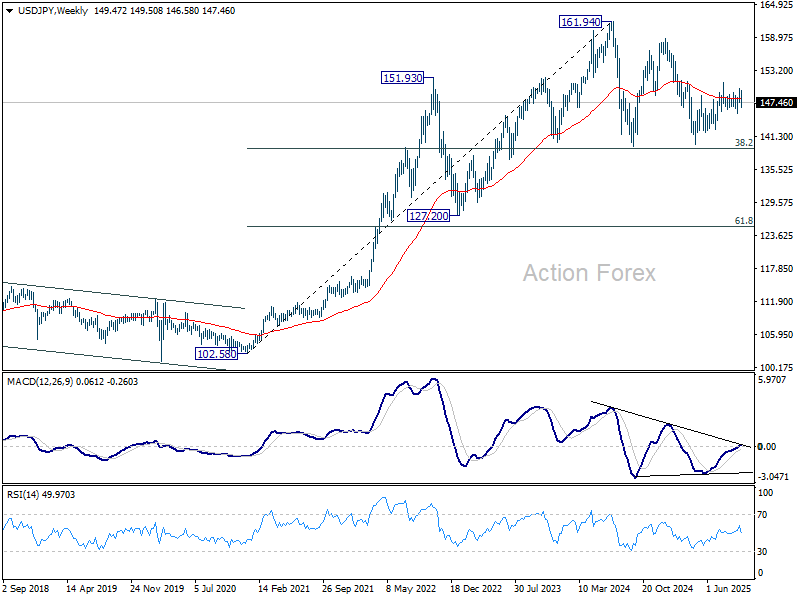
In the bigger picture, price actions from 161.94 (2024 high) are seen as a corrective pattern to rise from 102.58 (2021 low). Decisive break of 61.8% retracement of 158.86 to 139.87 at 151.22 will argue that it has already completed with three waves at 139.87. Larger up trend might then be ready to resume through 161.94 high. In case the corrective pattern extends with another fall, strong support is expected from 38.2% retracement of 102.58 to 161.94 at 139.26 to bring rebound.
In the long term picture, there is no sign that up trend from 75.56 (2011 low) has completed. But then, firm break of 161.94 is needed to confirm resumption. Otherwise, more medium term range trading could still be seen.
GBP/USD Weekly Outlook
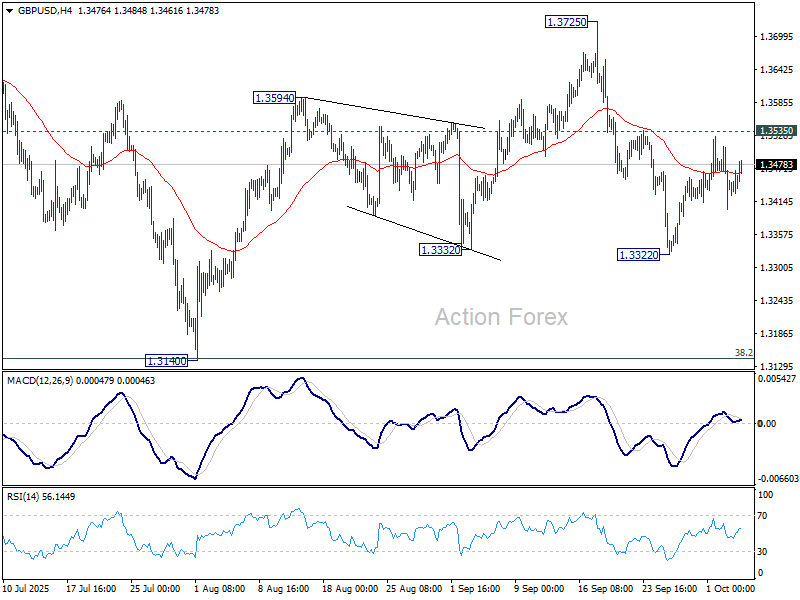
GBP/USD's recovery from 1.3322 extended higher last week, but failed to break through 1.3535 resistance. Initial bias remains neutral this week and further decline is in favor. Break of 1.3322 will resume the fall from 1.3725 to 1.3140 support. On the upside, though, firm break of 1.3535 will argue that pullback from 1.3725 has already completed, and bring stronger rise to retest 1.3725/87 key resistance zone.
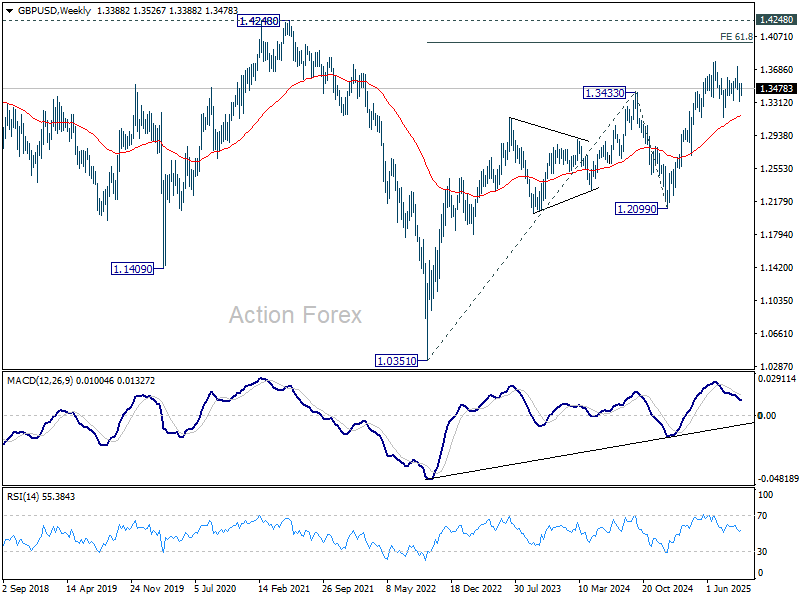
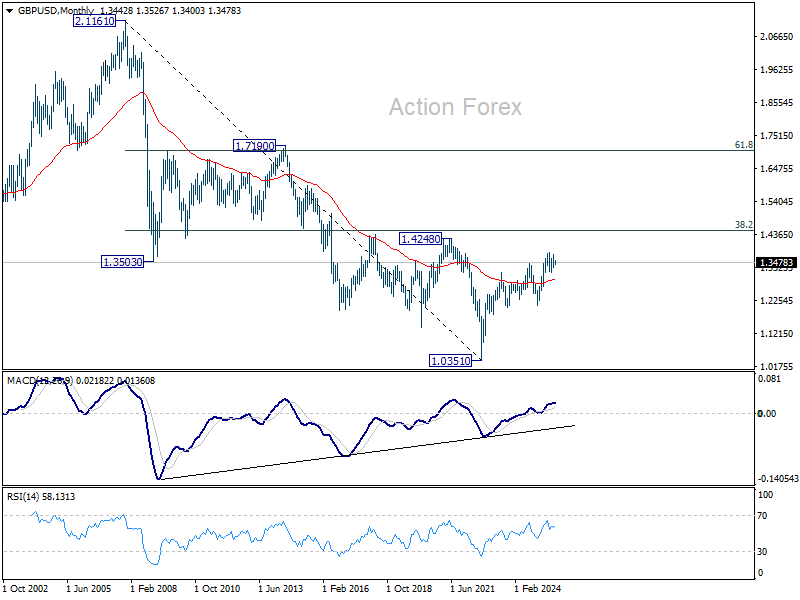
In the bigger picture, rise from 1.0351 (2022 low) is still seen as a corrective move. Further rally could be seen to 61.8% projection of 1.0351 to 1.3433 (2024 high) from 1.2099 (2025 low) at 1.4004. But strong resistance could be seen from 1.4248 (2021 high) to limit upside. Sustained break of 55 W EMA (now at 1.3166) will argue that a medium term top has already formed and bring deeper fall back to 1.2099.
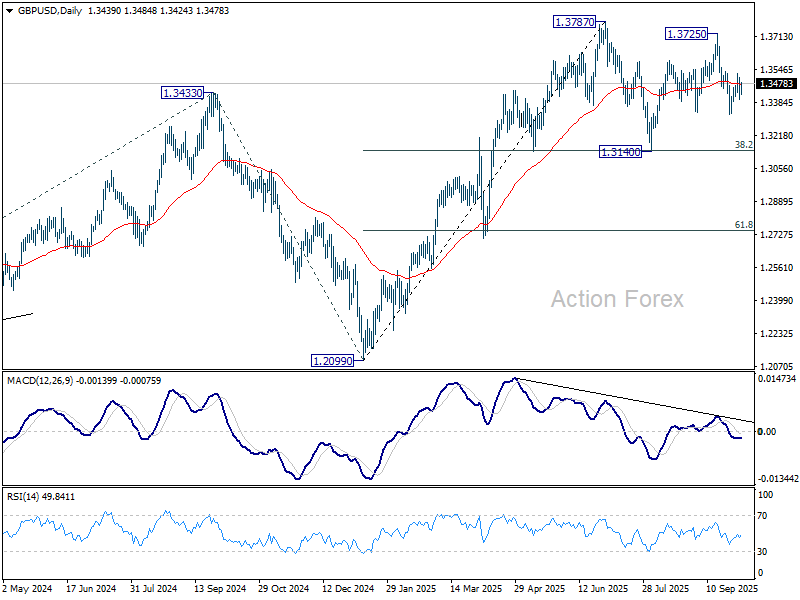
In the long term picture, as long as 1.4248/4480 resistance holds (38.2% retracement of 2.1161 to 1.0351 at 1.4480), the long term outlook will remain bearish. That is, price actions from 1.3051 are seen as a corrective pattern to the long term down trend from 2.1161 (2007 high) only. Nevertheless, decisive break of 1.4248/4480 will be a strong sign of long term bullish reversal.
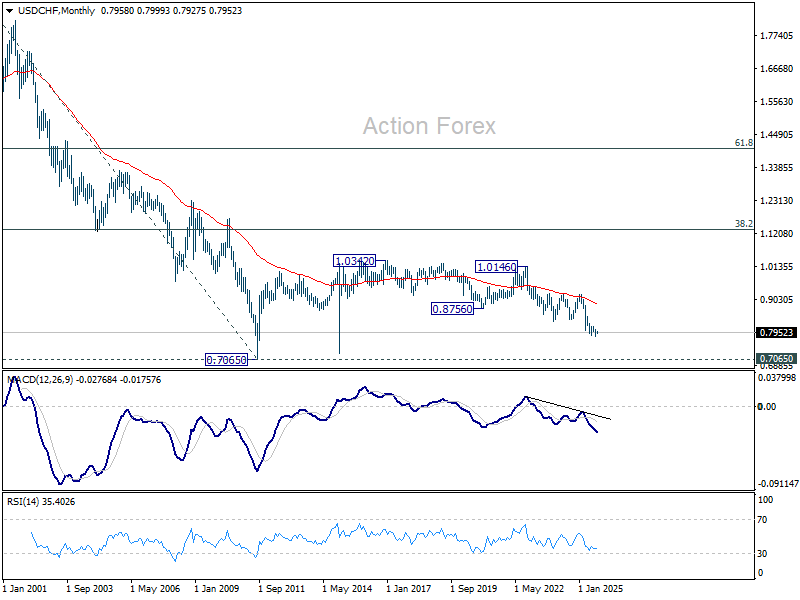
USD/CHF Weekly Outlook
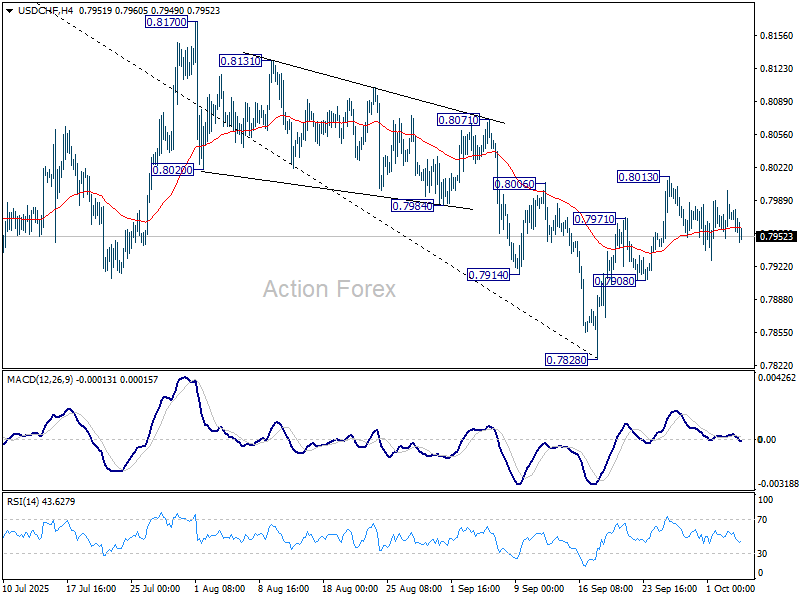
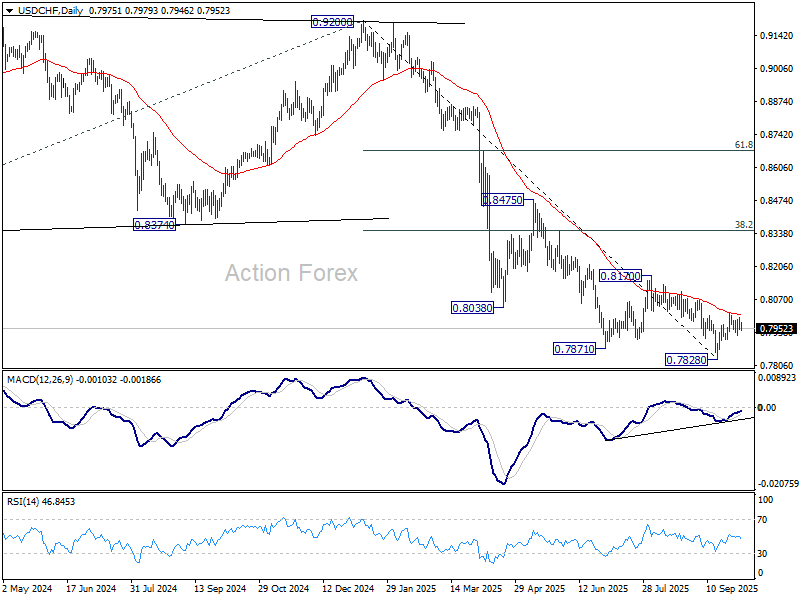
USD/CHF stayed in range trading below 0.8013 last week and outlook is unchanged. On the upside, sustained trading above 55 D EMA (now at 0.8008) will suggest that rise from 0.7828 is already correcting whole fall from 0.9200. Further rise should the be seen to 0.8170 resistance and possibly above. However, break of 0.7908 will turn bias back to the downside for retesting 0.7828 low.
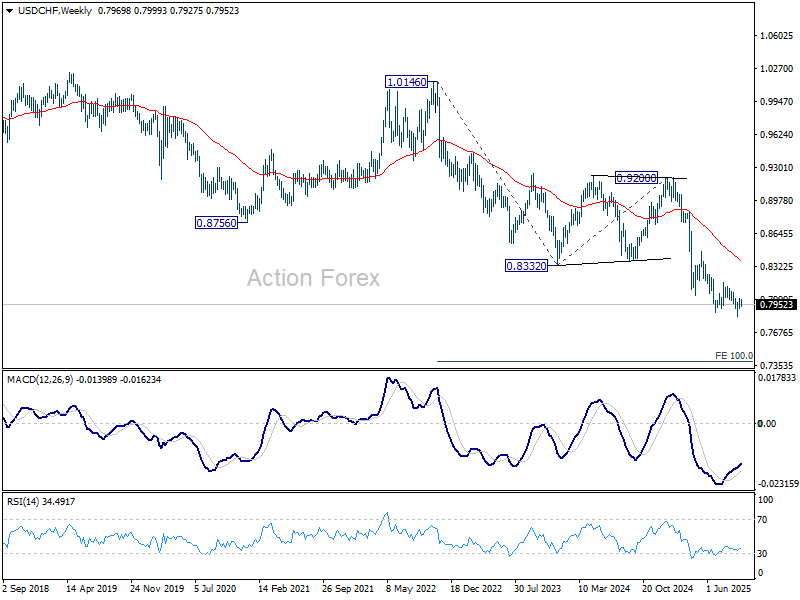
In the bigger picture, long term down trend from 1.0342 (2017 high) is still in progress. Next target is 100% projection of 1.0146 (2022 high) to 0.8332 from 0.9200 at 0.7382. In any case, outlook will stay bearish as long as 0.8332 support turned resistance holds (2023 low).
In the long term picture, price action from 0.7065 (2011 low) are seen as a corrective pattern to the multi-decade down trend from 1.8305 (2000 high). It's uncertain if the fall from 1.0342 is the second leg of the pattern, or resumption of the downtrend. But in either case, outlook will stay bearish as long as 0.8756 support turned resistance holds (2021 low). Retest of 0.7065 should be seen next.
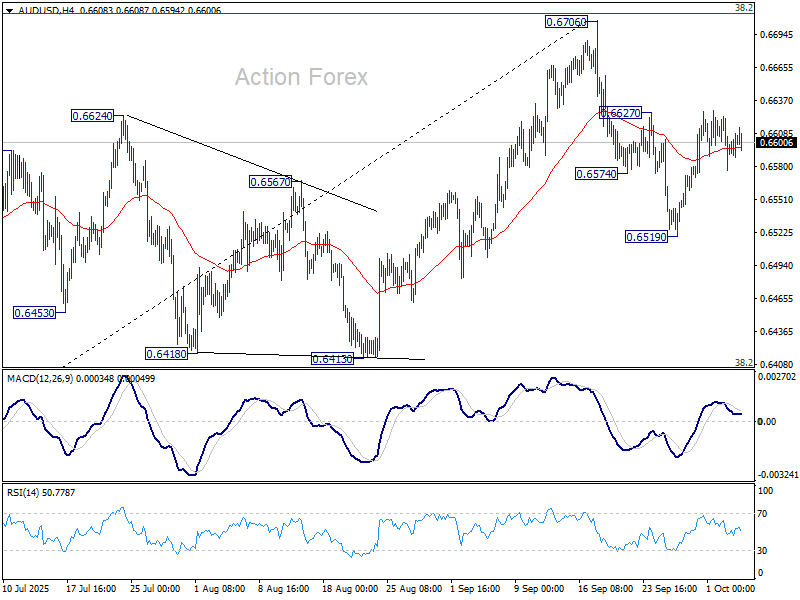
AUD/USD Weekly Report
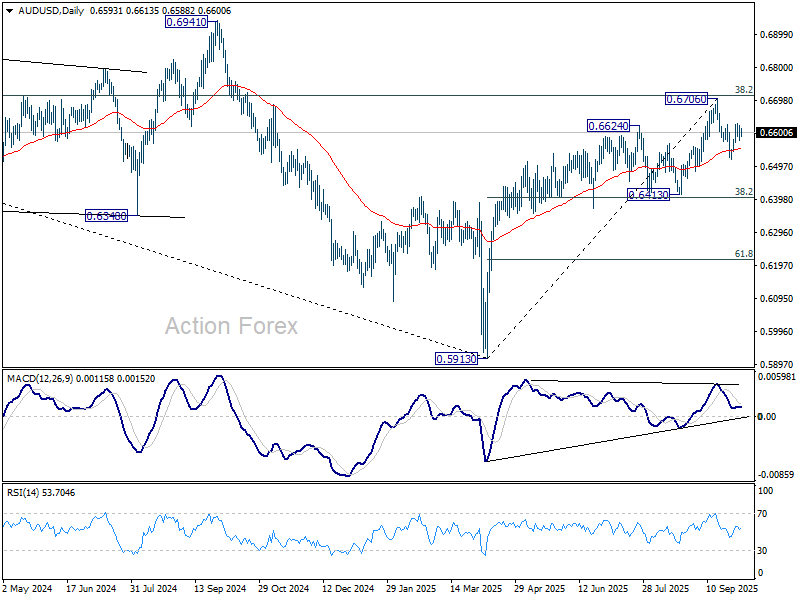
AUD/USD's rebound from 0.6519 extended higher last week but failed to break through 0.6627 resistance decisively. Initial bias remains neutral this week first. On the upside, firm break of 0.6627 resistance will suggest that pullback from 0.6706 has completed as correction, after drawing support from 55 D EMA (now at 0.6554). That will keep the larger rally from 0.5913 alive and bring retest of 0.6706 high. However, on the downside, sustained trading below 55 D EMA will confirm rejection by 0.6713 fibonacci resistance, and bring deeper fall to 0.6413 cluster support (38.2% retracement of 0.5913 to 0.6706 at 0.6403).
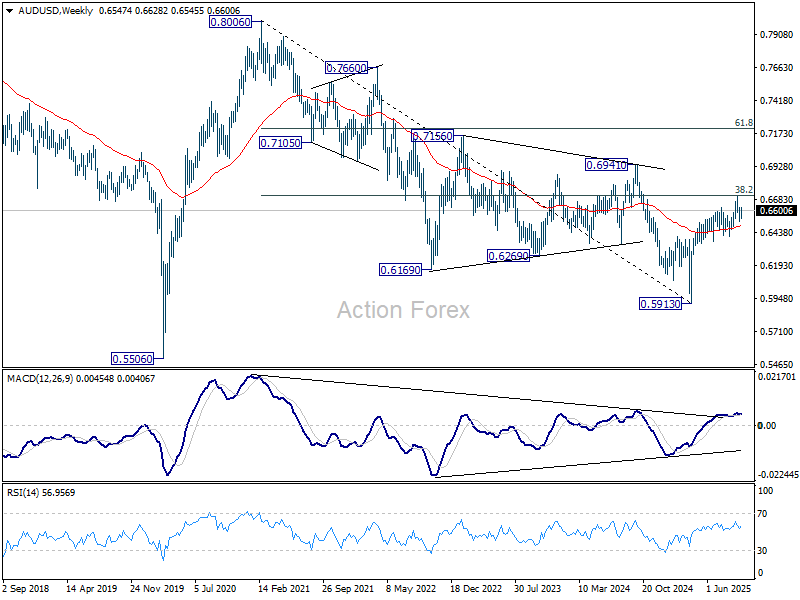
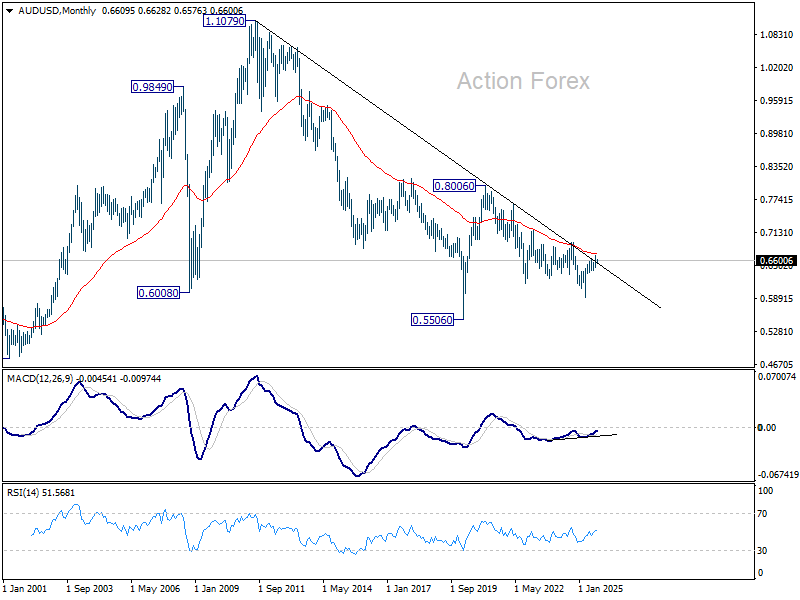
In the bigger picture, there is no clear sign that down trend from 0.8006 (2021 high) has completed. Rebound from 0.5913 is seen as a corrective move. Outlook will remain bearish as long as 38.2% retracement of 0.8006 to 0.5913 at 0.6713 holds. Nevertheless, considering bullish convergence condition in W MACD, sustained break of 0.6713 will be a strong sign of bullish trend reversal, and pave the way to 0.6941 structural resistance for confirmation.
In the long term picture, fall from 0.8006 is seen as the second leg of the corrective pattern from 0.5506 long term bottom (2020 low). Hence, in case of deeper decline, strong support should emerge above 0.5506 to contain downside to bring reversal. On the upside, firm break of 0.6941 will argue that the third leg has already started back to 0.8006.
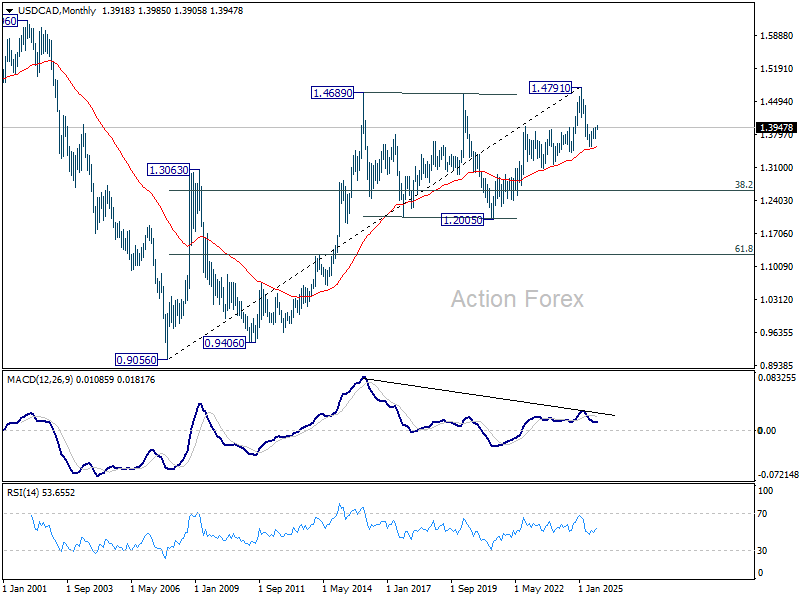
USD/CAD Weekly Outlook
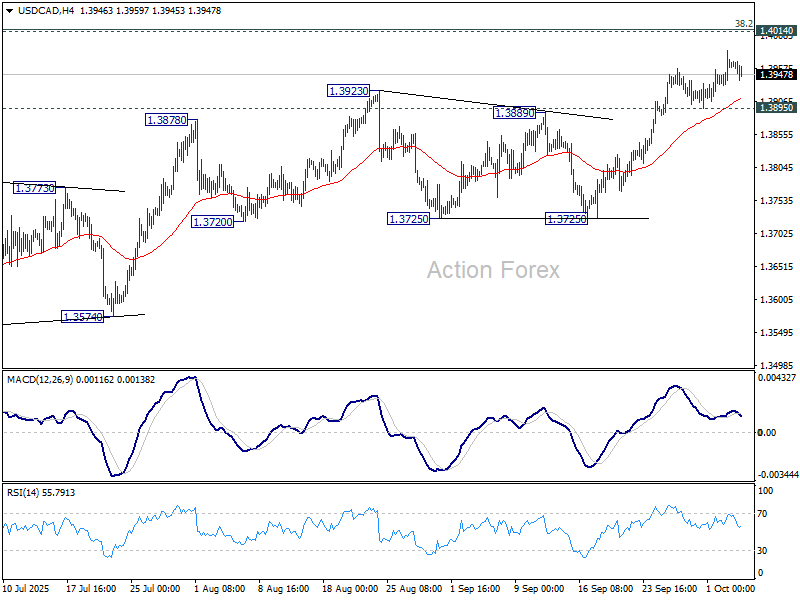
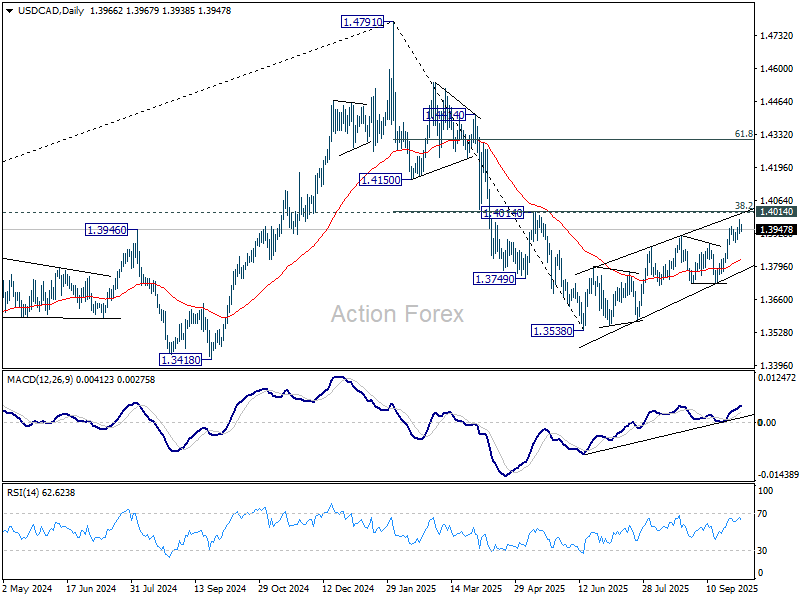
USD/CAD's corrective rise from 1.3538 continued week. Initial bias stays mildly on the upside this week for 1.4014 cluster. But strong resistance should be seen there to complete the corrective rally. On the downside, below 1.3895 support will turn bias back to the downside for 1.3725. However, sustained break of 1.4014 will carry larger bullish implications.
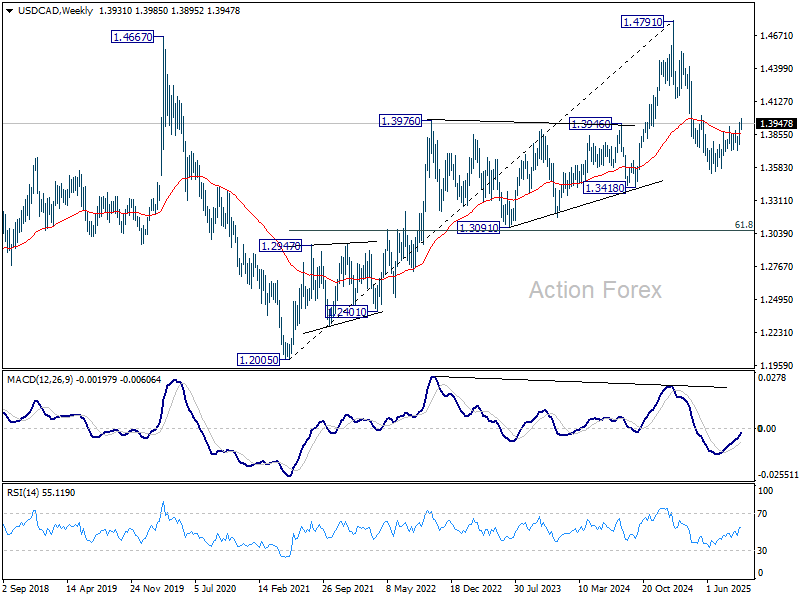
In the bigger picture, price actions from 1.4791 medium term top could either be a correction to rise from 1.2005 (2021 low), or trend reversal. In either case, further decline is expected as long as 1.4014 cluster resistance (38.2% retracement of 1.4791 to 1.3538 at 1.4017) holds. Next target is 61.8% retracement of 1.2005 (2021 low) to 1.4791 (2025 high) at 1.3069. However, sustained break of 1.4014 will argue that fall from 1.4791 has completed, and bring stronger rally to 61.8% retracement at 1.4312.
In the long term picture, considering bearish divergence condition in M MACD, up trend from 0.9506 (2027 low) might have completed with five waves up to 1.4791. Sustained trading below 55 M EMA (now at 1.3525) will solidify this case and bring deeper medium term fall to 38.2% retracement of 0.9056 to 1.4791 at 1.2600, even as a correction. Nevertheless, strong rebound from the 55 E MEA will retain bullishness for up trend resumption through 1.4791 later.
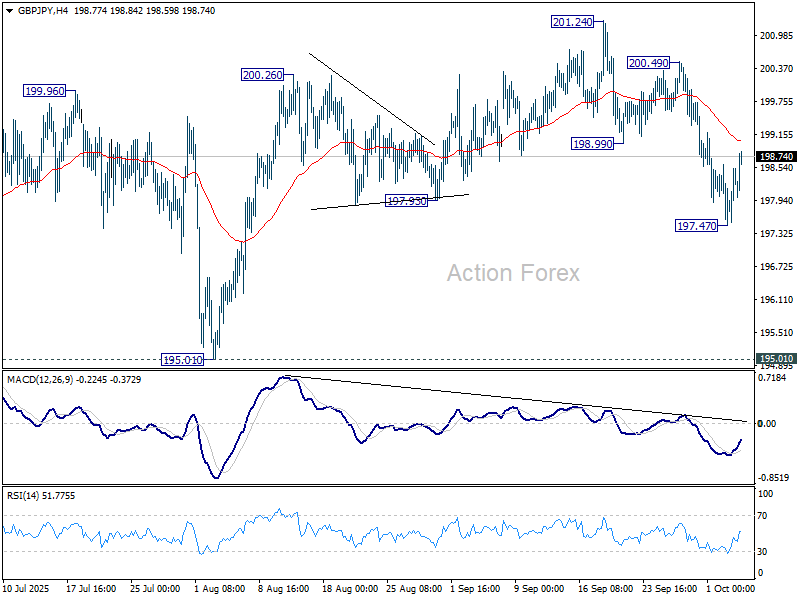
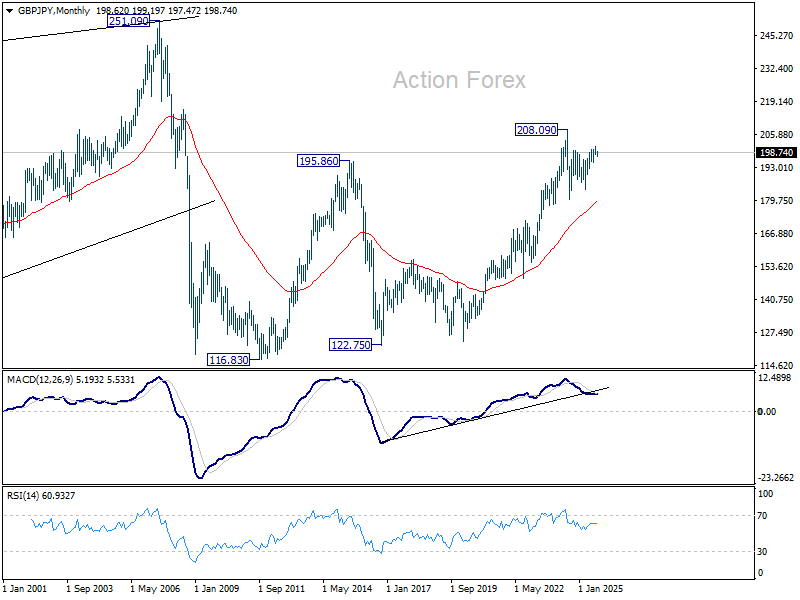
GBP/JPY Weekly Outlook
GBP/JPY's fall from 201.24 extended lower last week but recovered after hitting 197.47. Initial bias remains neutral this week first, but risk will stay on the downside as long as 200.49 resistance holds. Below 197.47 will target 195.01 structural support. Firm break there will indicate that rise fro 184.35 has completed, and possibly the pattern from 180.00 too. Near term outlook will then turn bearish.
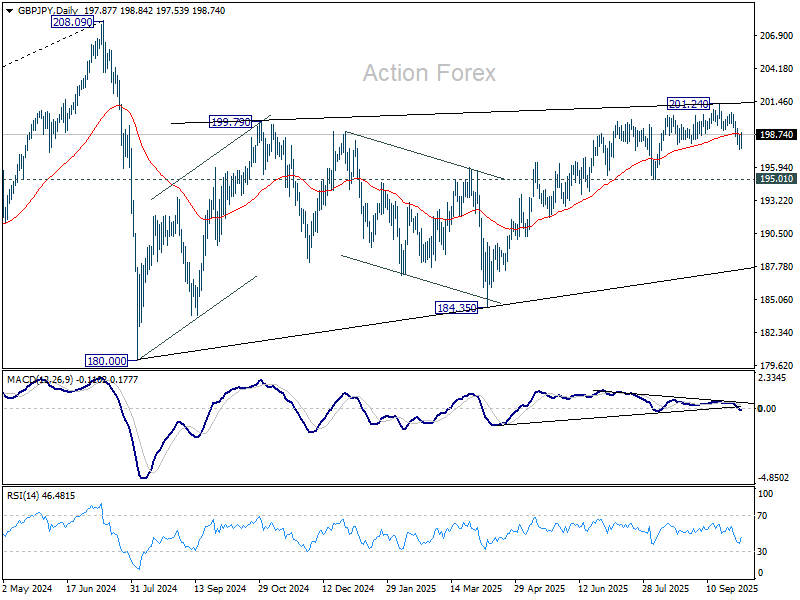
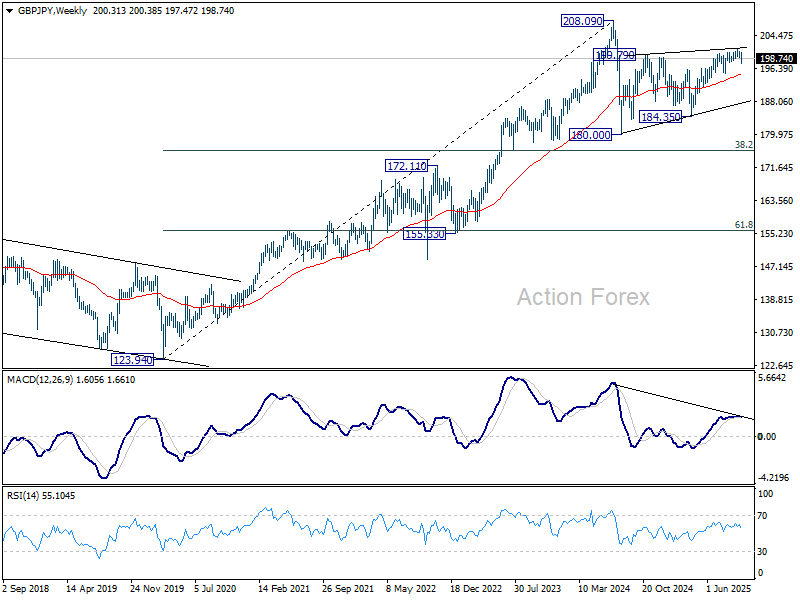
In the bigger picture, price actions from 208.09 (2024 high) are seen as a correction to rally from 123.94 (2020 low). The pattern might still extend with another falling leg. But in that case, strong support should be seen from 38.2% retracement of 123.94 to 208.09 at 175.94 to contain downside. Meanwhile, decisive break of 208.09 will confirm long term up trend resumption.
In the long term picture, there is no sign that the long term up trend from 122.75 (2016 low) has concluded. But firm break of 208.09 is needed to confirm resumption. Otherwise, more medium term range trading could still be seen.
EUR/JPY Weekly Outlook
EUR/JPY's steep pullback last week confirmed short term topping at 175.03, just ahead of 175.41 high. But the cross then recovered after hitting 55 D EMA (now at 172.25). Initial bias remains neutral this week, with risk staying on the downside as long as 175.03 resistance holds. Considering bearish divergence condition in D MACD, sustained trading below 55 D EMA will indicate that whole five-wave rise from 154.77 has completed. Deeper decline should then be seen to 169.69 support next, and possibly to 38.2% retracement from 154.77 to 175.03 at 167.29.
In the bigger picture, rise from 154.77 is seen as resuming the larger up trend from 114.42 (2020 low). While initial set back could be seen as it tests 175.41 (2024 high), outlook will stay bullish as long as 55 W EMA (now at 166.48) holds. However, sustained break of the 55 W EMA will dampen this bullish case, and bring deeper fall back to 154.77 to extend the pattern from 175.41.
In the long term picture, up trend from 94.11 (2021 low) is still in progress. On resumption, next target is 138.2% projection of 94.11 to 149.76 (2014 high) from 114.42 (2020 low) at 191.32. This will remain the favored case as long as 154.77 support holds.
EUR/GBP Weekly Outlook
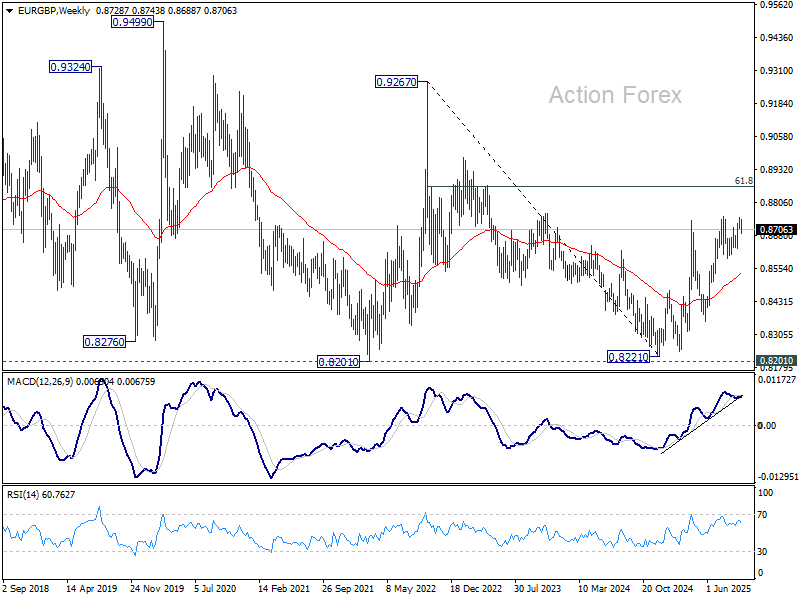
EUR/GBP stayed in consolidations below 0.8750 last week and outlook is unchanged. Initial bias stays neutral this week first. On the downside, break of 0.8688 will extend the fall to 0.8631 support. Decisive break there will indicate near term bearish reversal. On the upside, though, above 0.8750 will resume the larger rally towards 0.8867 fibonacci level.

In the bigger picture, rise from 0.8221 medium term bottom is seen as a corrective move. While further rally cannot be ruled out, upside should be limited by 61.8% retracement of 0.9267 to 0.8221 at 0.8867. Considering bearish divergence condition in D MACD, firm break of 0.8631 support will be the first sign that this corrective bounce has completed. Sustained trading below 55 W EMA (now at 0.8539) will confirm, and bring retest of 0.8221 low.
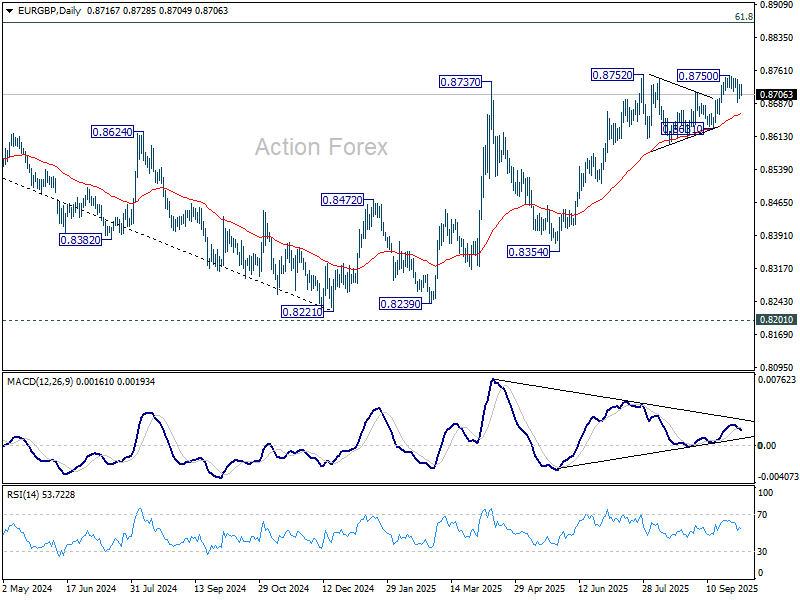
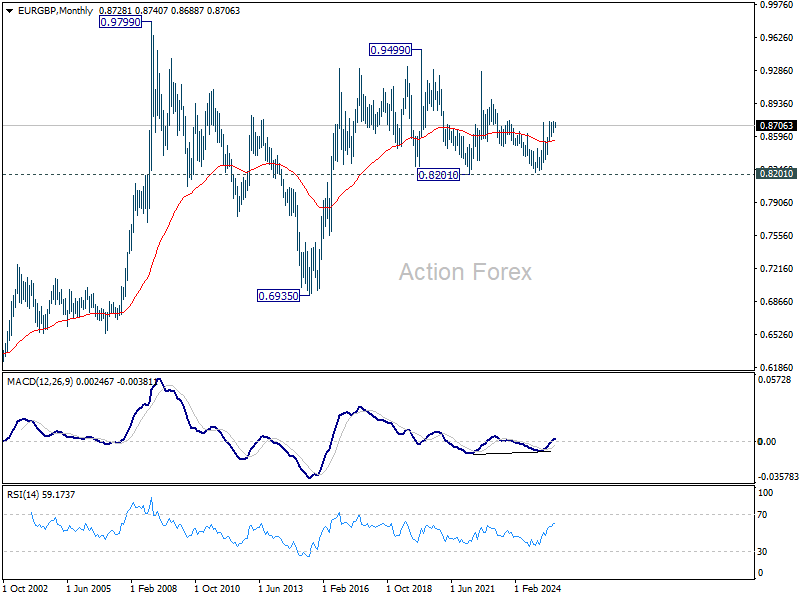
In the long term picture, price action from 0.9499 (2020 high) is seen as part of the long term range pattern from 0.9799 (2008 high). Range trading should continue between 0.8201 and 0.9499, until there is clear signal of imminent breakout.