Sample Category Title
BoJ report highlights resilient recovery but tariffs cloud wage, capex outlook
The BoJ’s Regional Economic Report released today painted a mixed picture of recovery, with assessments for eight regions left unchanged and one downgraded. Most local economies were described as “recovering moderately” or “picking up” .
Businesses in some areas reported that they may scale back wage hikes if tariffs begin to bite into profits, a risk that could slow Japan’s nascent wage-led inflation. Still, several regions pointed to ongoing wage pressures from tight labor markets and rising living costs, suggesting that the underlying trend in income growth remains intact for now.
The survey also revealed continued commitment to capital investment, particularly in automation and IT-related projects, as firms seek efficiency gains. However, a number of companies plan to delay or reassess spending amid uncertainty over global demand and the evolving impact of tariffs.
Japanese Prime Minister to be Sends Tremors Across Bond Markets
Markets
The Japanese prime minister to be is sending tremors across bond markets. Takaichi won this weekend’s LDP elections (see below) and is therefore on track to become premier. She’ll be the country’s first ever female leader, has a nationalist bent with conservative foreign policy views and as an Abenomics-adept a strong taste for fiscal support. Add an already enormous debt pile, inflation well above the Bank of Japan’s 2% target and Takaichi’s open criticism on previous rate hikes, and you have a deadly cocktail for (long-term) bonds. The 30-40 yr yield bucket rips 13+ bps higher and is dragging the rest with it. US yields add between 0.6 and 4.2 bps in a steepening move. These follow on Friday’s 2.3-4.5 bps bear flattening. An across-the-board weaker than expected services ISM triggered a kneejerk yield reaction lower first before rebounding. It suggests US markets are comfortable for the time being pricing in two regular (instead of e.g. 50 bps jumbo) rate cuts for the remainder of 2025. German bund futures drop in early trading this morning, suggesting a higher open compared to Friday’s broadly unchanged close. French OATs face a worse fate. They underperform on president Macron appointing more or less the same cabinet the ousted PM Bayrou had worked with. Markets fear the incumbent premier Lecornu is headed for the same direction (aka exit). That would leave the dire budget situation unaddressed for yet another several weeks to months. We’re keen to find out UK gilts’ reaction to the public finances/fiscal policy theme reclaiming its spot at the center of attention. The Japanese yen is lagging global peers. The risk of pro-inflationary fiscal policy whacks JPY to an all-time low against the euro to EUR/JPY 176+. USD/JPY bounces to 150.3, nearing the upper bound of this summer’s trading range. The common currency is feeling a bit of selling pressure against the USD, perhaps inspired by the French political limbo. EUR/USD inches lower to 1.172. Stocks meanwhile are surfing the fiscal wave textbook-style. Japanese equities surge 5% and more. European and US futures (for what they are worth) suggest slight gains at the open, be it to new record highs. We expect the theme of public finances to direct trading at least for today given the empty economic calendar. ECB’s Lagarde (before the EU parliament) and Bank of England’s Bailey do have speeches planned that are worth following up. For the remainder of the week we’ll be watching tomorrow’s Japanese 30-yr bond sale, a litmus test for investor appetite in a drastically changed political environment. The US calendar is stripped of the usual government data (trade balance, jobless claims) but Michigan consumer sentiment is on tap for Friday. The beginning-of-the-month refinancing round kicks off tomorrow with the 3-yr auction. Wednesday and Thursday features a 10-yr and 30-yr note sale respectively. The September meeting minutes are scheduled for release by the Fed (Wednesday) and ECB (Thursday).
News & Views
In Parliamentary elections in the Czech Republic, the ANO party of former Prime Minister Andrej Babis came out as the strongest party with about 35% of the votes. That was well ahead of the Spolu group of Prime Minister Petr Fiala that only received 23.4% of the votes. Andrej Babis indicated that he will try to from a government with this ANO party looking for support of two smaller parties, the far right Freedom and Direct Democracy party and populist Motorists party. Combined with 80 seats of ANO, the two smaller parties might provide the ANO government a support of 108 from the 200 votes in the new parliament. Babis in his campaign indicated that he intended to scale back the policy of fiscal austerity of the previous government. On foreign policy, Babis signaled a policy that is more skeptical on the European Union, amongst others on immigration and on support for Ukraine. At the same time he indicated he didn’t intend any kind of ‘Czexit’ policy. Early indications this morning suggest that the Czech koruna might keep recent gains with EUR/CZK trading near 24.25.
In Japan, Sanae Takaichi came out as the winner of the leadership elections of the ruling LDP party. As such she is expected to become the first ever female Prime Minister of the country. The new LDP leader has a conservative profile and is expected to set out an stimulative fiscal (and monetary) policy in the style of Abenomics. In international policy, she may shift to a more nationalist regional approach. A fiscal supportive policy might be supportive of Japanese risk assets, but might meet with further pressure/risk premia for especially longer term Japanese bonds and might further weaken the yen even as inflation is holding above the BoJ target. In this respect, markets also question the impact of the new government on the BoJ independently continuing its policy normalization with follow-up rate hikes in the near future.
GBP/JPY Daily Outlook
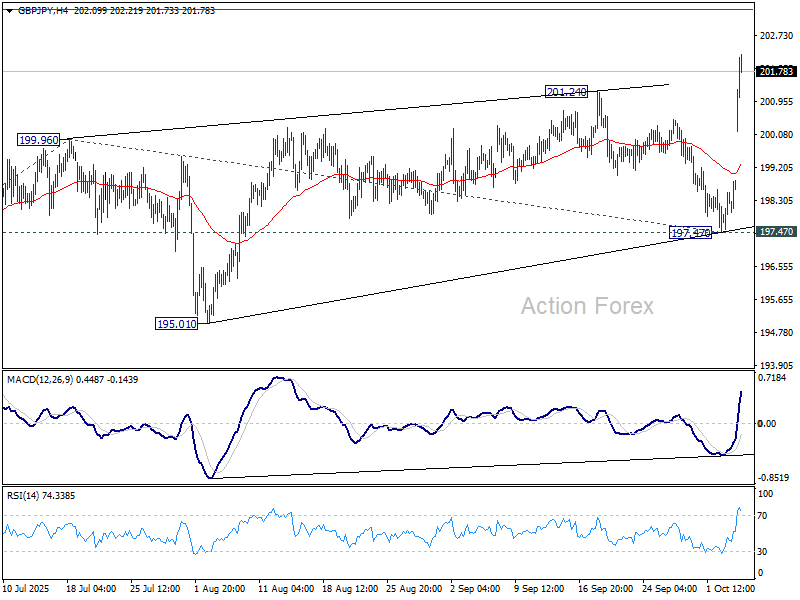
Daily Pivots: (S1) 198.02; (P) 198.45; (R1) 199.23; More...
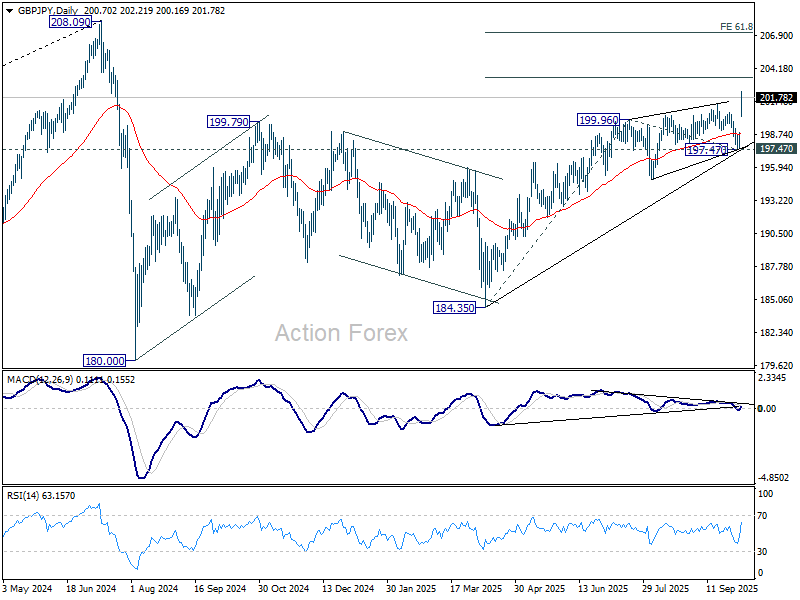
GBP/JPY's rise from 184.35 resumed by breaking through 201.24 and intraday bias is back on the upside. Next near term target is 38.2% projection of 184.35 to 199.96 from 197.47 at 203.43. Firm break there will target 61.8% projection at 207.11 next. For now, outlook will remain bullish as long as 197.47 support holds, in case of retreat.
In the bigger picture, price actions from 208.09 (2024 high) are seen as a correction to rally from 123.94 (2020 low). The pattern might still extend with another falling leg. But in that case, strong support should be seen from 38.2% retracement of 123.94 to 208.09 at 175.94 to contain downside. Meanwhile, decisive break of 208.09 will confirm long term up trend resumption.
EUR/JPY Daily Outlook
Daily Pivots: (S1) 172.68; (P) 172.96; (R1) 173.50; More...
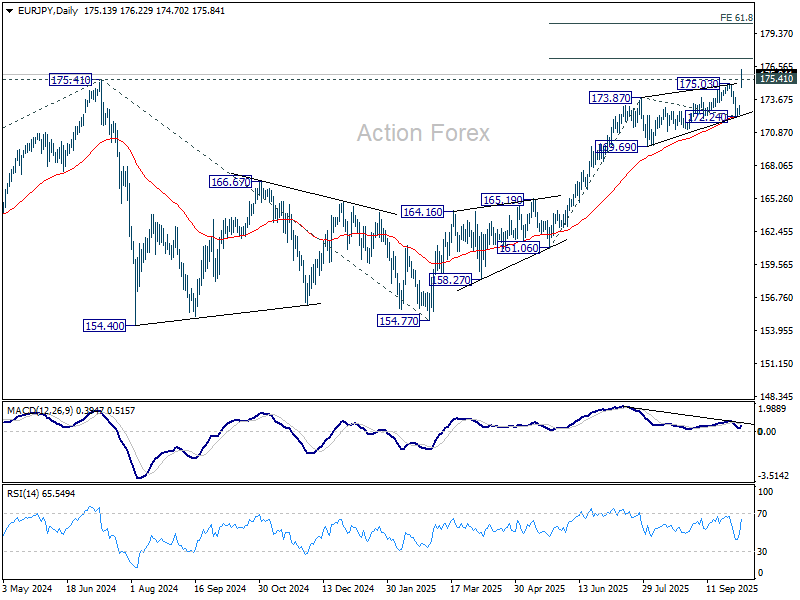
EUR/JPY's up trend resumed by breaking through 175.41 key resistance. Intraday bias is back on the upside. Next near term target is 38.2% projection of 161.06 to 173.87 from 172.24 at 177.13. Firm break there will open the path to 61.8% projection at 180.15. For now, outlook will stay bullish as long as 172.24 support holds, in case of retreat.
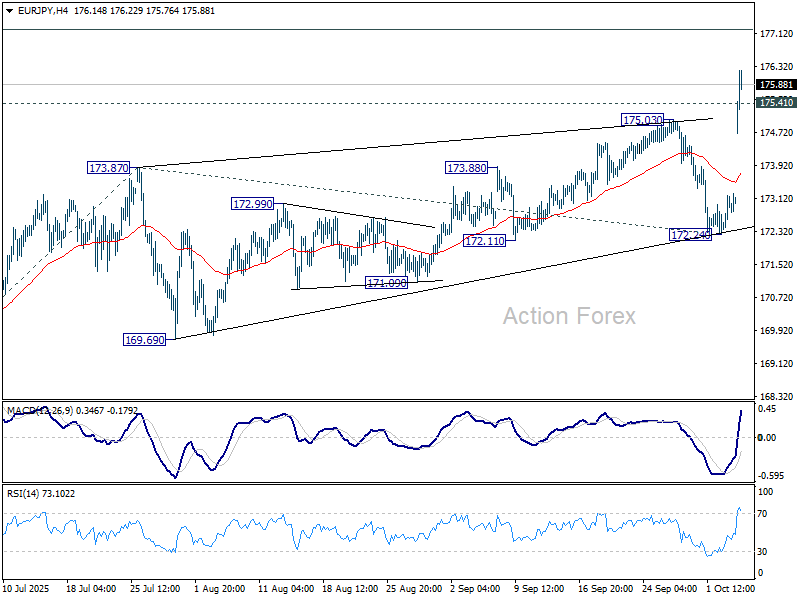
In the bigger picture, up trend from 114.42 (2020 low) is resuming with break of 175.41 (2024 high). Next target is 61.8% projection of 124.37 to 175.41 from 154.77 at 186.31. Outlook will continue to stay bullish as long as 55 W EMA (now at 166.82) holds, even in case of deep pullback.
EUR/GBP Daily Outlook
Daily Pivots: (S1) 0.8704; (P) 0.8717; (R1) 0.8727; More...
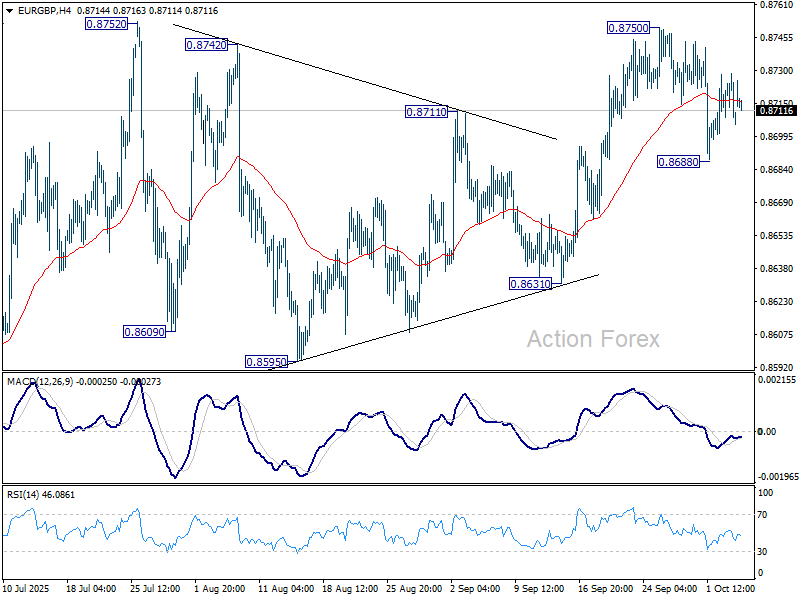
Intraday bias in EUR/GBP stays neutral and more consolidations could be seen below 0.8750. On the downside, break of 0.8688 will extend the from 0.8750 fall to 0.8631 support. Decisive break there will indicate near term bearish reversal. On the upside, though, above 0.8750 will resume the larger rally towards 0.8867 fibonacci level.
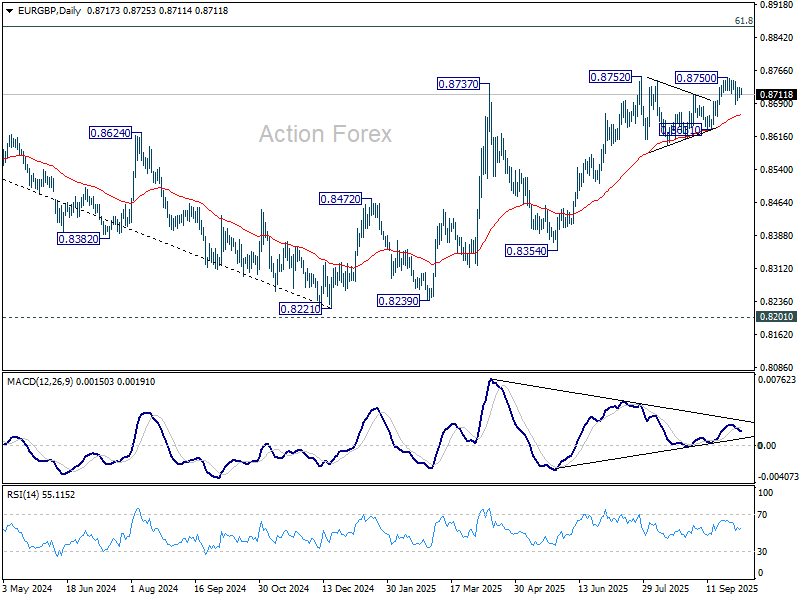
In the bigger picture, rise from 0.8221 medium term bottom is seen as a corrective move. While further rally cannot be ruled out, upside should be limited by 61.8% retracement of 0.9267 to 0.8221 at 0.8867. Considering bearish divergence condition in D MACD, firm break of 0.8631 support will be the first sign that this corrective bounce has completed. Sustained trading below 55 W EMA (now at 0.8539) will confirm, and bring retest of 0.8221 low.
EUR/AUD Daily Outlook
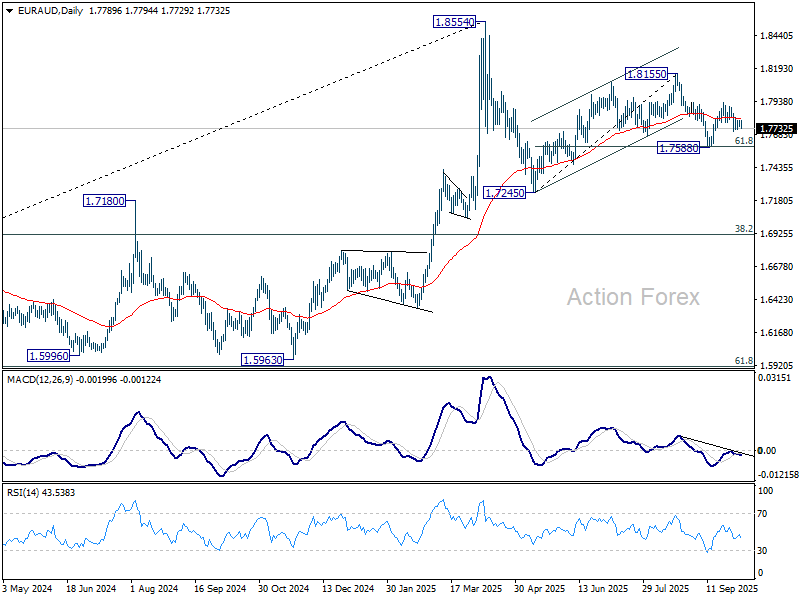
Daily Pivots: (S1) 1.7760; (P) 1.7779; (R1) 1.7806; More...
Intraday bias in EUR/AUD stays neutral at this point. On the downside, however, sustained break of 61.8% retracement of 1.7245 to 1.8155 at 1.7593 will bring deeper fall to 1.7245 resistance, as part of the corrective pattern from 1.8554 high.
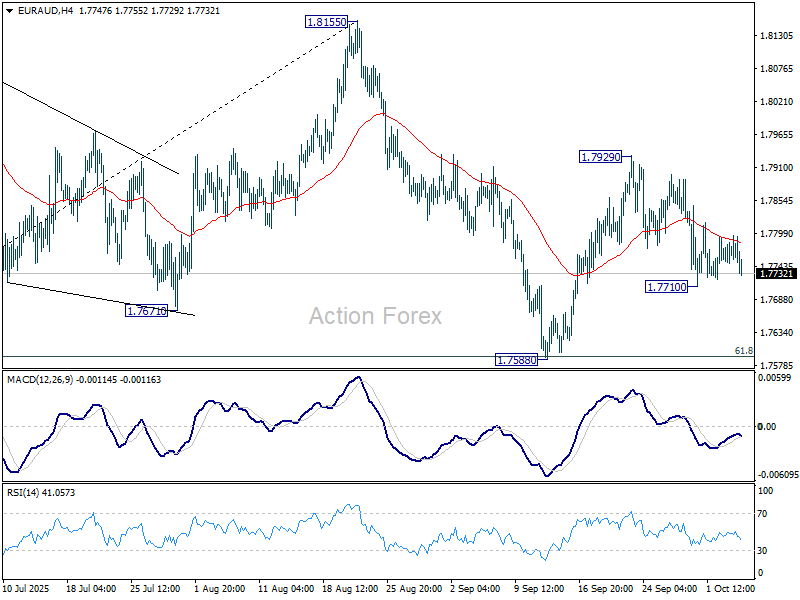
In the bigger picture, price actions from 1.8554 medium term top are seen as a corrective pattern. Deeper fall could be seen as the pattern extends, but downside should be contained by 38.2% retracement of 1.4281 (2022 low) to 1.8554 at 1.6922 to bring rebound. Uptrend from 1.4281 is expected to resume at a later stage.
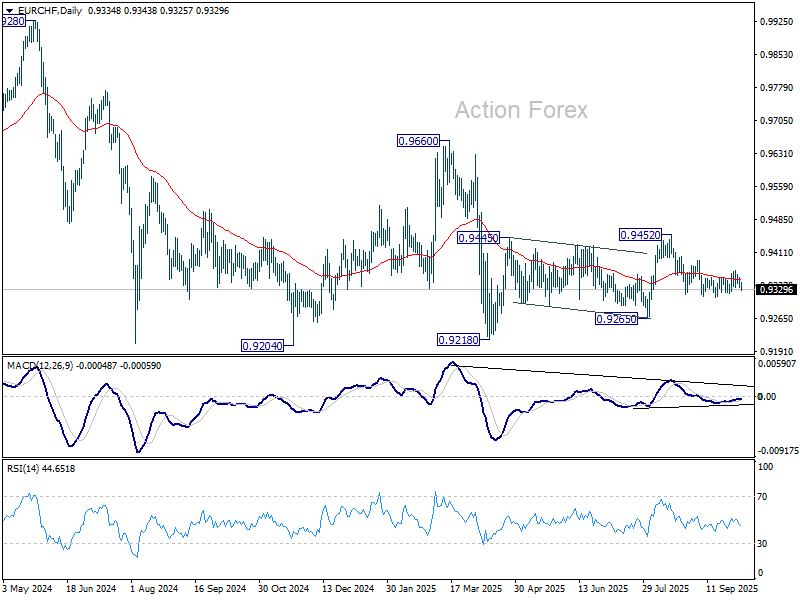
EUR/CHF Daily Outlook
Daily Pivots: (S1) 0.9329; (P) 0.9345; (R1) 0.9355; More...
EUR/CHF dips mildly today but stays above 0.9311 support and intraday bias stays neutral. As price actions from 0.9311 are corrective looking, fall from 0.9452 is likely still in progress. On the downside, break of 0.9311 will target 0.9265 support next. For now, risk will stay on the downside as long as 0.9394 resistance holds, in case of another recovery.
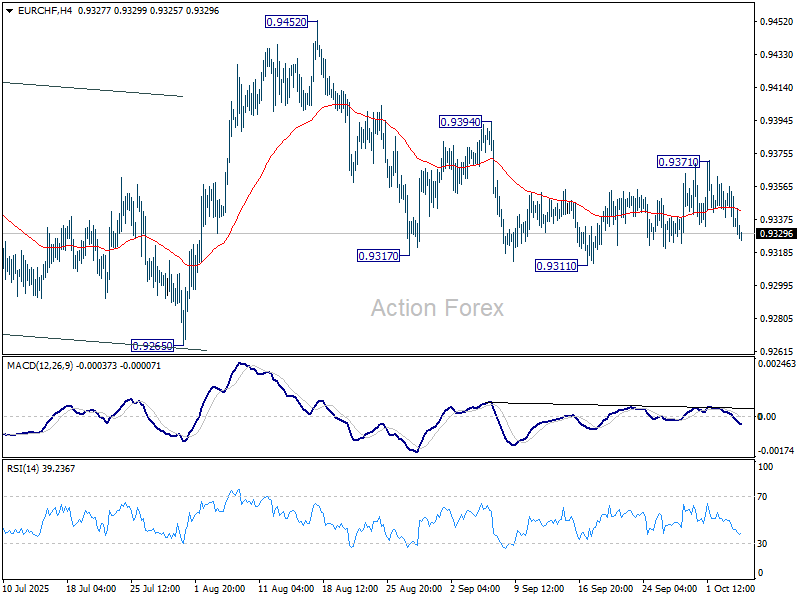
In the bigger picture, the down trend from 0.9204 (2018 high) might still be in progress considering that EUR/CHF is staying well inside the long term falling channel. However, with bullish convergence condition in W MACD, downside potential should be limited in case of another fall. Instead, firm break of 0.9660 resistance will be an important sign of medium term bullish trend reversal.
Japan Steals the Show as US Shutdown Delays Critical Data
The week kicked off on a positive note in Japan after the ruling LDP chose Sanae Takaichi as its next leader — she is now set to become the country’s next prime minister and is known for her preference for easy fiscal and monetary policies. Easier fiscal policy and more government spending are, of course, not great news for Japanese bonds, which have already seen yields rise steadily since 2020. The 20-year JGB yield, near 0% five years ago, is now approaching 2.70% — it jumped 6bp this morning, while the 30-year yield surged 12bp, hitting multi-decade highs last seen in August.
On the currency front, the Japanese yen slipped on expectations of a softer Bank of Japan (BoJ) path — and possibly fewer rate hikes. The USDJPY soared past the 150 mark. In equities, the Nikkei jumped more than 4% to a fresh all-time high on optimism that looser fiscal and monetary policies, along with a weaker yen, will continue to support Japanese equities. Defence stocks, in particular, rallied strongly on speculation that the new government could increase military spending beyond previous expectations. Japan Steel Works, for instance, jumped nearly 14%.
It was, in short, a great start to the week for Japanese equities — and much less so for Japanese bonds. Note, however, that rising JGB yields can threaten global risk appetite by narrowing the risk premium between JGBs and other assets. Still, strong dovish Federal Reserve (Fed) expectations and ongoing AI enthusiasm should help maintain appetite for US equities, while European markets may continue to benefit from the positive echoes of the global AI rally and softer BoJ bets joining the dovish Fed narrative.
S&P 500 and Nasdaq futures are in the green as I write, with the Nasdaq supported by Hon Hai (Foxconn) — one of Nvidia’s key server production partners — which reported an 11% rise in quarterly sales.
Over the weekend, OPEC announced it will raise oil output by 137,000 barrels per day in November, following a similar increase in October. Since the move had already been priced in after a 7% selloff in US crude last week, oil prices rebounded nearly 2% in Asia, flirting with the $62 per barrel level. The bounce followed a break below the summer’s sideways trading range around $62, on expectations of this very production hike. The broader outlook, however, remains tilted to the downside, with a greater likelihood of prices slipping below $60 than climbing back above $65 per barrel.
Now, let’s turn to what hasn’t been announced. The US official jobs data was not released last Friday as the government remains shut, and the data scheduled for this week will also be delayed if the shutdown continues — a scenario currently given a 60%–80% chance. The US dollar is better bid this morning, mostly due to the sharp selloff in the yen, but fundamentally, none of the traditional currencies looks particularly appetizing.
The dollar faces headwinds from trade tensions, political uncertainty and debt concerns. Sterling remains hard to love amid fiscal and political risks ahead of the Autumn Budget. The yen, once a safe haven, is grappling with its own debt and political challenges, and the euro, while relatively stronger, remains clouded by French political turmoil, as the new government faces early no-confidence risks. Among traditional currencies, the Swiss franc remains the standout safe haven — though the Swiss National Bank (SNB) is showing its teeth to the bulls, warning it could sell francs to counter excessive appreciation.
As a result, assets without government ties — like gold and Bitcoin — are seeing renewed inflows. Gold rallied to a fresh record high this morning, trading around $3’945 per ounce, and is likely to test the $4’000 level soon. Some strategists, including those at Goldman Sachs, see it heading toward $5’000 per ounce. Silver rose to $48.50, with bulls eyeing a break above the $50 psychological mark, and Bitcoin briefly traded above $125’000 over the weekend. These assets are likely to continue trending higher, not least thanks to a broadly softer US dollar.
Zooming out from currencies, this week’s macro calendar is relatively light. China remains closed for the Golden Week holiday until Thursday. ECB President Lagarde and BoE Governor Bailey speak today. The Reserve Bank of New Zealand (RBNZ) is expected to announce a 25bp rate cut at its meeting on Wednesday, and the FOMC will release the minutes of its latest meeting a few hours later.
And yes — there’s still a slim chance that the US jobs report could be released on Friday, but I wouldn’t bet my shirt on it.
In the absence of key data, US investors will focus on Wednesday’s FOMC minutes for any hint of further dovishness, and on the start of the earnings season, which kicks off this week. Expectations are upbeat but still largely beatable. The S&P 500 is expected to deliver 6.3% revenue growth and nearly 8% profit growth in Q3, with technology earnings seen surging 21%, utilities and financials rising 17.5% and 11% respectively, while energy and consumer staples are expected to post around a 3% decline due to trade frictions and weaker energy prices.
The first earnings will land on Thursday, with Delta, Levi’s, and Pepsi, followed by BlackRock on Friday.
Yen Slumps on Takaichi’s LDP Victory
In focus today
In the euro area, focus tuns to the August retail sales data and the October Sentix confidence indicator. The consumers have been cautious recently and retail sales will show if that persisted in August. It is expected that spending rose 1.3% y/y (0.1% m/m). The Sentix investor confidence indicator is expected to show an improvement to -7.7 from -9.2.
This week features a light calendar with no tier-1 global macro data scheduled. However, the delayed US labour market report could be released if the government shutdown ends. Key events include the University of Michigan consumer confidence survey and FOMC minutes in the US, and wage figures from Japan.
Economic and market news
What happened since Friday
In Japan, Saturday, the governing Liberal Democratic Party (LDP) chose a new president who is also likely to become the new PM. In her third attempt on the presidency, Abenomics loyalist Sanae Takaichi was elected as party leader against polls, which had continuity candidate Shinjiru Koizumi as favourite. Takaichi stands for a bigger fiscal package than other candidates and will not rule out lowering the VAT-rate, a move popular among opposition parties. She will now try to form a coalition in the lower house to become the first female PM In Japan. As a nationalist and advocate for amending Japan's pacifist constitution, continuing the current alliance with the small Buddhist party, Komeito, might not be straight forward, and thus political uncertainty lingers. A snap election also cannot be completely ruled out, even if that exact move backfired for the LDP last year. Takaichi has previously been critical of BoJ hikes, which is also reflected in BoJ pricing and yen weakness this morning. Investors now only see about 25% chance of an October hike and USD/JPY is back at 150, up from 147.5. With high inflation and a weak yen as bigger political issues these days, we do not think she will stand in the way of higher interest rates, but normalising BoJ policies might take even longer with Takaichi as PM.
In the US, the ISM report on the non-manufacturing sector for September revealed a PMI of 50.0 (cons: 51.7, prior: 52.09 The data highlights weakening momentum in services, with declines in business activity and new orders. Meanwhile, the prices index remains sharply elevated at 69.4 (prior: 69.2). The employment index showed a slight recovery to 47.2 (prior: 46.5), although it's worth noting this metric has historically shown limited correlation with monthly NFP data.
In Norway, the SA unemployment rate remained steady at 2.1% in September, as expected. While the number of unemployed persons dropped by 3-400 m/m, total unemployment (all types) rose by 100 persons, presenting mixed signals. New vacancies increased to 40 200, with the 3-month moving average at 42 400, indicating a renewed pick up in labour demand. The Norwegian housing market continues to look robust with house prices rising 0.4% m/m, taking the annual growth to 5.5%. Although price growth came in slightly below Norges Bank's forecast of 0.6%, the impact is insufficient to influence monetary policy.
In Sweden, the services PMI surged in September, rising from 53.8 to 57.7, pushing the composite PMI up from 54.2 to 57.1. A strong services PMI, with a notable recovery in the employment index, signals potential upside risks to employment. The indicator is not the most reliable, but it still offers an encouraging sign. The composite PMI also indicates some upside risks to our GDP-forecast and suggests that the recovery will pick up speed before year-end. Price pressures remain contained.
In commodities space, OPEC+ agreed to increase oil output by 137,000 barrels per day in November - a modest hike despite speculation of faster increases. While the market might be relieved, we think the big picture in the oil market is more important. OPEC+ continues to increase supply amid low prices, greatly limiting upside potential for oil prices.
In the Israel-Palestine conflict, Hamas has accepted key elements of Trump's 20-point Gaza peace plan, including a ceasefire and Israel's initial withdrawal. However, critical issues, such as Hamas's willingness to disarm, remain unresolved. High-stakes talks between delegates from Hamas, Israel, the US, and Qatar are set to take place in Egypt today to finalise the plan's implementation.
Equities: Equities ended last week higher again, marking yet another strong stretch of performance and fresh record highs across major indices. The key challenge for equities right now is simply the pace of the rally, markets are increasingly running ahead of fundamentals.
Healthcare was the standout sector last week, with the pharma industry surging more than 10% in both Europe and the US. It's a textbook example of what can happen when a deeply oversold and under owned sector finally gets a hint of positive news flow. This sharp turnaround also vindicates our earlier decision to move from neutral to overweight in healthcare. In contrast, energy lagged significantly as oil prices extended their decline, leading to substantial sector dispersion. Despite five consecutive up-days for global equities, defensives outperformed, largely due to healthcare's strength. Interestingly, volatility crept slightly higher through the week, with the VIX rising modestly each day despite the equity gains. The US government shutdown narrative and lack of key data likely contributed to the mild uptick in implied volatility.
This morning, Japanese equities are up more than 4% as markets react to news of a new prime minister, reviving memories of Abenomics-style policy shifts. Futures are also pointing higher in both Europe and the US.
FI and FX: Despite a relatively calm end to last week in the fixed income and FX markets and despite the fact that Israel and Hamas are set to begin negotiations today, gold prices continue to climb, reaching new highs.
In Japan, the election of Sanae Takaichi triggered an equity rally, while the JPY weakened further. Meanwhile, in the US, attention remains on the duration of the government shutdown and its economic implications, particularly given the postponement of key data releases. The Fed's response to these developments remains a critical focus for markets.
USD/CAD Daily Outlook
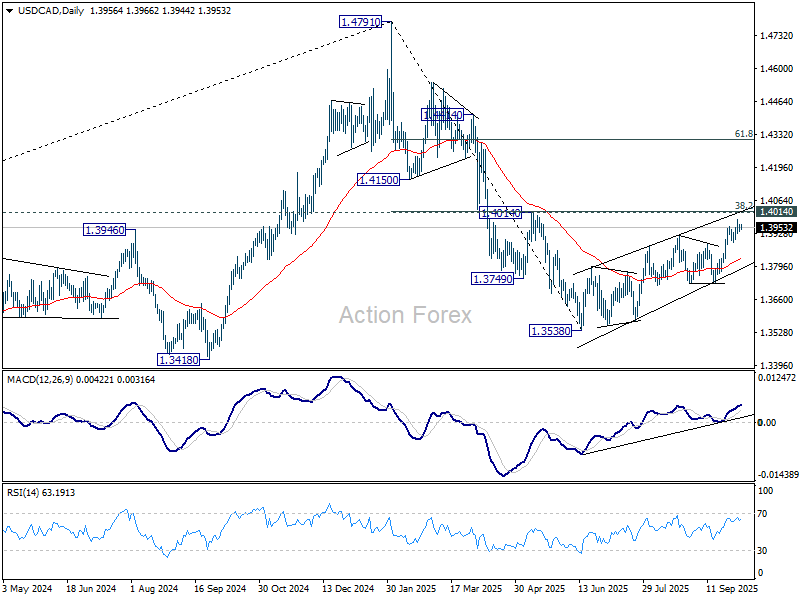
Daily Pivots: (S1) 1.3935; (P) 1.3954; (R1) 1.3968; More...
Further rise could be seen in USD/CAD with 1.3895 support intact. But strong resistance is expected from 1.4014 cluster to complete the corrective rally from 1.3538. On the downside, below 1.3895 support will turn bias back to the downside for 1.3725. However, sustained break of 1.4014 will carry larger bullish implications.
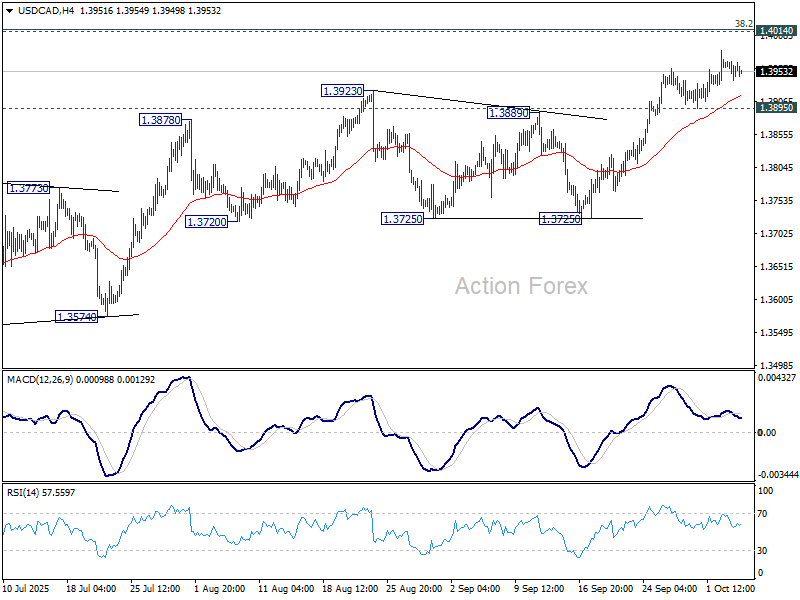
In the bigger picture, price actions from 1.4791 medium term top could either be a correction to rise from 1.2005 (2021 low), or trend reversal. In either case, further decline is expected as long as 1.4014 cluster resistance (38.2% retracement of 1.4791 to 1.3538 at 1.4017) holds. Next target is 61.8% retracement of 1.2005 (2021 low) to 1.4791 (2025 high) at 1.3069. However, sustained break of 1.4014 will argue that fall from 1.4791 has completed, and bring stronger rally to 61.8% retracement at 1.4312.