
Sample Category Title
USD/CHF Daily Outlook
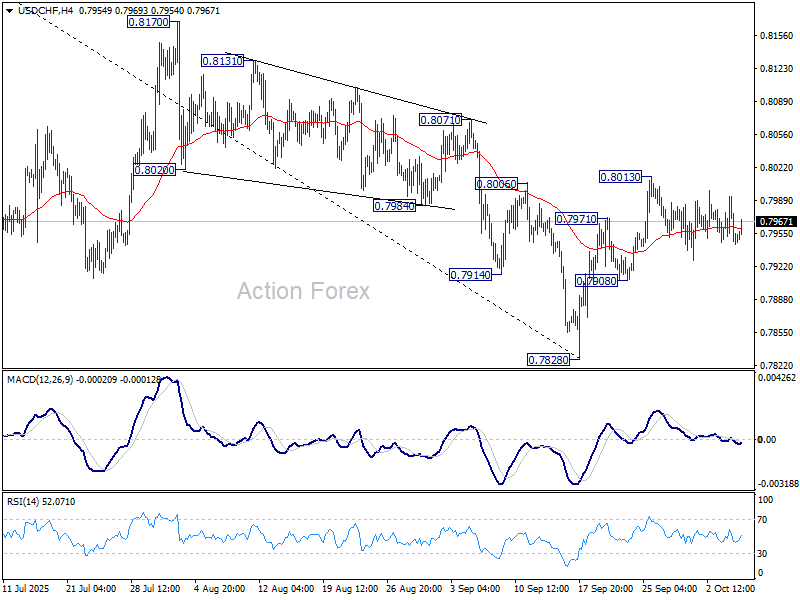
Daily Pivots: (S1) 0.7932; (P) 0.7963; (R1) 0.7979; More…
Range trading continues in USD/CHF and intraday bias stays neutral. On the upside, sustained trading above 55 D EMA (now at 0.8004) will suggest that rise from 0.7828 is already correcting whole fall from 0.9200. Further rise should the be seen to 0.8170 resistance and possibly above. However, break of 0.7908 will turn bias back to the downside for retesting 0.7828 low.
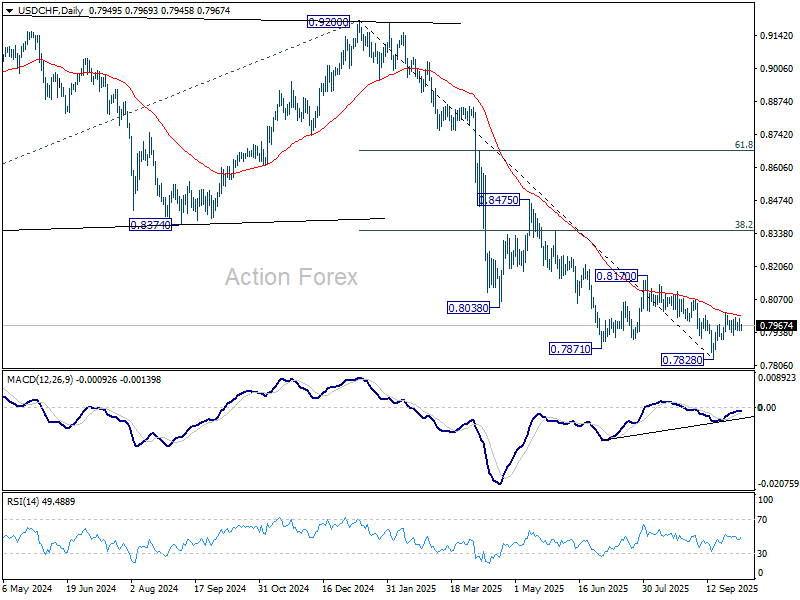
In the bigger picture, long term down trend from 1.0342 (2017 high) is still in progress. Next target is 100% projection of 1.0146 (2022 high) to 0.8332 from 0.9200 at 0.7382. In any case, outlook will stay bearish as long as 0.8332 support turned resistance holds (2023 low).
Yen Remains in the Defensive
Markets
French PM Lecornu’s resignation was the latest domino in the country’s domestic political crisis triggered by President Macron’s snap elections last summer. On the president’s request, Lecornu will remain in a caretaker role with a Wednesday evening deadline to hold final talks with political blocks to explore the ability to nevertheless form a government. In case of a positive outcome to talks, Macron will name a new prime minister – which would be the sixth since 2022 – to try align the country’s hung parliament to pass a budget as soon as possible. The official October 13 deadline is impossible to make, so in first instance we’ll be looking at emergency legislation to extend this year’s budget. If deliberations between now and Wednesday lead to nothing, Macron will have little choice but to dissolve parliament and call another snap election. Those two-round votes would need to take place 20-to-40 days later implying a huge tail risk of (EMU) uncertainty in the run-up to and around early November. New presidential elections (normally 2027) are Macron’s final options, but seem unlikely. He’s constitutionally barred from running again and current opinion polling gives a good chance that extreme right leader Bardella (RN) comes out on top; a risk the centrist President is probably unwilling to run. The French 10y swap spread temporarily rose to a new YTD high at 89 bps before closing at 86 bps. European stock markets underperformed the US. Losses ranged between 0.4% for the EuroStoxx50 to 1.36% for the French CAC40. The single currency underperformed with EUR/USD sliding from 1.17+ levels to an intraday bottom at 1.1650 before rebounding into the close. EUR/GBP ended at 0.8685 from a start at 0.8725. We expect this “precaution” to persist into Wednesday evening. Yesterday’s overall modest reaction implies that markets currently go with the muddling through scenario of appointing yet another new PM. We think they severely underestimate the risk of new parliamentary elections which could have a more profound (negative) impact on the likes of the euro and French assets.
Today’s empty eco calendar won’t inspire, leaving ample room for political themes to play out. The Japanese yen remains in the defensive (USD/JPY 150.50 & EUR/JPY 176) as money markets reduce the likelihood of a BoJ rate hike at the end of this month following after Abenomics-cheerleader Sanae Takaichi won LDP leadership elections this weekend, becoming new PM. Yesterday’s 15 bps increase at the very long end of the curve, did lure better than average buying interest in this morning’s 30-yr JGB auction. The US Treasury starts its mid-month refinancing operation with a $58bn 3-yr Note auction today, but (market) focus) will be on 10-yr and 30-yr sales tomorrow and on Thursday.
News & Views
In a podcast released yesterday, Hungarian Prime Minister Victor Orban said he would prefer lower interest rates as he tried to revive economic growth in the country. The Hungarian prime minister is heading for elections next year and his party falls behind the opposition in the polls. Orban admitted that it is the task of MNB governor Varga and his monetary policy committee to set the policy rate. At the same time, he described the approach of Varga as cautious and he also acknowledged that such a cautious approach is needed to protect the forint’s stability. At the same time, he assessed that at 6.5% the policy rate is already higher than it should be. In its (fiscal) policy, the Hungarian government already to some extent ‘sidesteps’ monetary policy as it provides subsidies for mortgages and other loans. This weekend the government also announced to offer additional loans for small and medium sized companies (fixed rate 3%) up to a cap of HUF 150mn. The forint yesterday declined marginally (EUR/HUF 388.6), but is holding near the strongest levels since June last year.
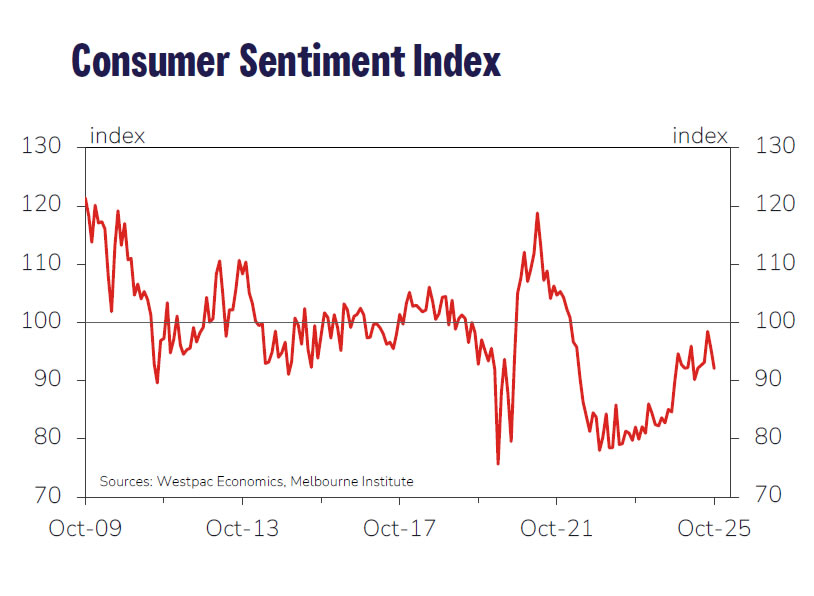
Australian consumer confidence declined for the second consecutive month. The Westpac index declined 3.1%, having already dropped 3.5% in September. At 92.1%, the index suggests that more people are turning pessimistic than optimistic (100% is balance reference). Both the current conditions index (-2.8%) and the expectations component (-4%) declined. Families in particular turned more negative on personal finances, both over the previous year (-4.8%) and even more for the next year (-9.9%). The decline comes as the Reserve Bank of Australia last week left its policy rate unchanged at 3.60% because of signs that the disinflation process might be slowing and as labour market conditions remain rather tight. The Aussie dollar this morning eased marginally (AUD/USD 0.6605) but holds a tight short-term range between 0.65 and 0.67.
USD/JPY Daily Outlook
Daily Pivots: (S1) 149.45; (P) 149.97; (R1) 150.88; More...
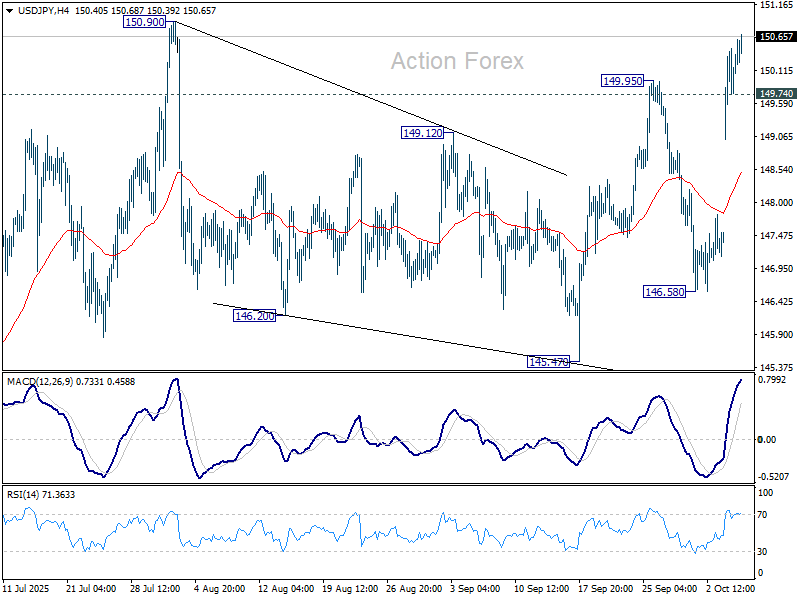
Intraday bias in USD/JPY remains on the upside at this point. Break of 150.90 will resume larger rally from 139.87 to 151.22 fibonacci level. Sustained break there will carry larger bullish implication. On the downside, below 149.74 minor support will turn intraday bias neutral again first.
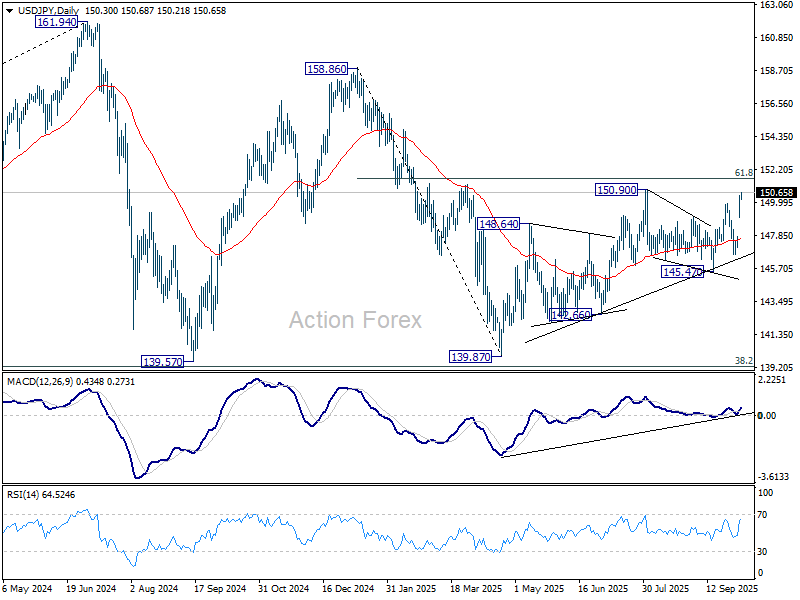
In the bigger picture, price actions from 161.94 (2024 high) are seen as a corrective pattern to rise from 102.58 (2021 low). Decisive break of 61.8% retracement of 158.86 to 139.87 at 151.22 will argue that it has already completed with three waves at 139.87. Larger up trend might then be ready to resume through 161.94 high. In case the corrective pattern extends with another fall, strong support is expected from 38.2% retracement of 102.58 to 161.94 at 139.26 to bring rebound.
Yen Momentum Slows After Slide, But Japan Bond Market Faces Takaichi Test
Volatility across major currency pairs eased in Asian session today, with markets showing a brief pause after several sessions of outsized moves. Yen initially extended losses as the Nikkei 225 surged to another record high for a second straight day, but later steadied as profit-taking emerged following the sharp depreciation seen earlier in the week.
While the short-term selling momentum in the Yen appears to have cooled, there is no sign of a firm bottom yet. Renewed weakness could resume at any time, especially if risk appetite stays elevated. The broader tone remains fragile, with positioning still heavily tilted against the currency.
In fixed income markets, the 10-year Japanese government bond yield jumped to its highest level since July 2008, edging close to the 1.7% mark. The move signals renewed stress in Japan’s long-dormant bond market, long insulated by the BoJ’s yield curve control framework and decades of deflationary pressure.
Markets are now adjusting to the prospect of a new political era under Sanae Takaichi, who is expected to become Japan’s first female prime minister after winning the ruling Liberal Democratic Party’s leadership race on Saturday. Takaichi is expected to be confirmed by parliament on October 15.
Meanwhile, expectations for an October BoJ rate hike have faded. Market-implied odds have fallen sharply after the leadership change, with Deutsche Bank reportedly exiting its long-Yen positions, citing uncertainty around Takaichi’s policy priorities and the timing of the BoJ’s hiking cycle. The shift reinforces speculation that the central bank will remain cautious and maintain its current settings through year-end.
Meanwhile, Euro also remained soft, weighed by renewed political instability in France. President Emmanuel Macron was hit by another crisis following the shock resignation of Prime Minister Sebastien Lecornu after just 27 days in office — the shortest-lived government in modern French history. Macron now faces mounting calls to resign, appointing a new government, or dissolving parliament for early elections, as opposition pressure intensifies.
Across the week so far, Aussie leads gains, followed by Dollar and Loonie. Yen remains the weakest performer, trailed by Euro. Sterling, Swiss Franc, and Kiwi trade mixed in the middle.
In Asia, at the time of writing, Nikkei is up 0.10%. Hong Kong and China are on holidays. Singapore Strait Times is up 0.95%. Japan 10-year JGB yield is down -0.006 at 1.674. Overnight, DOW fell -0.14%. S&P 500 rose 0.36% NASDAQ rose 0.71%. 10-year yield rose 0.043 to 4.162.
ECB's Lagarde: Disinflation over, range of risks narrow
ECB President Christine Lagarde told a European Parliament’s committee that the Eurozone’s "disinflationary process is over", with inflation now hovering around 2% and expected to remain near target over the medium term. She said this backdrop justified the Governing Council’s recent decision to keep interest rates unchanged.
Lagarde noted that risks to economic growth have become "more balanced", as the likelihood of severe tariff-related downside shocks has eased following the trade deal. Still, she warned that renewed trade tensions could weigh on exports, investment, and consumption, while persistent geopolitical uncertainty continues to cloud the outlook for both growth and prices. On the positive side, Lagarde highlighted that higher defence and infrastructure spending and productivity-boosting reforms could support growth momentum ahead.
She also emphasized that the inflation outlook remains "more uncertain than usual", reflecting the “still volatile global trade policy environment” that poses both upside and downside risks. However, she added that the "range of risks on both sides has narrowed" as new data arrives.
Her comments are interpreted as confirmation that the ECB remains firmly on hold, awaiting clearer signals before considering any recalibration of its policy stance.
Fed’s Schmid warns inflation broadening, despite muted tariff effects
At an event overnight, Kansas City Fed President Jeff Schmid warned that price increases have become "more widespread", with 80% of inflation categories rising, compared with 70% earlier this year. He called the trend “worrying,” indicating that underlying inflation pressures remain entrenched.
Schmid said he sees a "relatively muted effect" from tariffs on inflation, but viewed that as a signal that monetary policy is well positioned, not as evidence to justify “aggressively lowering” rates.
He added that the Fed faces difficult trade-offs between its dual mandates but insisted it "must maintain its credibility on inflation".
Australia Westpac consumer sentiment slumps to firmly pessimistic level, RBA November cut not assured
Australian consumer sentiment dropped -3.5% mom to 92.1 in October, according to the Westpac-Melbourne Institute survey, erasing all gains seen between May and August when rate cuts briefly lifted confidence. The index has returned to “firmly pessimistic” territory, signaling renewed caution among households.
Westpac said consumers were unsettled by recent inflation updates, with partial indicators suggesting annual price growth has edged back toward the top of the RBA’s 2–3% target range. Signs of stronger consumer demand and a reviving housing market have also stoked speculation that the RBA may not ease policy as quickly as previously expected.
With the RBA meeting scheduled for November 3–4, Westpac noted that a rate cut is “far from assured, though not off the table.” The bank added that the longer the RBA holds off on further easing, the greater the likelihood of deeper cuts later.
NZIER sees two more RBNZ cuts despite signs of inflation pick-up
The New Zealand Institute of Economic Research maintained its forecast for two additional 25bps cuts by the RBNZ at the October and November meetings, despite a mild uptick in inflation pressures during Q3.
In its latest Quarterly Survey of Business Opinion (QSBO), NZIER said a net 11% of firms raised prices, compared with 1% reporting price cuts in the previous quarter, suggesting that cost pressures are firming again. NZIER expects annual CPI inflation to rise slightly above 3% in the near term but sees it drifting back toward the 2% midpoint of the RBNZ’s target range as excess capacity continues to weigh on domestic demand.
Business sentiment, however, softened, with 15% of firms expecting economic improvement, down from 26% in Q2, while 14% reported weaker trading activity in their own businesses. The survey also pointed to declining hiring and investment intentions, as 23% of firms cut staff and a majority plan to reduce capital spending over the coming year.
The mixed picture—firmer inflation but softer demand—supports NZIER’s view that the RBNZ will deliver further easing to stabilize growth, even as it remains alert to temporary inflation volatility.
USD/JPY Daily Outlook
Daily Pivots: (S1) 149.45; (P) 149.97; (R1) 150.88; More...
Intraday bias in USD/JPY remains on the upside at this point. Break of 150.90 will resume larger rally from 139.87 to 151.22 fibonacci level. Sustained break there will carry larger bullish implication. On the downside, below 149.74 minor support will turn intraday bias neutral again first.
In the bigger picture, price actions from 161.94 (2024 high) are seen as a corrective pattern to rise from 102.58 (2021 low). Decisive break of 61.8% retracement of 158.86 to 139.87 at 151.22 will argue that it has already completed with three waves at 139.87. Larger up trend might then be ready to resume through 161.94 high. In case the corrective pattern extends with another fall, strong support is expected from 38.2% retracement of 102.58 to 161.94 at 139.26 to bring rebound.
AI Booms, Politics Burst
Forget about the US government shutdown, the French political chaos, or the new Japanese PM whom many are comparing to Margaret Thatcher and Shinzo Abe. One big piece of news from OpenAI yesterday overtook all headlines and dominated market action: the company signed a blockbuster deal with AMD — yes, Nvidia’s rival in the AI chip business — to deploy 6 gigawatts’ worth of AMD graphics processing units over multiple years.
That’s just over half the size of the agreement OpenAI announced with Nvidia a few days ago, and according to AMD’s CEO, Lisa Su, it could generate around $100 billion in revenue over the next four years. So yes — bingo — AMD shares spiked more than 30% at the open and closed up by 23% on the news, while Nvidia lost just 1.1%, far less than it might have if the announcements had come in reverse order. Nvidia recently pledged to invest up to $100 billion in OpenAI — money that would partly be used to buy Nvidia chips. Now, OpenAI announces a blockbuster deal with AMD and takes an option for roughly a 10% stake in AMD through warrants tied to the deployment plan. For those worried about the circular nature of this business growth, things are indeed getting more circular by the day. But this also suggests that Nvidia wouldn’t pour $100 billion into a company planning to replace its chips with a rival’s — meaning OpenAI is far more concerned about meeting exploding AI demand than about supplier loyalty. Note that OpenAI also struck deals with South Korean chipmakers last week, sending their shares soaring.
Clearly, OpenAI believes the AI pie will be big enough to feed everyone. For AI and tech investors, that’s optimism-boosting news — a signal countering fears that AI revenues might fall short of the massive investments currently being made. As a result, the S&P 500 consolidated near an all-time high yesterday, while the tech-heavy Nasdaq pushed to a fresh record.
Elsewhere, the news was far less cheerful. The US government remains shut, but the dollar index is still well bid — not because the outlook is great, but because the other majors look even worse.
In France, political chaos is worsening by the hour. The new Prime Minister, Sébastien Lecornu, resigned after just 14 hours in office, as the cabinet announced by Macron was largely unchanged from the one that just fell — immediately triggering talk of a no-confidence vote. Lecornu has since accepted Macron’s call to hold on for another 48 hours, but there’s little light at the end of the French political tunnel. France, as it stands, is barely governable. The yield spread between French and German 10-year bonds spiked past 85 basis points and could well widen toward 100 bp, limiting any upside potential for the euro. The EURUSD is trading below 1.17 this morning and will likely remain under pressure from French political shenanigans for a while.
In Japan, the yen remains weak under the new LDP appointee, Sanae Takaichi, who favours loose monetary and fiscal policies and is being compared to both Thatcher and Abe. The Nikkei is consolidating after a 5% rally, while JGB yields hover at multi-decade highs. Investors are wondering whether Japan’s new PM, Takaichi, can recreate the optimism of Abe’s Abenomics era with her pro-growth agenda. But unlike Abe, she faces rising inflation, record-high debt near 216% of GDP, and a central bank that’s tightening, not easing. That leaves far less room for bold fiscal or monetary moves. So while Japanese equities may climb further if global sentiment stays buoyant, a true Abenomics-style rally looks unlikely — and rising yields could even trigger repatriation flows that ripple through global markets.
In the UK, meanwhile, the upcoming budget has investors so uneasy that sterling doesn’t even look like a safe bet.
Capital continues to flow into traditional safe havens — gold, silver, and even Bitcoin. A further weakness in the US dollar — which remains the base case scenario as long as the government stays shut — should directly support these assets.
Fed Call Revised Amid Government Shutdown
In focus today
Today is expected to be quiet, with no major market movers on the agenda.
This evening, Fed's Bostic and Kashkari are set to speak, potentially offering insights into how delayed data from the US government shutdown will influence monetary policy.
Overnight in Japan, August wage data will be released - the last release ahead of the Bank of Japan's October policy meeting. Stronger wage growth is a prerequisite for further rate hikes from the BoJ. While June and July saw solid gains on the back of strong summer bonuses, a revision to July's data means annual real wage growth remains subzero. August data should further reflect the solid wage pickup negotiated in the spring.
Early tomorrow morning, the Reserve Bank of New Zealand (RBNZ) will have a monetary policy meeting. We expect a 25bp cut to the policy rate to 2.75%, but it will be a close call between 25bp and a larger 50bp move. Markets are slightly favouring a smaller cut, with 36bp priced in. Analyst consensus is divided but also leans towards a 25bp move.
Economic and market news
What happened overnight
This morning, we made a small adjustment to our Fed call. Previously, we expected the Fed to deliver its next rate cut only in December, but we think that the shutdown-driven delay in data releases will tilt the FOMC to cut rates already later this month. We still think the Fed to cut rates only gradually later on, and expect 25bp cuts in October, January, April and June (prev. December, March, June and September). We maintain our terminal rate view at 3.00-3.25%.
What happened yesterday
In the euro area, August retail sales increased modestly by 0.1% m/m (prior: -0.4%) aligning with expectations. Investor confidence also improved, as the October Sentix index climbed more than expected to -5.4 (prior -9.2). Both current conditions and expectations strengthened, reflecting improved global sentiment despite the ongoing US government shutdown. Germany also saw gains, though its current situation remains firmly in recession territory.
In France, newly appointed French PM Lecornu resigned. As a result, French government bonds came under heavy pressure and the yield spread between 10Y French and German government bonds widened to 89bp at its peak before retracing to around 85bp for the remainder of the session. Lecornu's resignation followed a backlash from appointing a broadly unchanged cabinet reshuffle from Bayrou's period as prime minister. Late Monday evening, President Macron said he would give Lecornu until Wednesday to conduct final negotiations. If the last-minute negotiations fail, this leaves Macron with two options of either appointing a new PM and attempt to get a watered-down version of the 2026 budget passed or dissolve the Assemblée National and hold legislative elections. In our view, it is increasingly likely that an election will be called. Regardless, the political turmoil means that it is increasingly likely that the 2025 budget will be extended into 2026, and hence that fiscal consolidation measures will not come into effect. This should continue to put pressure on French government bonds.
Equities: Equity markets extended gains yesterday, printing yet another round of all-time highs. However, the regional divergence was striking, and for once, not macro-driven but politically anchored. Japan stood out on the positive side, supported by expectations of renewed fiscal stimulus under the likely incoming prime minister. In contrast, Europe lagged, led lower by France, where political paralysis deepened as Prime Minister effectively threw in the towel barely a month after taking office. French banks bore the brunt of the move, driving underperformance in the European financial sector. In the US yesterday, Dow -0.1%, S&P 500 +0.4%, Nasdaq +0.7% and Russell 2000 +0.4%. This morning, Asian markets are again trading in positive territory, led by cyclical names, while European and U.S. futures are broadly flat, thought with Europe marginally outperforming.
FI and FX: French politics is dominating European news flows and putting further pressure on OAT pricing. In the US, focus remains on the government shutdown and the resulting absence of data releases. We have adjusted our Fed call and now expect the next rate cut in the upcoming October meeting, rather than in December. In Sweden we get the budget outcome for September, where we expect a larger deficit than initially forecasted by the debt office, likely adding to expectations for a further increase of government borrowing once the new borrowing plan is published late November. Finally, the EUR denominated IPO on the Swedish stock-exchange might put pressure on EURSEK.
Bitcoin Rockets To New ATH – Can Bulls Keep The Fire Burning?
Key Highlights
- Bitcoin rallied once again and traded to a new all-time high above $125,000.
- BTC/USD is trading above a key bullish trend line with support at $123,600 on the 4-hour chart.
- Ethereum also started a decent increase above $4,600.
- XRP price is struggling to settle and gain pace above $3.00.
Bitcoin Price Technical Analysis
Bitcoin price remained stable above $115,000 against the US Dollar. BTC started a fresh increase above $120,000 and traded to a new all-time high above $125,000.
Looking at the 4-hour chart, the price followed a bullish path and tested $126,250 before there was a minor pullback. However, the bulls remain in action above $122,000. Besides, there is a key bullish trend line with support at $123,600.
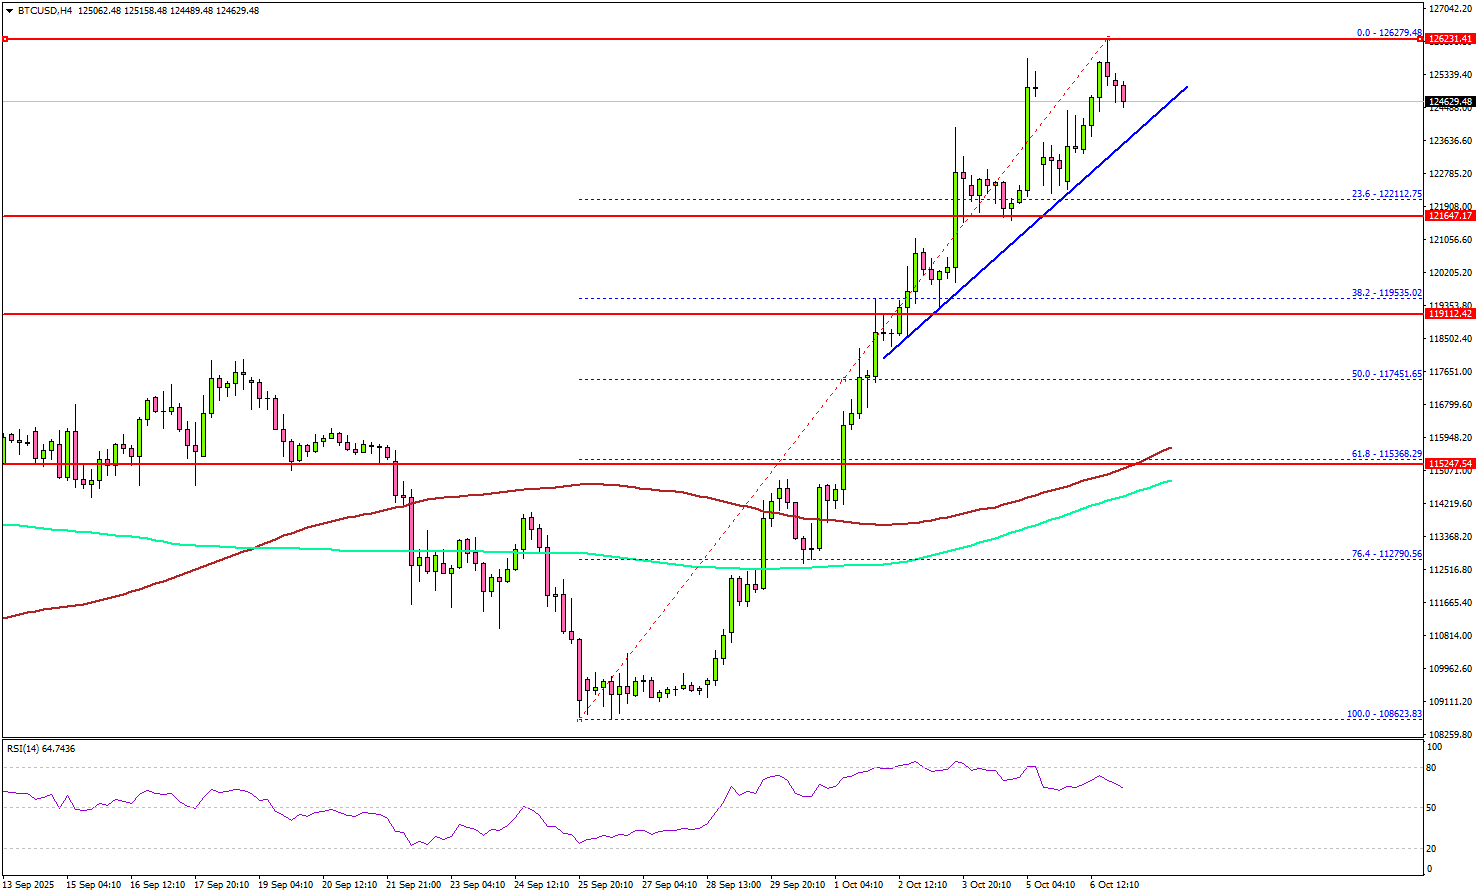
The price is now well above the 100 simple moving average (red, 4-hour) and the 200 simple moving average (green, 4-hour). Immediate support sits at $123,600 and the trend line.
A downside break below the trend line might send BTC toward the $121,750 support. Any more losses might call for an extended decline toward the $120,000 support zone. On the upside, the price now faces resistance near the $125,800 level.
The main hurdle is now forming near $126,500. A successful close above $126,500 might start another steady increase. In the stated case, the price may perhaps rise toward the $128,500 level. Any more gains might call for a test of $130,000.
Looking at Ethereum, the price was able to follow Bitcoin and climbed above the $4,600 resistance region.
Today’s Key Economic Releases
- Fed's Bowman speech.
- Fed's Miran speech.
- Fed's Kashkari speech.
Australia Westpac consumer sentiment slumps to firmly pessimistic level, RBA November cut not assured
Australian consumer sentiment dropped -3.5% mom to 92.1 in October, according to the Westpac-Melbourne Institute survey, erasing all gains seen between May and August when rate cuts briefly lifted confidence. The index has returned to “firmly pessimistic” territory, signaling renewed caution among households.
Westpac said consumers were unsettled by recent inflation updates, with partial indicators suggesting annual price growth has edged back toward the top of the RBA’s 2–3% target range. Signs of stronger consumer demand and a reviving housing market have also stoked speculation that the RBA may not ease policy as quickly as previously expected.
With the RBA meeting scheduled for November 3–4, Westpac noted that a rate cut is “far from assured, though not off the table.” The bank added that the longer the RBA holds off on further easing, the greater the likelihood of deeper cuts later.
NZIER sees two more RBNZ cuts despite signs of inflation pick-up
The New Zealand Institute of Economic Research maintained its forecast for two additional 25bps cuts by the RBNZ at the October and November meetings, despite a mild uptick in inflation pressures during Q3.
In its latest Quarterly Survey of Business Opinion (QSBO), NZIER said a net 11% of firms raised prices, compared with 1% reporting price cuts in the previous quarter, suggesting that cost pressures are firming again. NZIER expects annual CPI inflation to rise slightly above 3% in the near term but sees it drifting back toward the 2% midpoint of the RBNZ’s target range as excess capacity continues to weigh on domestic demand.
Business sentiment, however, softened, with 15% of firms expecting economic improvement, down from 26% in Q2, while 14% reported weaker trading activity in their own businesses. The survey also pointed to declining hiring and investment intentions, as 23% of firms cut staff and a majority plan to reduce capital spending over the coming year.
The mixed picture—firmer inflation but softer demand—supports NZIER’s view that the RBNZ will deliver further easing to stabilize growth, even as it remains alert to temporary inflation volatility.
Fed’s Schmid warns inflation broadening, despite muted tariff effects
At an event overnight, Kansas City Fed President Jeff Schmid warned that price increases have become "more widespread", with 80% of inflation categories rising, compared with 70% earlier this year. He called the trend “worrying,” indicating that underlying inflation pressures remain entrenched.
Schmid said he sees a "relatively muted effect" from tariffs on inflation, but viewed that as a signal that monetary policy is well positioned, not as evidence to justify “aggressively lowering” rates.
He added that the Fed faces difficult trade-offs between its dual mandates but insisted it "must maintain its credibility on inflation".