Sample Category Title
USD/JPY Analysis: Yen Weakens to Two-Month Low
As the USD/JPY chart shows, the Japanese yen has weakened sharply at the start of this week. Trading opened with a bullish gap, and today the exchange rate has risen to ¥150.65 per US dollar.
The yen’s decline followed the recent election, during which Japan’s ruling Liberal Democratic Party elected Sanae Takaichi as its new leader, paving the way for her to become the next prime minister. According to Reuters, Takaichi supports the late former Prime Minister Shinzo Abe’s “Abenomics” strategy, which focuses on stimulating the economy through aggressive spending and ultra-loose monetary policy.
Technical Analysis of the USD/JPY Chart
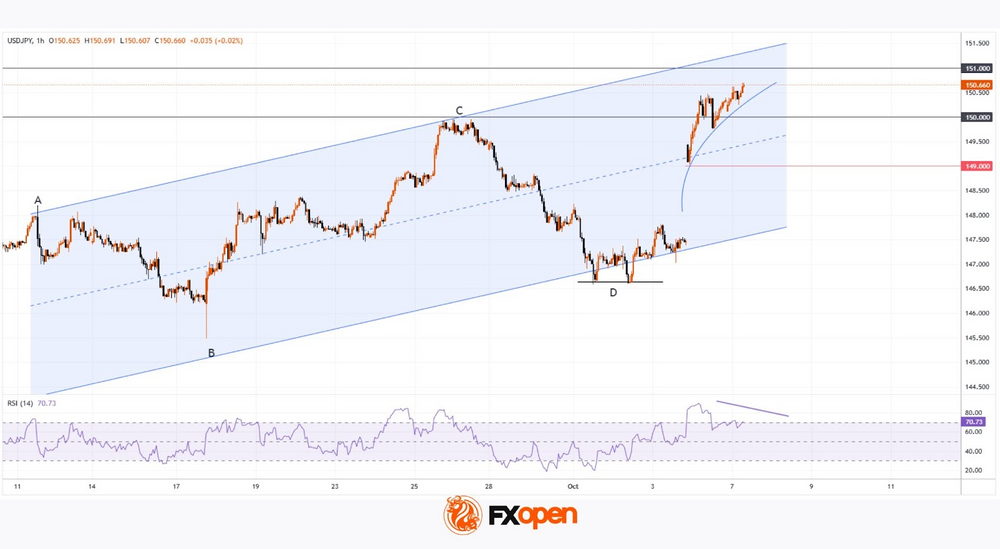
The political factor has led to a sequence of higher highs and higher lows (A→B→C→D) on the chart – and it is already evident that the next peak, E, will form above the previous one. This suggests that the USD/JPY market has entered an upward trend following a flat phase that was particularly pronounced in August.
At the same time:
→ The A low has a long lower shadow, and the D low shows signs of a double-bottom pattern, indicating strong demand.
→ The ¥149 level may serve as support going forward, marking the edge of the gap.
→ The price has broken above the key psychological level of ¥150 per dollar.
→ These reversal points justify constructing an ascending channel (shown in blue).
The chart highlights the dominance of demand, as the price remains:
→ In the upper half of the channel;
→ Above a curved support line – trajectories of this kind often appear after strong market impulses.
Given the above, it is reasonable to assume that:
→ The USD/JPY rate may continue its upward movement;
→ However, bullish momentum is weakening, as suggested by the potential bearish divergence on the RSI indicator.
It is worth noting that in February and March, the price reversed several times near ¥151 per dollar, which may act as significant resistance – adding weight to the possibility of a corrective move in USD/JPY, perhaps towards the median of the current channel.
Trade over 50 forex markets 24 hours a day with FXOpen. Take advantage of low commissions, deep liquidity, and spreads from 0.0 pips. Open your FXOpen account now or learn more about trading forex with FXOpen.
This article represents the opinion of the Companies operating under the FXOpen brand only. It is not to be construed as an offer, solicitation, or recommendation with respect to products and services provided by the Companies operating under the FXOpen brand, nor is it to be considered financial advice.
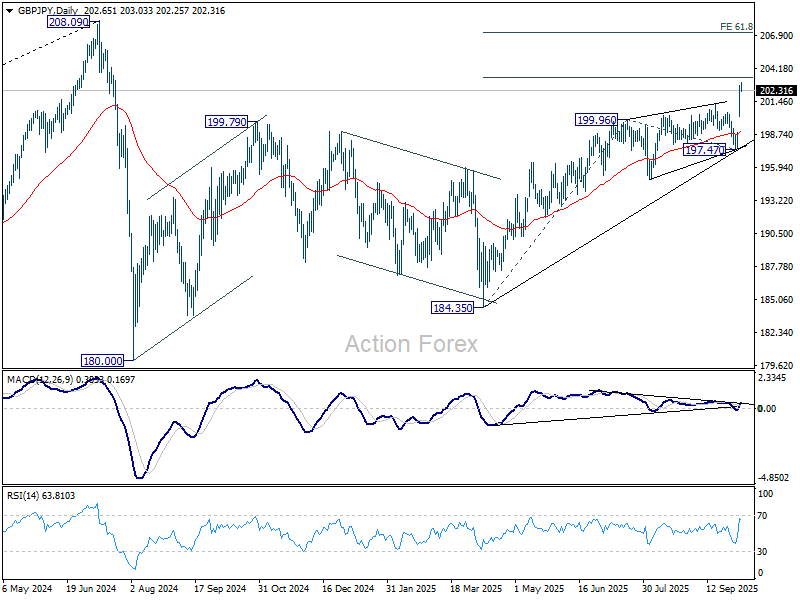
GBP/JPY Daily Outlook
Daily Pivots: (S1) 201.07; (P) 201.94; (R1) 203.66; More...
Intraday bias in GBPJPY remains on the upside for the moment. Current rise should target 38.2% projection of 184.35 to 199.96 from 197.47 at 203.43. Firm break there will target 61.8% projection at 207.11 next. On the downside, below 201.22 minor support will turn bias neutral first. But outlook will remain bullish as long as 197.47 support holds, in case of retreat.
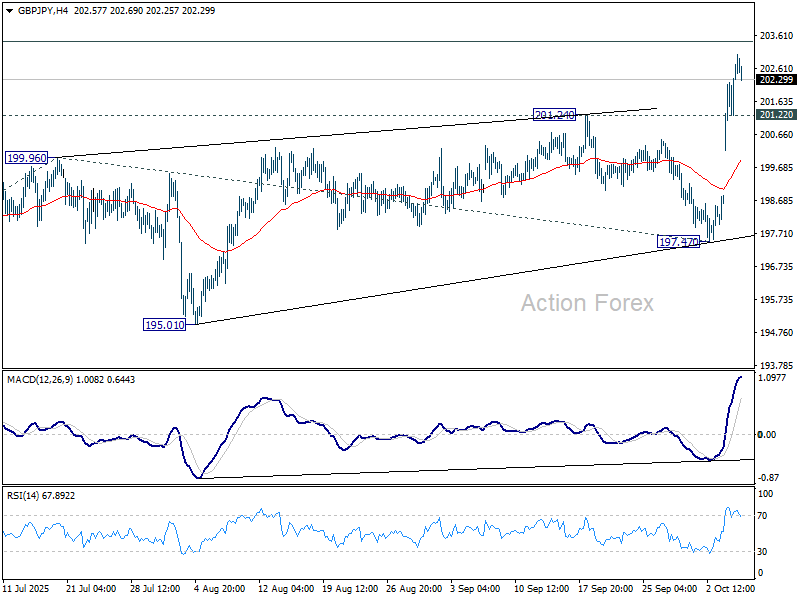
In the bigger picture, price actions from 208.09 (2024 high) are seen as a correction to rally from 123.94 (2020 low). The pattern might still extend with another falling leg. But in that case, strong support should be seen from 38.2% retracement of 123.94 to 208.09 at 175.94 to contain downside. Meanwhile, decisive break of 208.09 will confirm long term up trend resumption.
EUR/JPY Daily Outlook
Daily Pivots: (S1) 175.15; (P) 175.70; (R1) 176.67; More...
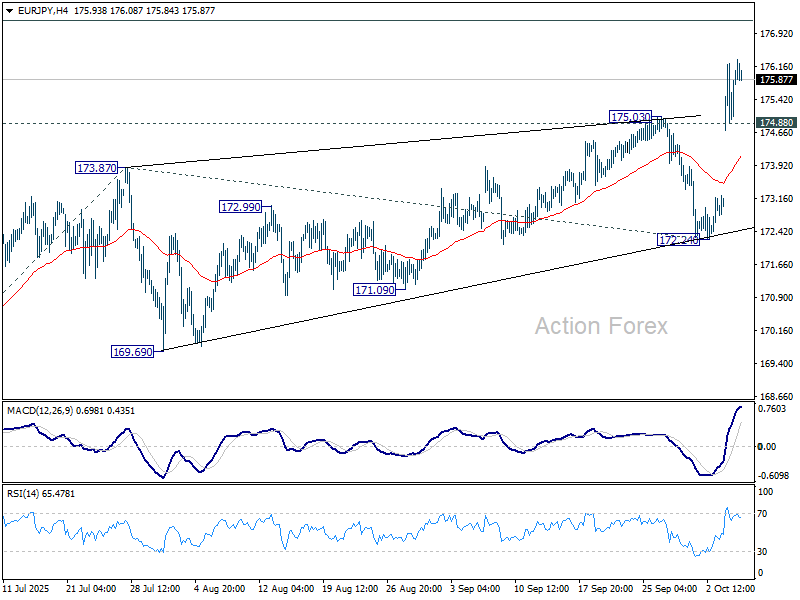
Intraday bias in EUR/JPY remains on the upside for the moment. Current rise should target 38.2% projection of 161.06 to 173.87 from 172.24 at 177.13. Firm break there will open the path to 61.8% projection at 180.15. On the downside, below 174.88 minor support will turn intraday bias neutral again first. But outlook will stay bullish as long as 172.24 support holds, in case of retreat.
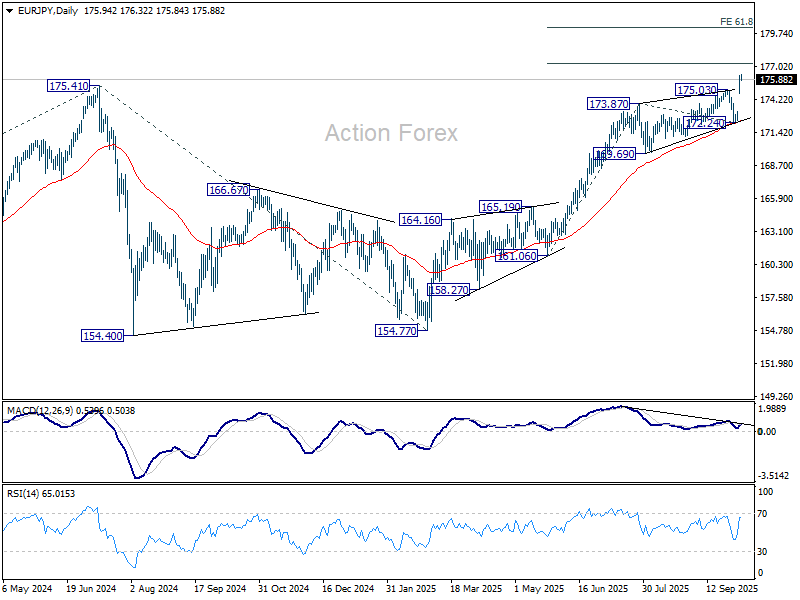
In the bigger picture, up trend from 114.42 (2020 low) is resuming with break of 175.41 (2024 high). Next target is 61.8% projection of 124.37 to 175.41 from 154.77 at 186.31. Outlook will continue to stay bullish as long as 55 W EMA (now at 166.82) holds, even in case of deep pullback.
EUR/GBP Daily Outlook
Daily Pivots: (S1) 0.8664; (P) 0.8696; (R1) 0.8718; More…
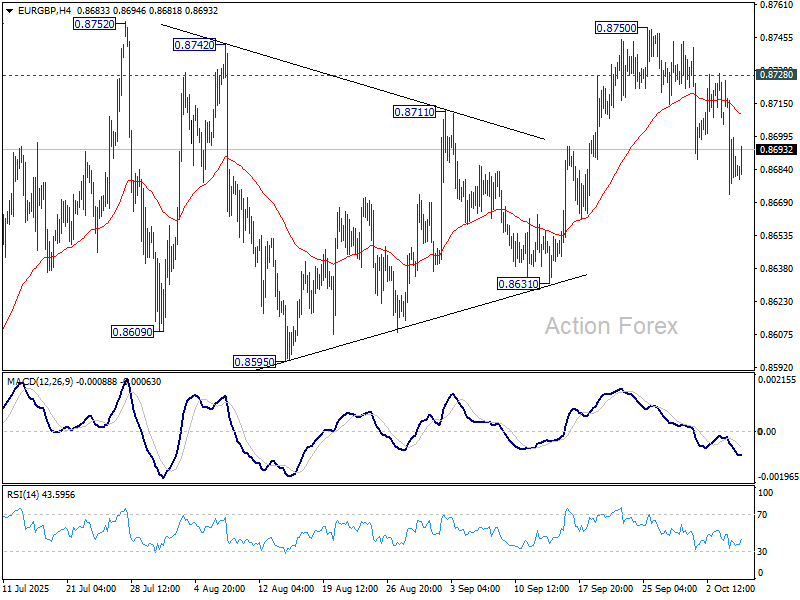
Intraday bias in EUR/GBP remains mildly on the downside for 0.8631 support. Decisive break there will indicate near term reversal and turn outlook bearish. On the upside, though, above 0.8728 will bring retest of 0.8750 first. Firm break there will resume the larger rally towards 0.8867 fibonacci level.
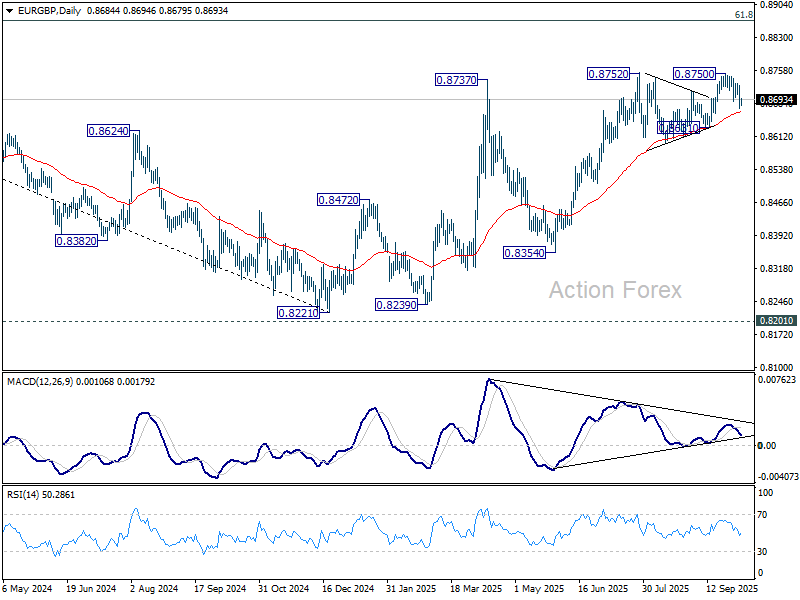
In the bigger picture, rise from 0.8221 medium term bottom is seen as a corrective move. While further rally cannot be ruled out, upside should be limited by 61.8% retracement of 0.9267 to 0.8221 at 0.8867. Considering bearish divergence condition in D MACD, firm break of 0.8631 support will be the first sign that this corrective bounce has completed. Sustained trading below 55 W EMA (now at 0.8539) will confirm, and bring retest of 0.8221 low.
EUR/AUD Daily Outlook
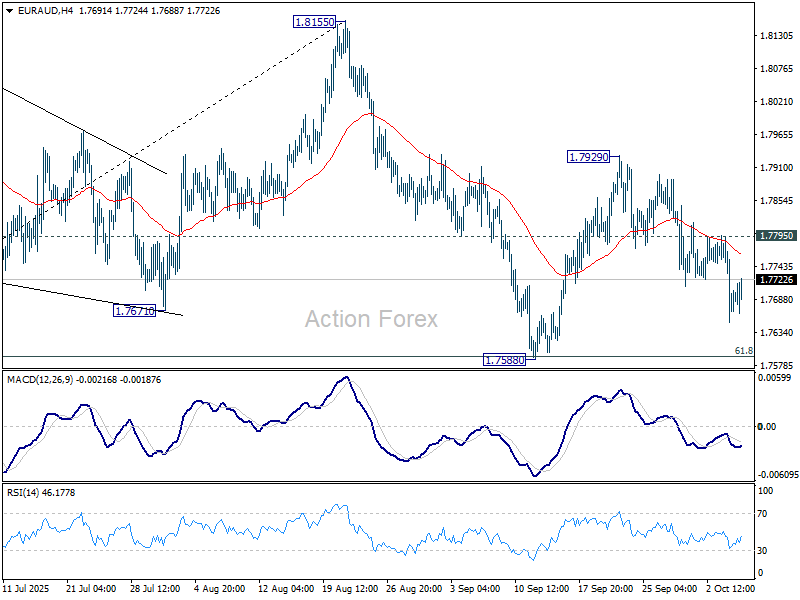
Daily Pivots: (S1) 1.7628; (P) 1.7721; (R1) 1.7789; More...
Intraday bias in EUR/AUD remains neutral first. On the upside, break of 1.7795 resistance will suggest that pullback from 1.7929 has completed. Bias will be back on the upside for this resistance first. On the downside, however, sustained break of 61.8% retracement of 1.7245 to 1.8155 at 1.7593 will bring deeper fall to 1.7245 resistance, as part of the corrective pattern from 1.8554 high.
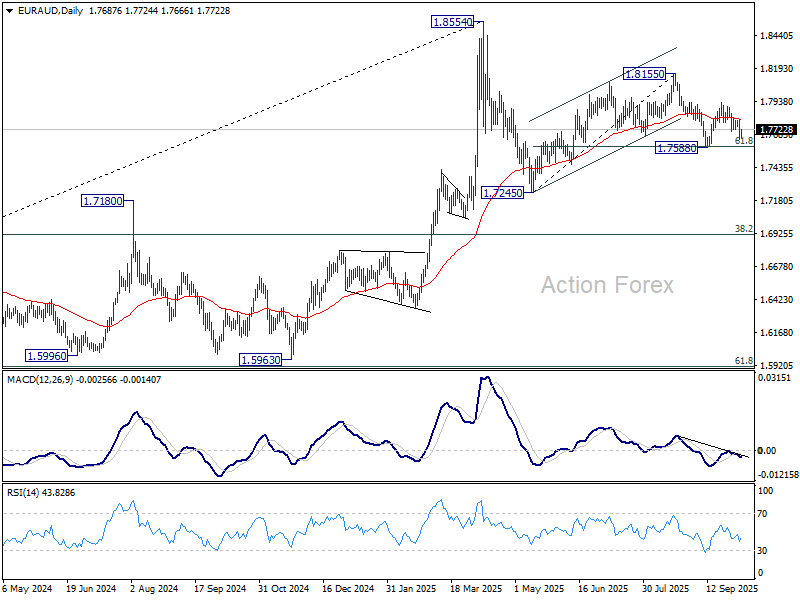
In the bigger picture, price actions from 1.8554 medium term top are seen as a corrective pattern. Deeper fall could be seen as the pattern extends, but downside should be contained by 38.2% retracement of 1.4281 (2022 low) to 1.8554 at 1.6922 to bring rebound. Uptrend from 1.4281 is expected to resume at a later stage.
EUR/CHF Daily Outlook
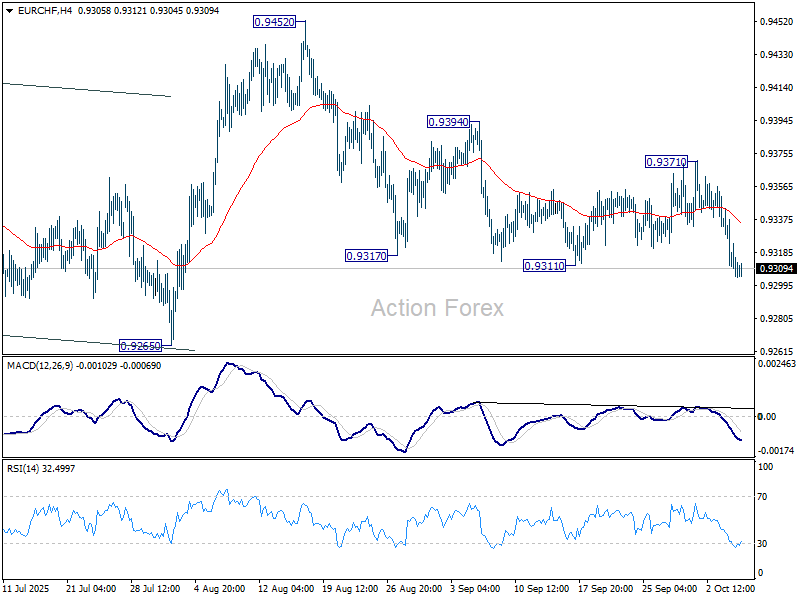
Daily Pivots: (S1) 0.9296; (P) 0.9322; (R1) 0.9336; More...
EUR/CHF's fall from 0.9452 resumed by breaking through 0.9311 and intraday bias is back on the downside for 0.9265 support. Firm break there will bring deeper fall to 0.9218 low. For now, risk will stay on the downside as long as 0.9371 resistance holds, in case of recovery.
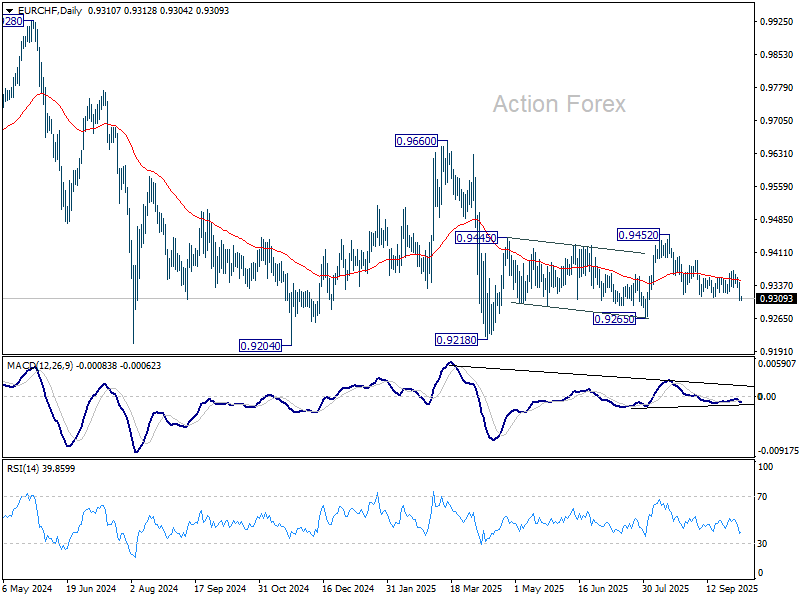
In the bigger picture, the down trend from 0.9204 (2018 high) might still be in progress considering that EUR/CHF is staying well inside the long term falling channel. However, with bullish convergence condition in W MACD, downside potential should be limited in case of another fall. Instead, firm break of 0.9660 resistance will be an important sign of medium term bullish trend reversal.
USD/CAD Daily Outlook
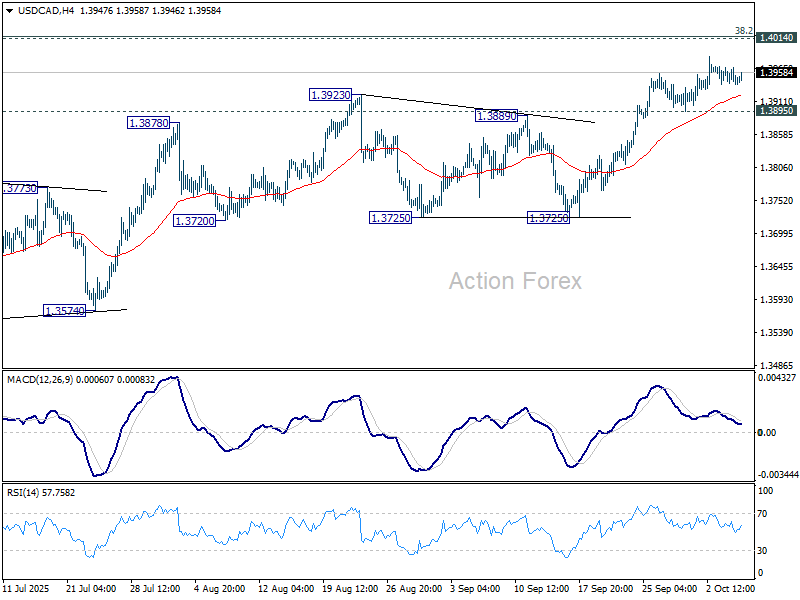
Daily Pivots: (S1) 1.3933; (P) 1.3950; (R1) 1.3961; More...
Intraday bias in USD/CAD is turned neutral again with current retreat. While another rise cannot be ruled out, strong resistance is expected from 1.4014 cluster to complete the corrective rally from 1.3538. On the downside, below 1.3895 support will turn bias back to the downside for 1.3725. However, sustained break of 1.4014 will carry larger bullish implications.
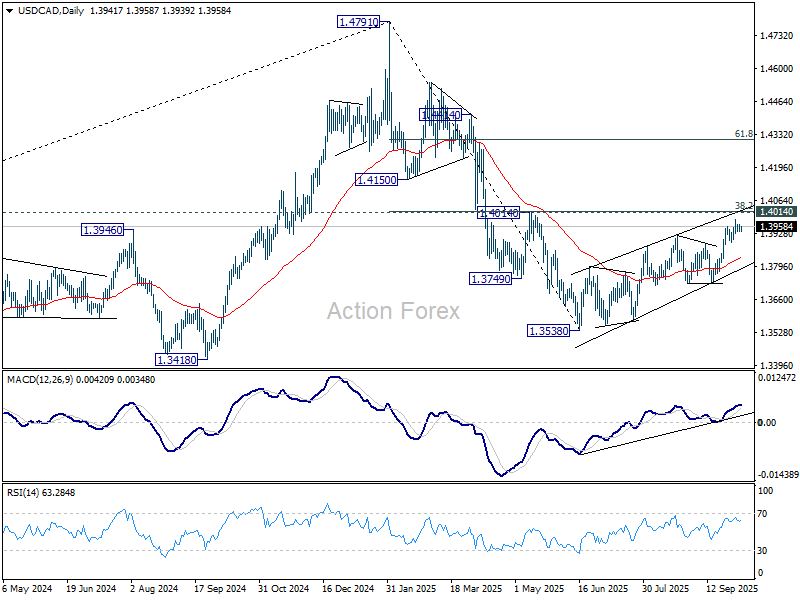
In the bigger picture, price actions from 1.4791 medium term top could either be a correction to rise from 1.2005 (2021 low), or trend reversal. In either case, further decline is expected as long as 1.4014 cluster resistance (38.2% retracement of 1.4791 to 1.3538 at 1.4017) holds. Next target is 61.8% retracement of 1.2005 (2021 low) to 1.4791 (2025 high) at 1.3069. However, sustained break of 1.4014 will argue that fall from 1.4791 has completed, and bring stronger rally to 61.8% retracement at 1.4312.
AUD/USD Daily Report
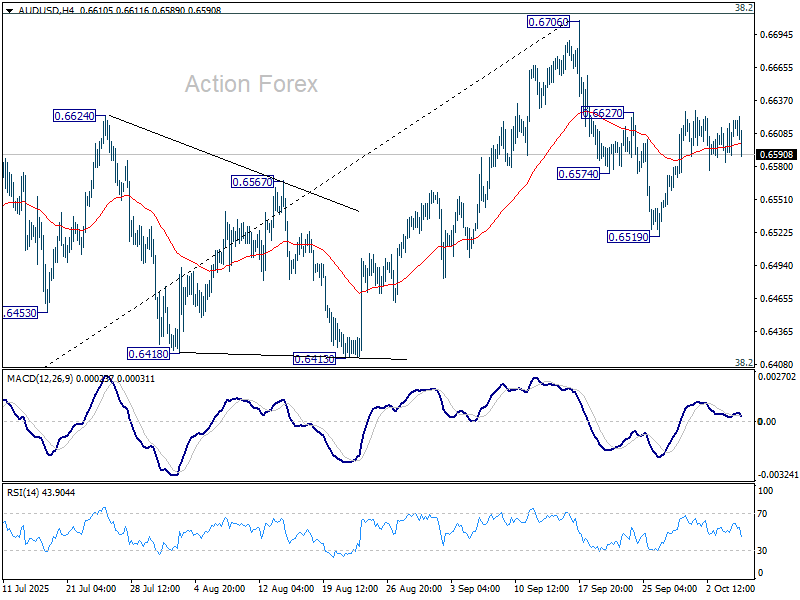
Daily Pivots: (S1) 0.6595; (P) 0.6608; (R1) 0.6631; More...
No change in AUD/USD's outlook and intraday bias stays neutral. On the upside, firm break of 0.6627 resistance will suggest that pullback from 0.6706 has completed as correction, after drawing support from 55 D EMA (now at 0.6557). That will keep the larger rally from 0.5913 alive and bring retest of 0.6706 high. However, on the downside, sustained trading below 55 D EMA will confirm rejection by 0.6713 fibonacci resistance, and bring deeper fall to 0.6413 cluster support (38.2% retracement of 0.5913 to 0.6706 at 0.6403).
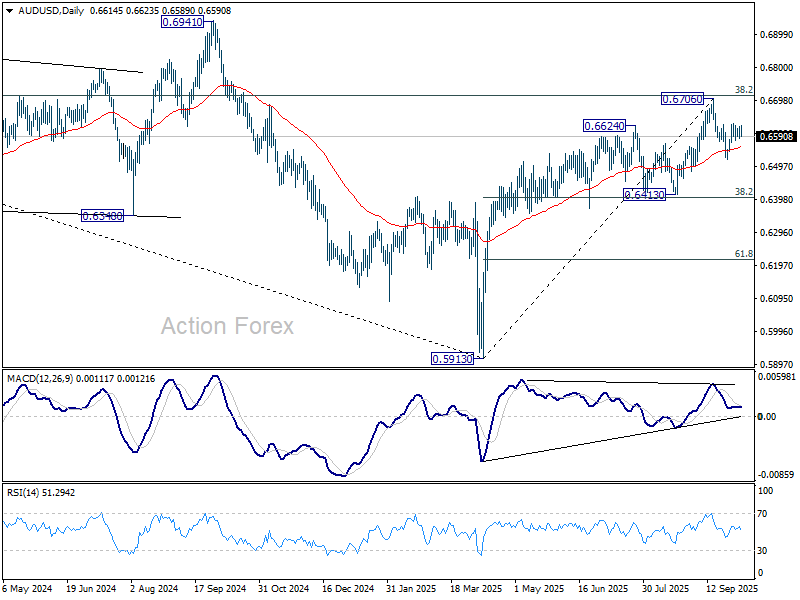
In the bigger picture, there is no clear sign that down trend from 0.8006 (2021 high) has completed. Rebound from 0.5913 is seen as a corrective move. Outlook will remain bearish as long as 38.2% retracement of 0.8006 to 0.5913 at 0.6713 holds. Nevertheless, considering bullish convergence condition in W MACD, sustained break of 0.6713 will be a strong sign of bullish trend reversal, and pave the way to 0.6941 structural resistance for confirmation.
EUR/USD Daily Outlook
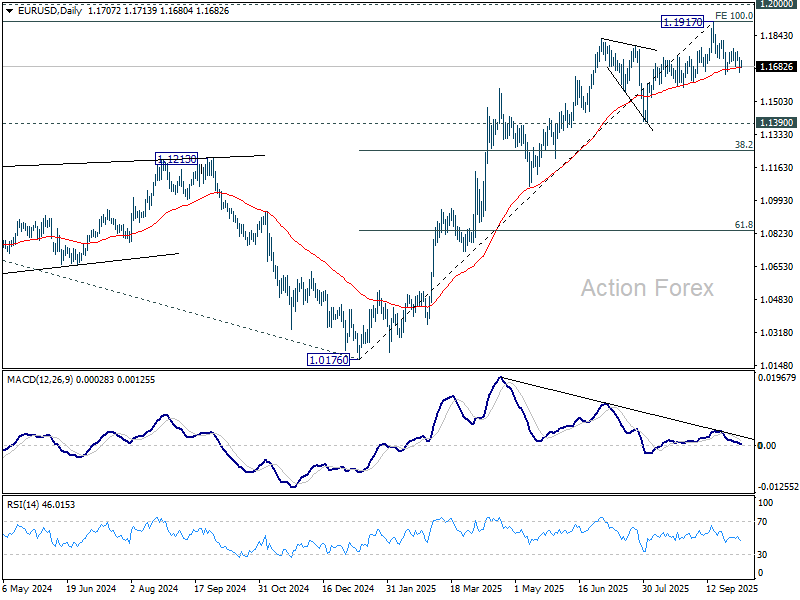
Daily Pivots: (S1) 1.1668; (P) 1.1699; (R1) 1.1747; More...
Intraday bias in EUR/USD remains neutral for the moment, and further decline is mildly in favor as long as 1.1778 resistance holds. On the downside, break of 1.1644 and sustained trading below 55 D EMA (now at 1.1679) will indicate medium term topping at 1.1917, on bearish divergence condition in D MACD. Further fall should then be seen to 1.1390 support. Nevertheless, break of 1.1778 resistance will retain near term bullishness and bring retest of 1.1917 high instead.
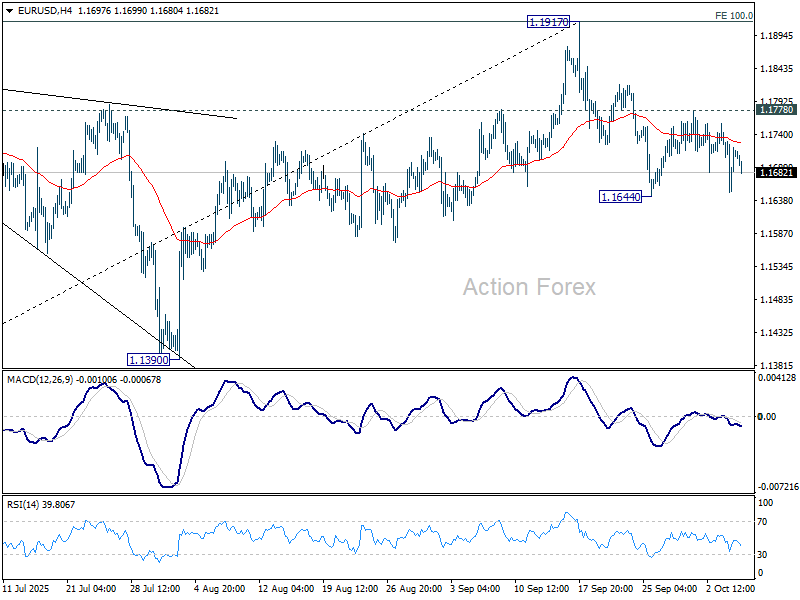
In the bigger picture, rise from 1.0176 (2025 low) is seen as the third leg of the pattern from 0.9534 (2022 low). 100% projection of 0.9534 to 1.1274 from 1.0176 at 1.1916 was already met. For now, further rally will remain in favor as long as 1.1390 support holds, and firm break of 1.2000 psychological level will carry larger bullish implications. However, firm break of 1.1390 will suggest that rise from 1.0176 has already completed and bring deeper fall to 55 W EMA (now at 1.1265).
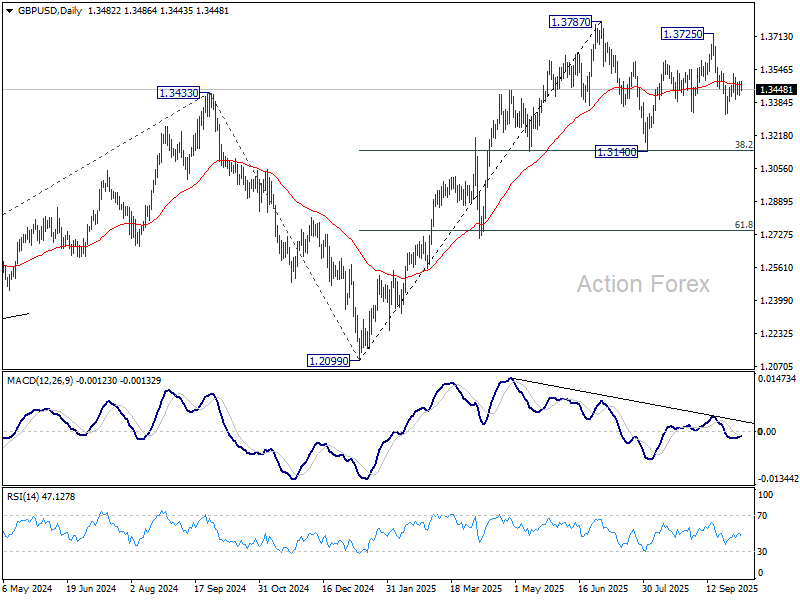
GBP/USD Daily Outlook
Daily Pivots: (S1) 1.3437; (P) 1.3464; (R1) 1.3511; More...
Intraday bias in GBP/USD stays neutral for the moment. With 1.3535 resistance intact, further decline is mildly in favor. On the downside, break of 1.3322 will resume the fall from 1.3725 to 1.3140 support. On the upside, though, firm break of 1.3535 will argue that pullback from 1.3725 has already completed, and bring stronger rise to retest 1.3725/87 key resistance zone.
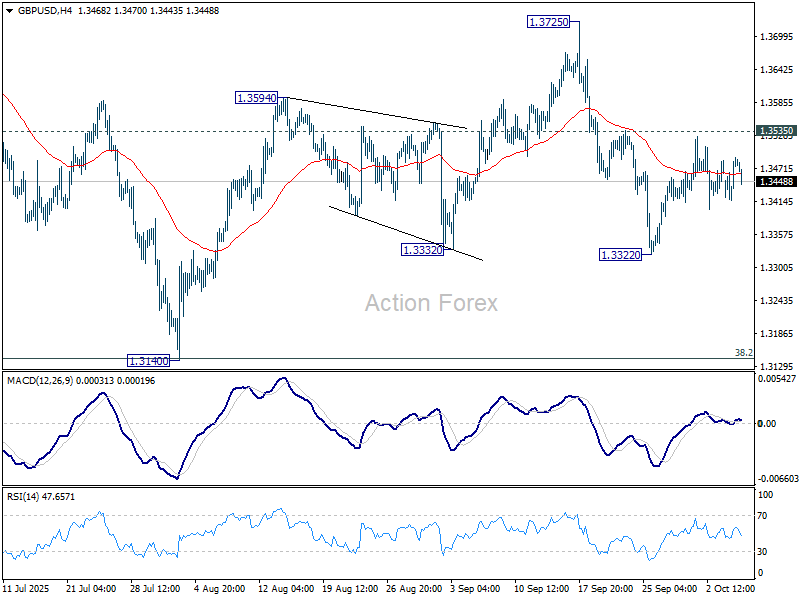
In the bigger picture, rise from 1.0351 (2022 low) is still seen as a corrective move. Further rally could be seen to 61.8% projection of 1.0351 to 1.3433 (2024 high) from 1.2099 (2025 low) at 1.4004. But strong resistance could be seen from 1.4248 (2021 high) to limit upside. Sustained break of 55 W EMA (now at 1.3176) will argue that a medium term top has already formed and bring deeper fall back to 1.2099.