

Live Comments
Fed Raises Rates 25bp to 3.75–4.00%; Median Sees One Further 2026 Hike
The Federal Reserve raised the federal funds target range by 25bp to 3.75–4.00% in a unanimous 12–0 decision. The statement described economic activity as expanding at a solid pace, with resilient domestic spending, strong productivity growth and robust capital investment. It also said job gains had kept pace with labour-force growth and that unemployment had changed little. With inflation still elevated, the Committee said the increase would support a timelier return to its 2% target and declared that it “will deliver price stability.”
The new Summary of Economic Projections paired a stronger economy with a higher but relatively restrained rate path. Median GDP growth forecasts were raised from 2.2% to 2.3% for 2026 and from 2.3% to 2.4% for 2027, while unemployment projections for both years were lowered from 4.3% to 4.1%. The 2026 PCE inflation forecast rose from 3.6% to 3.7%, and core PCE increased from 3.3% to 3.4%. The median policy-rate projection climbed from 3.8% to 4.1% for end-2026 and from 3.6% to 4.1% for end-2027.
Despite those hawkish revisions, the dots did not validate the market’s four-hike trajectory. With today’s target midpoint at 3.875%, the end-2026 median implies only one additional 25bp increase, while the unchanged 4.1% projection for 2027 indicates no further net tightening next year. Initial market reactions reflected that tension. Treasury yields were lower on the day and growth-sensitive equities outperformed, with Nasdaq up around 0.8%. Yet Dollar strengthened modestly, while Dow was nearly unchanged, showing that investors were also responding to the unanimous hike and the Fed’s confidence in growth and price stability.
The initial message is therefore hawkish on current conditions but less hawkish than market pricing on the future path. The stronger economic and inflation forecasts limit the case for calling the outcome dovish, but the projected endpoint falls well short of the 4.50–4.75% plateau embedded in markets before the decision. Attention now turns to Federal Reserve Chair Kevin Warsh’s press conference, where the balance between stronger fundamentals and the restrained dot path should determine whether the split reaction resolves into sustained Dollar strength or a broader easing in financial conditions.
Summary of Economic Projections
| Median projection | September | June |
|---|---|---|
| 2026 GDP growth | 2.3% | 2.2% |
| 2027 GDP growth | 2.4% | 2.3% |
| 2026 unemployment | 4.1% | 4.3% |
| 2027 unemployment | 4.1% | 4.3% |
| 2026 PCE inflation | 3.7% | 3.6% |
| 2027 PCE inflation | 2.3% | 2.3% |
| 2026 core PCE inflation | 3.4% | 3.3% |
| 2027 core PCE inflation | 2.5% | 2.5% |
| End-2026 federal funds rate | 4.1% | 3.8% |
| End-2027 federal funds rate | 4.1% | 3.6% |
| End-2028 federal funds rate | 3.9% | 3.4% |
| Longer-run federal funds rate | 3.2% | 3.1% |
Initial market reaction
| Market | Initial move |
|---|---|
| Dollar Index | +0.24% |
| US 2-year yield | -3.9bp |
| US 10-year yield | -4.9bp |
| S&P 500 | +0.36% |
| Nasdaq Composite | +0.79% |
| Dow Jones | -0.03% |
Key takeaways
- The Fed delivered the expected 25bp hike through a unanimous 12–0 vote.
- The statement was firm, describing growth as solid, domestic spending as resilient and inflation as elevated.
- Officials raised their growth and inflation forecasts while lowering projected unemployment, producing a hawkish economic outlook.
- The rate path nevertheless fell well short of market pricing. The end-2026 median implies only one further hike after today, followed by no additional net tightening in 2027.
- The projected 4.1% endpoint contrasts with the market’s pre-meeting expectation for rates to reach approximately 4.50–4.75%.
- Initial markets delivered a split verdict: lower Treasury yields and stronger technology stocks reflected relief over the restrained dots, while Dollar drew support from the unanimous hike and stronger economic projections.
- The clean interpretation is hawkish in the present, restrained about the future.
US Retail Sales Rise 1.2% in August; Ex-Auto Sales Jump 1.4%
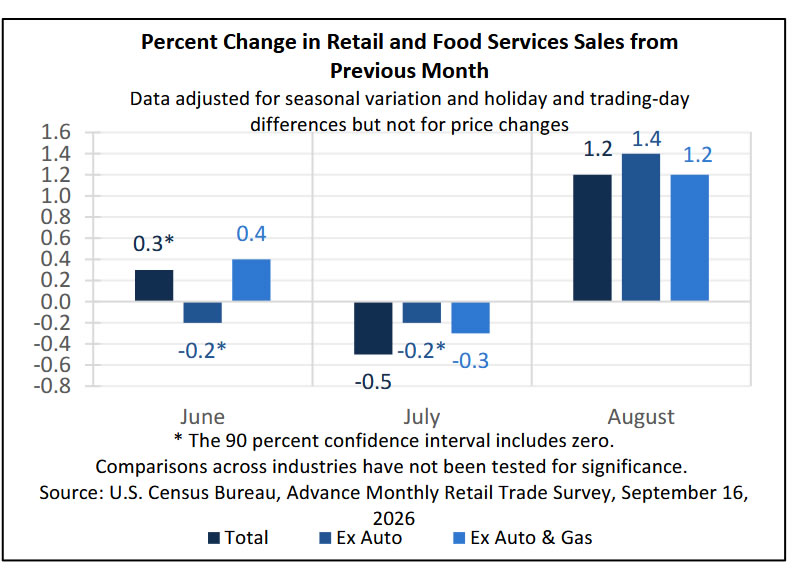
US retail sales rebounded from a revised 0.5% contraction to 1.2% growth month on month in August, exceeding expectations for a 0.8% increase. Sales excluding autos accelerated from a revised 0.2% decline to 1.4% growth, more than double the 0.6% consensus. Sales excluding both autos and gasoline rose 1.2%, while annual growth in total sales strengthened from 5.0% to 6.0%.
The rebound was broadly based. Nonstore retailers led with a 2.6% increase, followed by miscellaneous retailers at 1.9%, electronics and appliances at 1.6%, and sporting goods and food services at 1.2% each. Gasoline-station receipts rose 3.1% as fuel prices increased, but sales excluding gasoline still gained 1.1%, confirming that the headline surprise was not solely an energy-price effect. Building-material sales and department-store receipts were the principal weak spots, falling 0.2% and 0.8%, respectively. The figures are not adjusted for inflation, however, limiting how much of the increase can be interpreted as stronger real consumption.
The report does not change expectations for today’s widely anticipated Federal Reserve rate hike, but it strengthens the case against a dovish policy signal. Resilient consumer spending, combined with inflation pressure from higher energy costs, raises the bar for the new Summary of Economic Projections to show a materially softer path than markets expect. The data therefore matter less for the immediate decision than for whether the Fed validates additional tightening over the coming quarters.
Data summary
| Indicator | Actual | Expected | Previous |
|---|---|---|---|
| Retail sales m/m | 1.2% | 0.8% | -0.5%* |
| Retail sales ex autos m/m | 1.4% | 0.6% | -0.2%* |
*Headline sales were revised from -0.6% to -0.5%. Ex-auto sales were revised from -0.3% to -0.2%.
Additional measures
| Indicator | August | July |
|---|---|---|
| Retail sales y/y | 6.0% | 5.0% |
| Sales excluding gasoline m/m | 1.1% | -0.6% |
| Sales excluding autos and gasoline m/m | 1.2% | -0.3% |
| Retail trade sales m/m | 1.2% | -0.7% |
Industry breakdown
| Category | August m/m |
|---|---|
| Gasoline stations | 3.1% |
| Nonstore retailers | 2.6% |
| Miscellaneous retailers | 1.9% |
| Electronics and appliances | 1.6% |
| Sporting goods, hobbies and books | 1.2% |
| Food services and drinking places | 1.2% |
| Motor vehicles and parts | 0.6% |
| Building materials and garden supplies | -0.2% |
| Department stores | -0.8% |
Key takeaways
- Headline retail sales rebounded from -0.5% to 1.2%, comfortably beating the 0.8% consensus.
- Ex-auto sales delivered the larger surprise, surging 1.4% against expectations of 0.6%.
- Higher fuel prices contributed, but the strength was not confined to gasoline. Sales excluding gasoline rose 1.1%, while sales excluding both autos and gasoline increased 1.2%.
- Spending gains extended across online retail, electronics, restaurants and several discretionary categories, pointing to broad consumer resilience.
- The figures measure nominal sales and are not adjusted for inflation, so stronger receipts do not translate directly into equally strong real consumption.
- The report does not alter expectations for today’s Fed hike, but it raises the bar for a dovish SEP and supports additional tightening beyond the immediate decision.
Eurozone Industrial Production Beats Forecast as Broad Sector Gains Offset Consumer Weakness
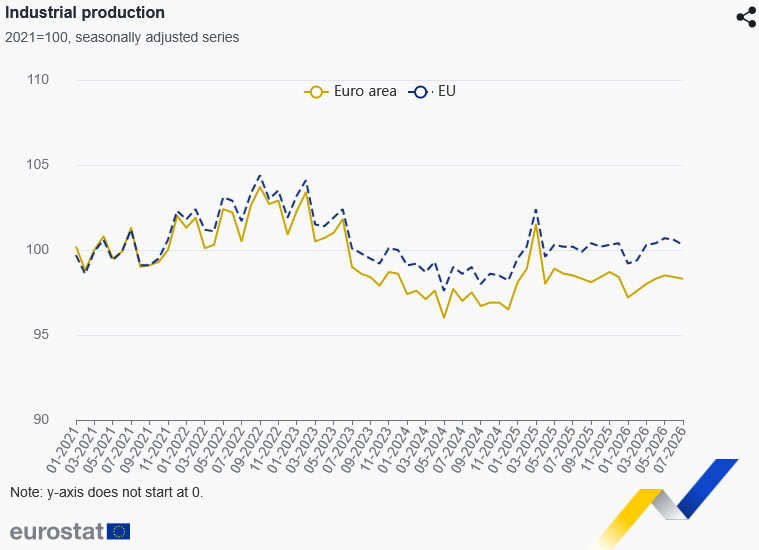
Eurozone industrial production fell 0.1% month on month in July, a smaller contraction than the 0.2% expected. June’s reading was revised from no growth to a 0.1% decline, leaving output down for a second consecutive month. On an annual basis, production improved from a revised 0.3% contraction in June to unchanged in July. Across the wider EU, output fell 0.3% on the month and rose 0.3% from a year earlier.
The monthly decline was concentrated entirely in non-durable consumer goods, where production dropped 1.6%. Output increased across every other main industrial grouping. Energy and durable consumer goods both rose 0.9%, capital goods gained 0.5%, and intermediate goods increased 0.3%. The broad gains suggest the headline contraction overstated the underlying weakness in Eurozone industry.
Performance nevertheless varied significantly across member states. Production fell most sharply in Denmark, Bulgaria and Lithuania, while Luxembourg, Croatia and Ireland recorded the strongest monthly increases. Overall, the smaller-than-expected decline and gains across capital goods, energy and intermediate goods offer some evidence of industrial resilience. However, two consecutive monthly contractions and downward revisions to June leave the broader recovery unconfirmed.
Data summary
| Indicator | Actual | Expected | Previous |
|---|---|---|---|
| Eurozone production m/m | -0.1% | -0.2% | -0.1%* |
*June was revised from 0.0% to -0.1%.
Additional headline data
| Indicator | July | June |
|---|---|---|
| Eurozone production y/y | 0.0% | -0.3%* |
| EU production m/m | -0.3% | -0.1%* |
| EU production y/y | 0.3% | 0.3%* |
*Eurozone annual growth was revised from 0.1% to -0.3%. EU monthly growth was revised from 0.2% to -0.1%, while annual growth was revised from 0.6% to 0.3%.
Eurozone components
| Industrial grouping | July | June |
|---|---|---|
| Intermediate goods | 0.3% | -0.9% |
| Energy | 0.9% | 1.4% |
| Capital goods | 0.5% | -1.8% |
| Durable consumer goods | 0.9% | 0.4% |
| Non-durable consumer goods | -1.6% | 1.8% |
Key takeaways
- Eurozone industrial production fell 0.1% in July, a smaller decline than the 0.2% expected.
- June was revised from stagnation to a 0.1% contraction, confirming a second consecutive monthly decline.
- The weakness was narrowly concentrated in non-durable consumer goods, where production dropped 1.6%.
- All four other main industrial groupings expanded, including capital goods, energy and intermediate goods.
- The composition points to resilience beneath the negative headline, but repeated contractions and adverse revisions leave the industrial recovery unconfirmed
.