
Sample Category Title
EUR/USD Mid-Day Outlook
Daily Pivots: (S1) 1.1338; (P) 1.1397; (R1) 1.1429; More...
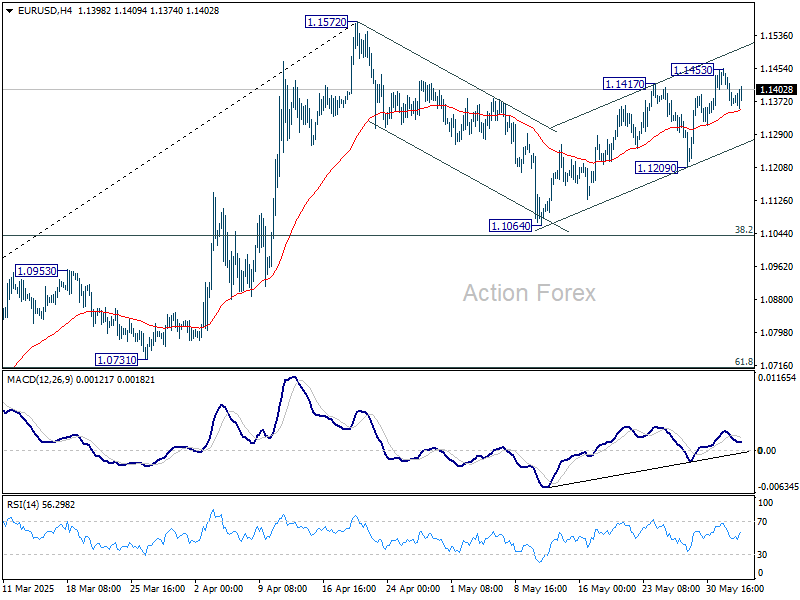
EUR/USD is staying in consolidations below 1.1453 temporary top and intraday bias remains neutral. Rebound from 1.1064 could extend higher, but strong resistance should be seen from 1.1572 to limit upside, at least on first attempt. On the downside, break of 1.1209 support will indicate that the corrective pattern from 1.1572 has started the third leg, and target 1.1064 support.
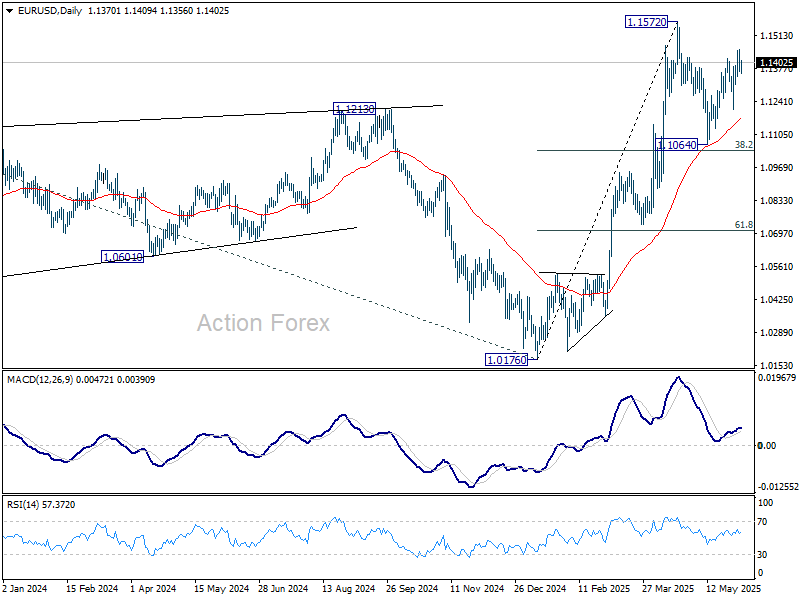
In the bigger picture, rise from 0.9534 long term bottom could be correcting the multi-decade downtrend or the start of a long term up trend. In either case, further rise should be seen to 100% projection of 0.9534 to 1.1274 from 1.0176 at 1.1916. This will now remain the favored case as long as 55 W EMA (now at 1.0856) holds.
Muted Trading Persists as Trump Pressures Fed after ADP Miss
Trading remains subdued as markets drift into the US session, with little conviction across asset classes. US futures dipped slightly after a dismal ADP employment report showing only 37k job additions in May, sharply below expectations. Still, the reaction was contained, with no clear evidence of a broad risk-off move.
US President Donald Trump added to the noise with another jab at Fed on Truth Social: “ADP NUMBER OUT!!! ‘Too Late’ Powell must now LOWER THE RATE.” While such commentary adds political pressure, Fed officials have consistently stated they need to remain patient given the elevated uncertainty surrounding US tariff policies and ongoing trade talks. Fed is clearly reluctant to act prematurely.
Trade remains a key driver of sentiment. The latest round of higher US tariffs on steel and aluminium took effect on Wednesday, affecting all partners except the UK, which has a preliminary agreement in place. Today also marks the Trump administration’s self-imposed deadline for trading partners to submit their “best offers” to avoid sweeping tariffs set to begin in early July. Markets are likely to see a pickup in volatility as the tariff pause approaches its final weeks.
In the currency markets, Dollar is currently the worst performer for the day so far, followed by Loonie and Yen. At the other end, Aussie is leading gains, followed by Kiwi and Swiss Franc. Euro and Pound are holding steady in the middle of the pack. Despite some movement, major currency pairs remain trapped within last week’s ranges.
USD/CAD may come into sharper focus later in the session as BoC delivers its rate decision, alongside the release of the US ISM Services report.
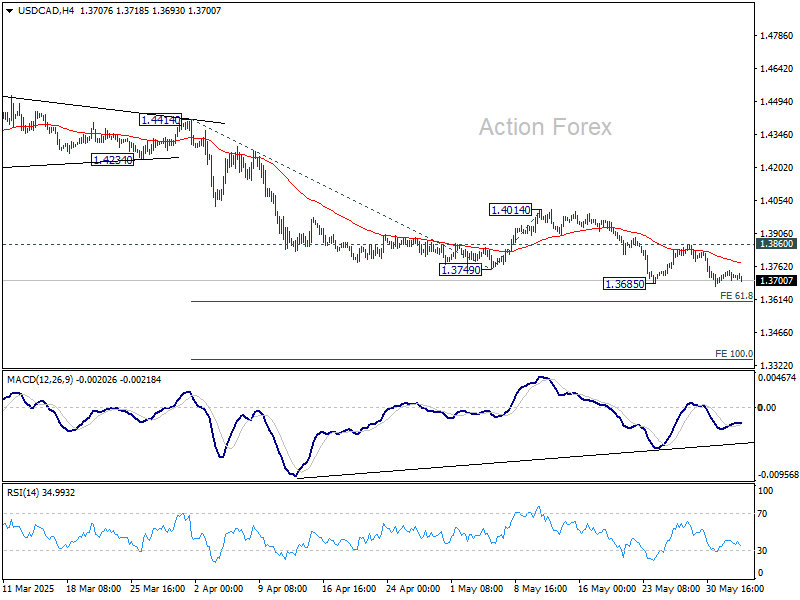
Technically, USD/CAD remains on the defensive and poised for further decline as long as the 1.3860 resistance level holds. 61.8% projection of 1.4414 to 1.3749 from 1.4014 at 1.3603 might provide some support to bring rebound. However, decisive break there could prompt downside acceleration to 100% projection at 1.3349 rather quickly.
In Europe, at the time of writing, FTSE is up 0.22%. DAX is up 0.39%. CAC is up 0.57%. UK 10-year yield is down -0.041 at 4.606. Germany 10-year yield is flat at 2.523. Earlier in Asia, Nikkei rose 0.80%. Hong Kong HSI rose 0.60%. China Shanghai SSE rose 0.42%. Singapore Strait Times is up 0.24%. Japan 10-year JGB yield rose 0.023 to 1.505.
US ADP jobs rise only 37k, but wages growth stays firm
The US private sector added just 37k jobs in May, sharply below expectations of 120k, according to the ADP report.
Weakness was most apparent in goods-producing sectors, which shed -2k jobs, while service providers managed a modest gain of 36k. By company size, medium-sized businesses led with 49k new jobs, while small firms lost -13k and large firms shed -3k.
Despite the hiring slowdown, wage pressures remained firm. Annual pay growth for job-stayers held steady at 4.5%, while job-changers saw a 7% increase, unchanged from April.
Nela Richardson, ADP’s chief economist, acknowledged the slowdown in hiring but noted that wage pressures have not yet eased meaningfully—suggesting lingering tightness in segments of the labor market even as overall momentum weakens.
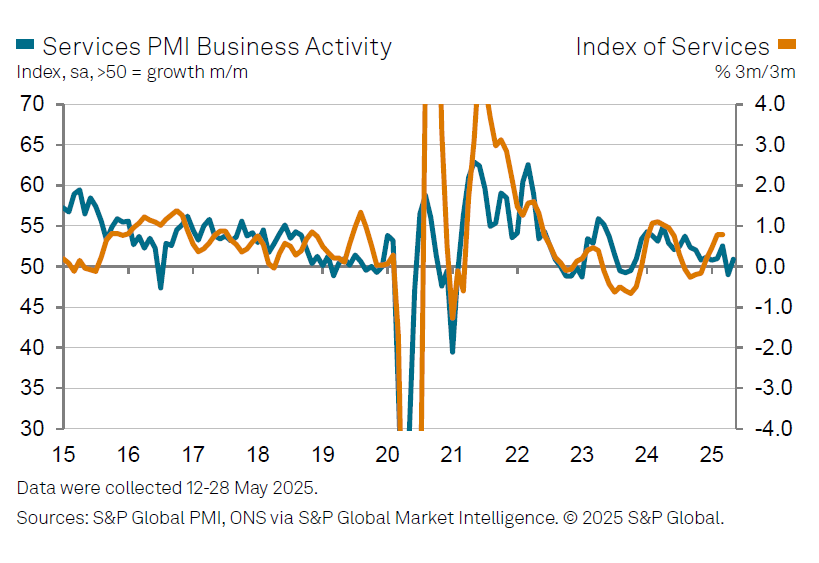
UK PMI services finalized at 50.9, rebound as tariff concerns ease
The UK services sector returned to modest growth in May, with PMI Services finalized at 50.9, rebounding from April’s 27-month low of 49.0. Composite PMI also edged into expansion at 50.3, up from 48.5.
Tim Moore of S&P Global highlighted that easing fears over US tariffs, firmer global markets, and renewed client confidence underpinned the service sector’s recovery. Business sentiment for the year ahead climbed to a seven-month high, driven by investment plans and improved sales expectations.
However, the underlying job market remains soft. The eight-month stretch of declining employment in the sector now marks the longest non-pandemic downturn since the global financial crisis.
But encouragingly, input cost inflation eased from April’s peak, while competitive pricing pressures led to the slowest increase in service charges since October.
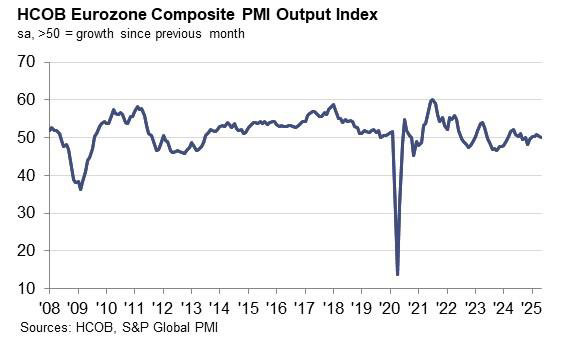
Eurozone PMI composite finalized at 50.2, ECB cuts and Germany to suhion tariffs impact ahead
Eurozone’s services sector contracted modestly in May, with the final PMI Services reading falling to 49.7, down from April’s 50.1, marking a six-month low. This decline pulled the Composite PMI down to 50.2, indicating only marginal overall growth in private sector activity.
The divergence in national performance was notable: Italy led with a 13-month high of 52.5, while Germany and France both remained in contraction, with Germany posting a five-month low of 48.5 and France improving to a nine-month high of 49.3.
Cyrus de la Rubia, Chief Economist at Hamburg Commercial Bank, expressed confidence that expected ECB rate cuts and anticipated fiscal support from Germany would help cushion the impact of rising tariffs and growing uncertainty.
However, inflation signals from the PMI survey were mixed. Services sector sales price growth moderated again, which may reassure the ECB on the disinflation front. Still, cost pressures picked up slightly, which could complicate the ECB’s job over the longer term. Nevertheless, with goods prices easing more quickly and overall inflation slipping below target.
Australia’s GDP grows only 0.2% qoq in Q1, as weather and public investment drag
Australia’s GDP expanded just 0.2% qoq in Q1, falling short of expectations for 0.4% qoq growth. On an annual basis, GDP rose 1.3% yoy. However, GDP per capita declined by -0.2% qoq, marking a renewed contraction in individual economic output.
The ABS noted that severe weather disrupted key sectors including mining, tourism, and shipping, while also impacting domestic demand and exports.
The most notable drag came from public investment, which fell -2.0%, contributing to the largest negative impact from public spending since Q3 2017. Net exports also weighed slightly, subtracting -0.1 percentage points from quarterly growth.
Japan’s PMI composite finalized at 50.2, growth momentum falters
Japan’s private sector lost steam in May as final PMI Services reading slipped to 51.0 from April’s 52.4, while Composite PMI declined to 50.2 from 51.2. The data point to only marginal growth in overall activity, with a slowdown in services combining with a mild deterioration in manufacturing output.
S&P Global’s Annabel Fiddes noted that the rise in total new orders "moved closer to stagnation, as service sector sales grew at their slowest pace in six months and factory demand continued to decline. This moderation suggests that Japan’s private sector "may struggle to bounce back in the near-term".
Underlying concerns were linked to external and structural factors, including an uncertain global demand outlook, persistent labor shortages, and mounting cost pressures.
EUR/USD Mid-Day Outlook
Daily Pivots: (S1) 1.1338; (P) 1.1397; (R1) 1.1429; More...
EUR/USD is staying in consolidations below 1.1453 temporary top and intraday bias remains neutral. Rebound from 1.1064 could extend higher, but strong resistance should be seen from 1.1572 to limit upside, at least on first attempt. On the downside, break of 1.1209 support will indicate that the corrective pattern from 1.1572 has started the third leg, and target 1.1064 support.
In the bigger picture, rise from 0.9534 long term bottom could be correcting the multi-decade downtrend or the start of a long term up trend. In either case, further rise should be seen to 100% projection of 0.9534 to 1.1274 from 1.0176 at 1.1916. This will now remain the favored case as long as 55 W EMA (now at 1.0856) holds.
US ADP jobs rise only 37k, but wages growth stays firm
The US private sector added just 37k jobs in May, sharply below expectations of 120k, according to the ADP report.
Weakness was most apparent in goods-producing sectors, which shed -2k jobs, while service providers managed a modest gain of 36k. By company size, medium-sized businesses led with 49k new jobs, while small firms lost -13k and large firms shed -3k.
Despite the hiring slowdown, wage pressures remained firm. Annual pay growth for job-stayers held steady at 4.5%, while job-changers saw a 7% increase, unchanged from April.
Nela Richardson, ADP’s chief economist, acknowledged the slowdown in hiring but noted that wage pressures have not yet eased meaningfully—suggesting lingering tightness in segments of the labor market even as overall momentum weakens.
Bitcoin Rebounded, While Ethereum Still Fights With 200-Day MA
Market Picture
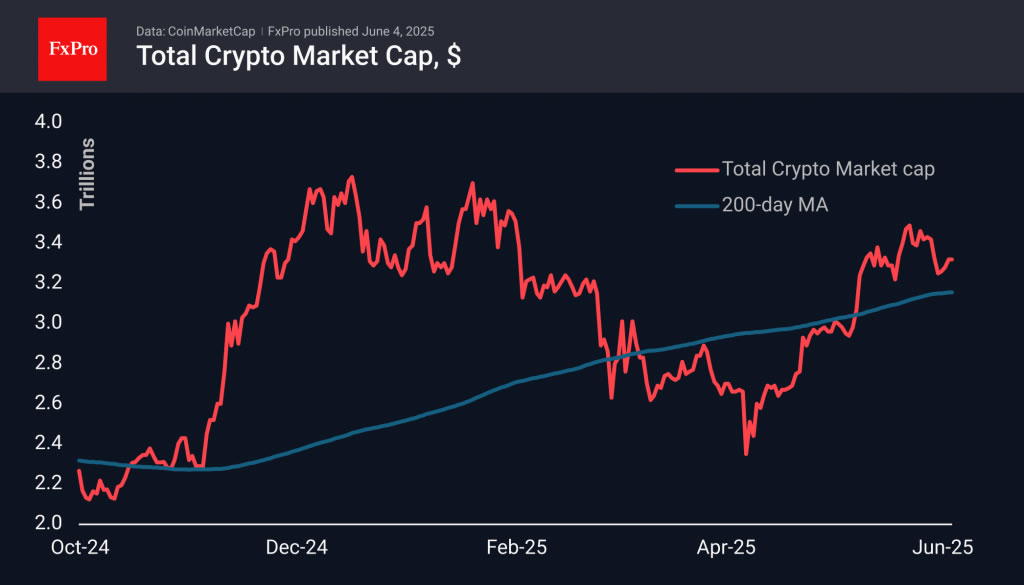
The market capitalisation, at $3.32 trillion, remains roughly the same as the day before. With the start of the new month, there is a visible upward trend with a sequence of higher local highs, although the market is more than 3% lower than it was seven days ago.
The cryptocurrency sentiment index remains in greed territory at 62, although it has lost a couple of points over the day. This cooling does not interfere with the local positive trend but indicates a moderate pace of growth.
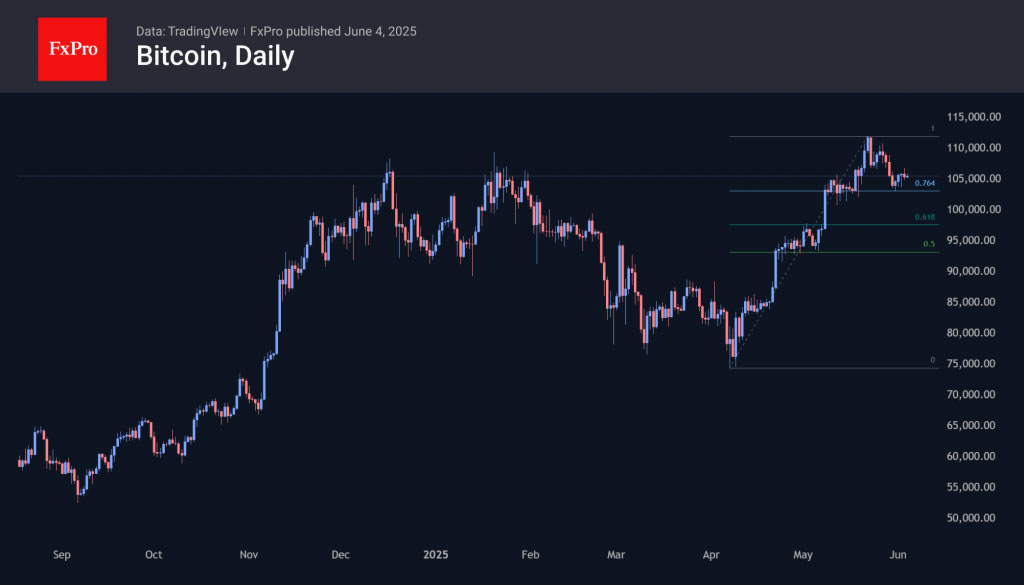
Bitcoin is trading above $105K, rebounding from lows near $103K on 31 May. This looks like the beginning of an upward movement from the mid-May consolidation area. Potentially, this momentum could take the market to new highs above $130K.
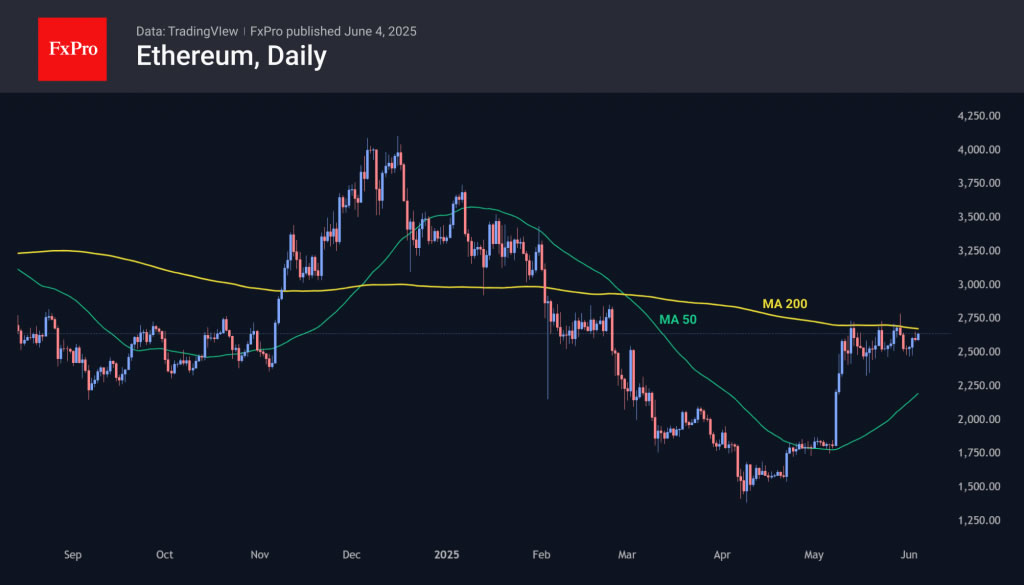
Ethereum continues to struggle with its 200-day moving average, unable to consolidate above it. However, the overall positive background allows bulls to seize the initiative on downward pullbacks quickly. As was the case three and a half weeks ago, breaking through $2,700 will be an important signal that the coin has moved from consolidation to growth. In turn, this could be an important indicator of renewed optimism for the entire cryptocurrency market.
News Background
According to Cryptoquant, Bitcoin could correct to $96,700. This level corresponds to the average purchase price of short-term investors. Bitcoin Magazine is also not optimistic about Bitcoin’s short-term prospects.
Strategy has announced the issue of 2.5 million preferred shares with a 10% dividend yield. The funds raised will be used to purchase the first cryptocurrency.
Hong Kong-based Reitar Logtech Holdings intends to purchase $1.5 billion worth of Bitcoin as a hedge against volatility in traditional markets and to increase financial stability. No specific purchase dates have been announced.
Binance founder Changpeng Zhao has discussed the risks associated with the widespread creation of corporate reserves based on Bitcoin. According to him, they are ‘non-binary and range from 0 to 100.’ However, with the right balance, it is possible to achieve an optimal risk/return ratio.
GBP/USD Holds Near Three-Year High as Pound Shows Resilience
The GBP/USD pair remains steady around 1.3515, maintaining its strength after reaching a three-year high on 26 May. The British pound has shown greater stability than other major currencies amid rising geopolitical and economic pressures.
Pound supported by global tensions and domestic optimism
Ongoing trade tensions between the US and China continue to weigh on market sentiment, indirectly supporting the pound. President Donald Trump’s decision to double tariffs on steel and aluminium triggered an intense backlash from China, which accused the US of breaching the recent trade deal and threatened to retaliate.
At the same time, optimism about the British economy is helping to sustain demand for the pound. The International Monetary Fund (IMF) upgraded the UK’s 2025 growth forecast to 1.2% from 1.1%. However, it also warned Chancellor Rachel Reeves of the need to exercise strict fiscal discipline ahead of her budget presentation on 11 June.
Inflation remains elevated, particularly in the food sector, where prices rose by 4.1% in May – the highest increase since February 2024. According to Kantar, this has prompted UK consumers to seek more discounts and shift towards cheaper brands.
Due to persistent inflation, the market is currently pricing in only a 40-basis-point rate cut from the Bank of England this year.
Technical analysis of GBP/USD
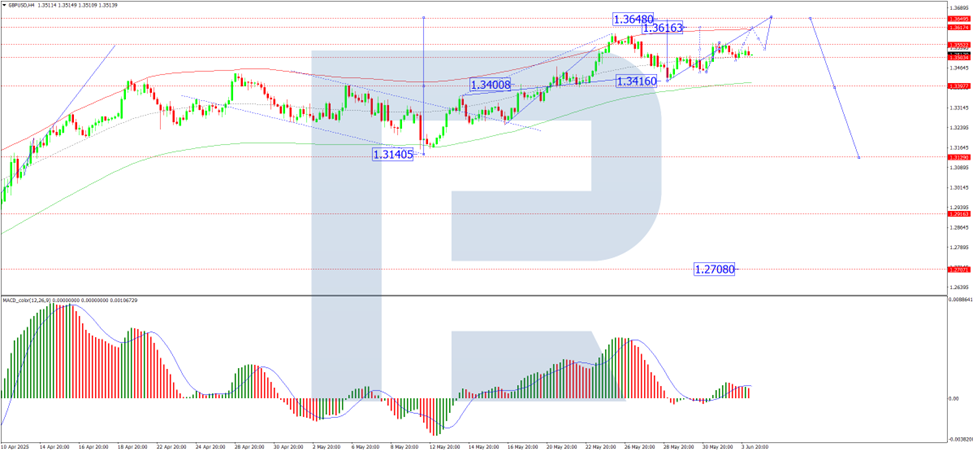
On the H4 chart, GBP/USD continues to develop the fifth wave of growth towards 1.3648. The market is consolidating near 1.3515 and is expected to break upwards towards 1.3616, with the wave potentially extending to 1.3648. If the market breaks downwards, a further correction to 1.3400 is possible before resuming growth. The MACD indicator confirms the bullish scenario, with its signal line above zero and pointing firmly upwards.
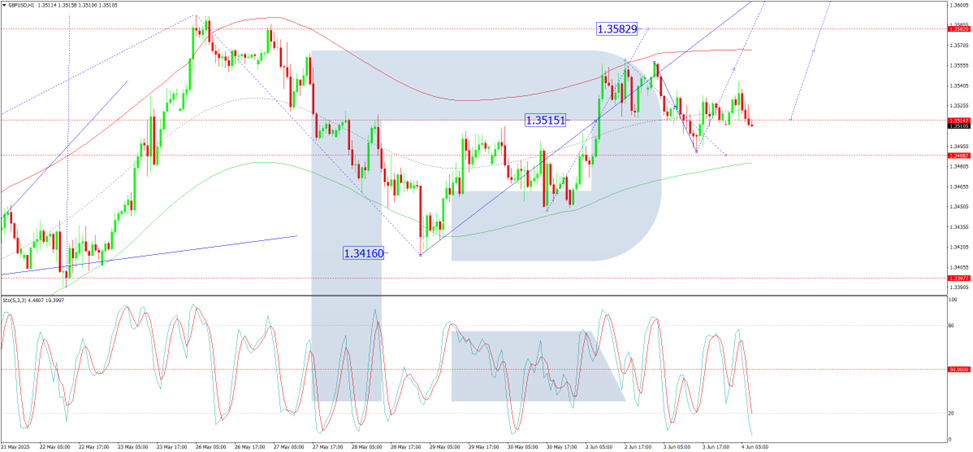
On the H1 chart, GBP/USD formed a consolidation range around 1.3515 and broke upwards, nearly hitting the local target of 1.3559. The market is now undergoing a correction, targeting 1.3489. Once this pullback is complete, the next growth wave may reach 1.3583. The Stochastic oscillator supports this view, with its signal line below 50 and heading sharply downwards towards 20, suggesting room for a short-term dip before renewed upward momentum.
Conclusion
GBP/USD remains firm near multi-year highs, supported by a mix of global trade tensions, domestic economic optimism, and elevated inflation. Technically, the outlook remains bullish, with key targets at 1.3583, 1.3616 and 1.3648. Support levels are at 1.3489 and 1.3400 in the event of a pullback. The pound’s relative stability continues to position it as one of the more resilient major currencies in the current environment.
UK PMI services finalized at 50.9, rebound as tariff concerns ease
The UK services sector returned to modest growth in May, with PMI Services finalized at 50.9, rebounding from April’s 27-month low of 49.0. Composite PMI also edged into expansion at 50.3, up from 48.5.
Tim Moore of S&P Global highlighted that easing fears over US tariffs, firmer global markets, and renewed client confidence underpinned the service sector’s recovery. Business sentiment for the year ahead climbed to a seven-month high, driven by investment plans and improved sales expectations.
However, the underlying job market remains soft. The eight-month stretch of declining employment in the sector now marks the longest non-pandemic downturn since the global financial crisis.
But encouragingly, input cost inflation eased from April’s peak, while competitive pricing pressures led to the slowest increase in service charges since October.
Eurozone PMI composite finalized at 50.2, ECB cuts and Germany to suhion tariffs impact ahead
Eurozone’s services sector contracted modestly in May, with the final PMI Services reading falling to 49.7, down from April’s 50.1, marking a six-month low. This decline pulled the Composite PMI down to 50.2, indicating only marginal overall growth in private sector activity.
The divergence in national performance was notable: Italy led with a 13-month high of 52.5, while Germany and France both remained in contraction, with Germany posting a five-month low of 48.5 and France improving to a nine-month high of 49.3.
Cyrus de la Rubia, Chief Economist at Hamburg Commercial Bank, expressed confidence that expected ECB rate cuts and anticipated fiscal support from Germany would help cushion the impact of rising tariffs and growing uncertainty.
However, inflation signals from the PMI survey were mixed. Services sector sales price growth moderated again, which may reassure the ECB on the disinflation front. Still, cost pressures picked up slightly, which could complicate the ECB’s job over the longer term. Nevertheless, with goods prices easing more quickly and overall inflation slipping below target.
EUR/USD Trims Gains as USD/CHF Targets Upside Break
EUR/USD started a downside correction from the 1.1450 resistance. USD/CHF is rising and might aim for a move towards the 0.8250 resistance.
Important Takeaways for EUR/USD and USD/CHF Analysis Today
The Euro struggled to clear the 1.1450 resistance and declined against the US Dollar.
There was a break below a key bullish trend line with support at 1.1395 on the hourly chart of EUR/USD at FXOpen.
USD/CHF is showing positive signs above the 0.8200 resistance zone.
There was a break above a connecting bearish trend line with resistance at 0.8180 on the hourly chart at FXOpen.
EUR/USD Technical Analysis
On the hourly chart of EUR/USD at FXOpen, the pair gained pace for a move above the 1.1300 zone, as mentioned in the previous analysis. The Euro tested the 1.1450 resistance and recently corrected gains against the US Dollar.
The pair dipped below 1.1400. There was a break below a key bullish trend line with support at 1.1395. It even traded below the 23.6% Fib retracement level of the upward move from the 1.1209 swing low to the 1.1454 high.
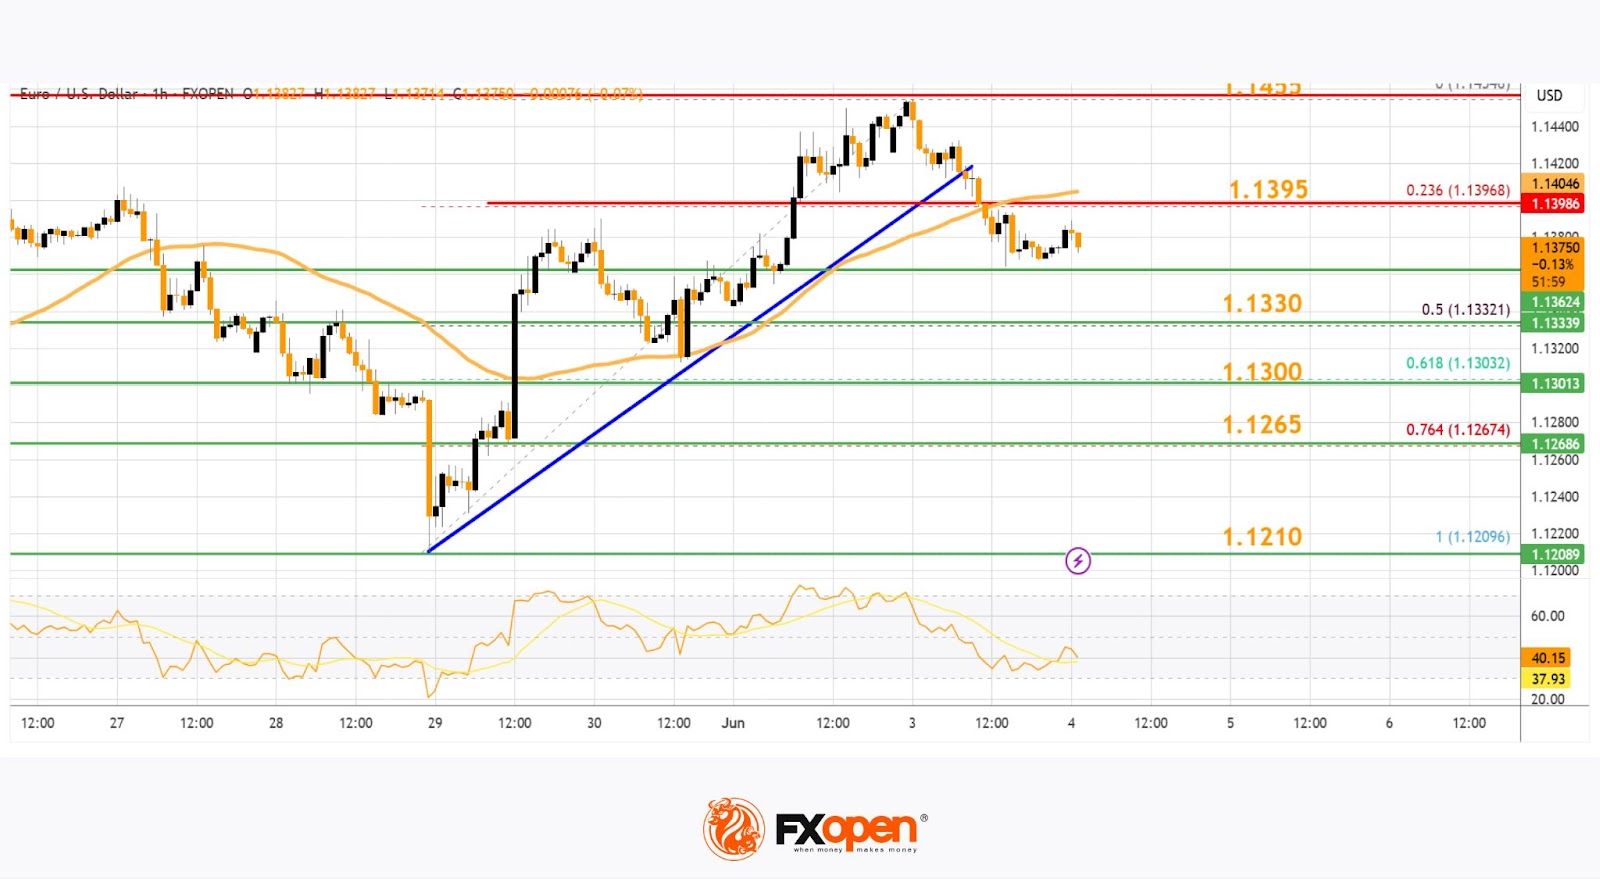
The pair is showing some bearish signs, and upside potential might remain limited. Immediate resistance is near the 50-hour simple moving average at 1.1395.
The next major resistance is near the 1.1450 zone. An upside break above the 1.1450 level might send the pair toward the 1.1500 resistance. Any more gains might open the doors for a move toward the 1.1550 level.
On the downside, immediate support on the EUR/USD chart is seen near the 50% Fib retracement level of the upward move from the 1.1209 swing low to the 1.1454 high at 1.1330. The next major support is near the 1.1300 level. A downside break below the 1.1300 support could send the pair toward the 1.1210 level.
USD/CHF Technical Analysis
On the hourly chart of USD/CHF at FXOpen, the pair declined heavily below the 0.8250 level before the bulls appeared. The US Dollar tested 0.8160 and recently started a fresh increase against the Swiss Franc.
The pair climbed above the 0.8200 resistance zone. There was a break above the 23.6% Fib retracement level of the downward move from the 0.8337 swing high to the 0.8157 low. Besides, there was a break above a connecting bearish trend line with resistance at 0.8180.
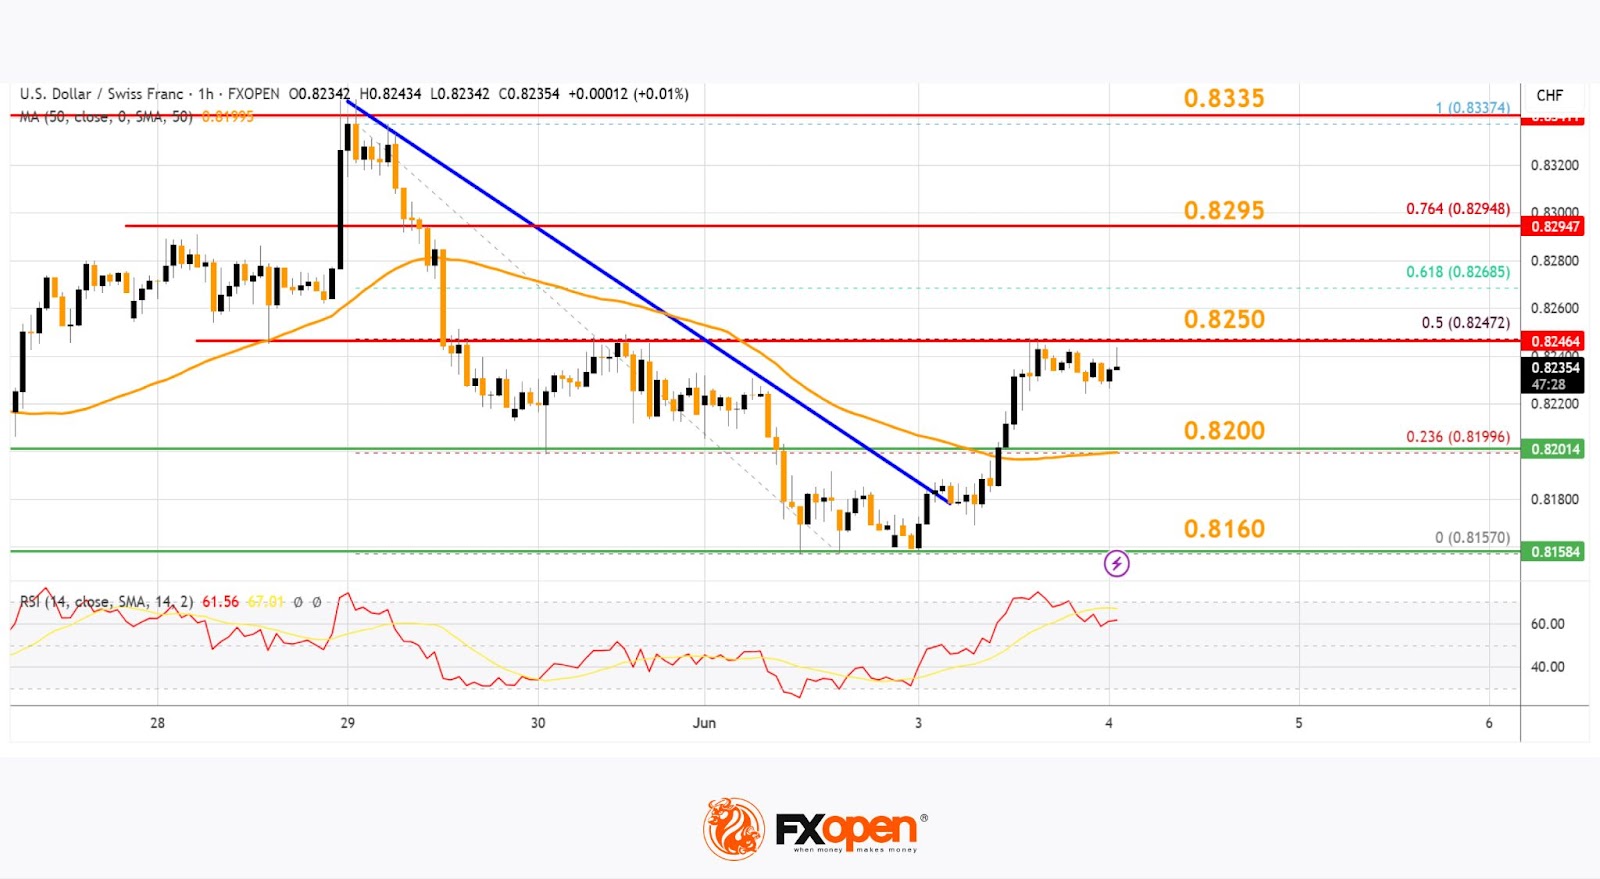
The bulls are now facing resistance near the 50% Fib retracement level of the downward move from the 0.8337 swing high to the 0.8157 low at 0.8250. The next major resistance is 0.8295.
The main resistance is near 0.8335. If there is a clear break above 0.8335 and the RSI remains above 50, the pair could start another increase. In the stated case, it could test 0.8420.
If there is another decline, the pair might test the 0.8200 support. The first major support on the USD/CHF chart is near the 0.8160 zone. A downside break below 0.8160 might spark bearish moves. The next major support is near the 0.8120 pivot level. Any more losses may possibly open the doors for a move towards the 0.8050 level in the near term.
Trade over 50 forex markets 24 hours a day with FXOpen. Take advantage of low commissions, deep liquidity, and spreads from 0.0 pips. Open your FXOpen account now or learn more about trading forex with FXOpen.
This article represents the opinion of the Companies operating under the FXOpen brand only. It is not to be construed as an offer, solicitation, or recommendation with respect to products and services provided by the Companies operating under the FXOpen brand, nor is it to be considered financial advice.
USD/CAD Holds Near 2025 Low
As the chart shows, the USD/CAD exchange rate hit its lowest level of 2025 on 2nd June, nearing the 1.3680 mark. Although there was a partial recovery on 3rd June, it was not substantial.
These fluctuations reflect market participants’ cautious sentiment ahead of key announcements scheduled for today, 4th June:
→ At 15:15 (GMT+3), the ADP Employment Change figures will be released, offering insight into the US employment situation. Traders are concerned as the previous reading was only +61K — a sharp contrast to the consistent triple-digit increases seen throughout 2024.
→ At 16:45 (GMT+3), the Bank of Canada will announce its interest rate decision. According to ForexFactory, analysts expect the overnight rate to remain unchanged at 2.75%, though surprises cannot be ruled out.
Technical Analysis of USD/CAD
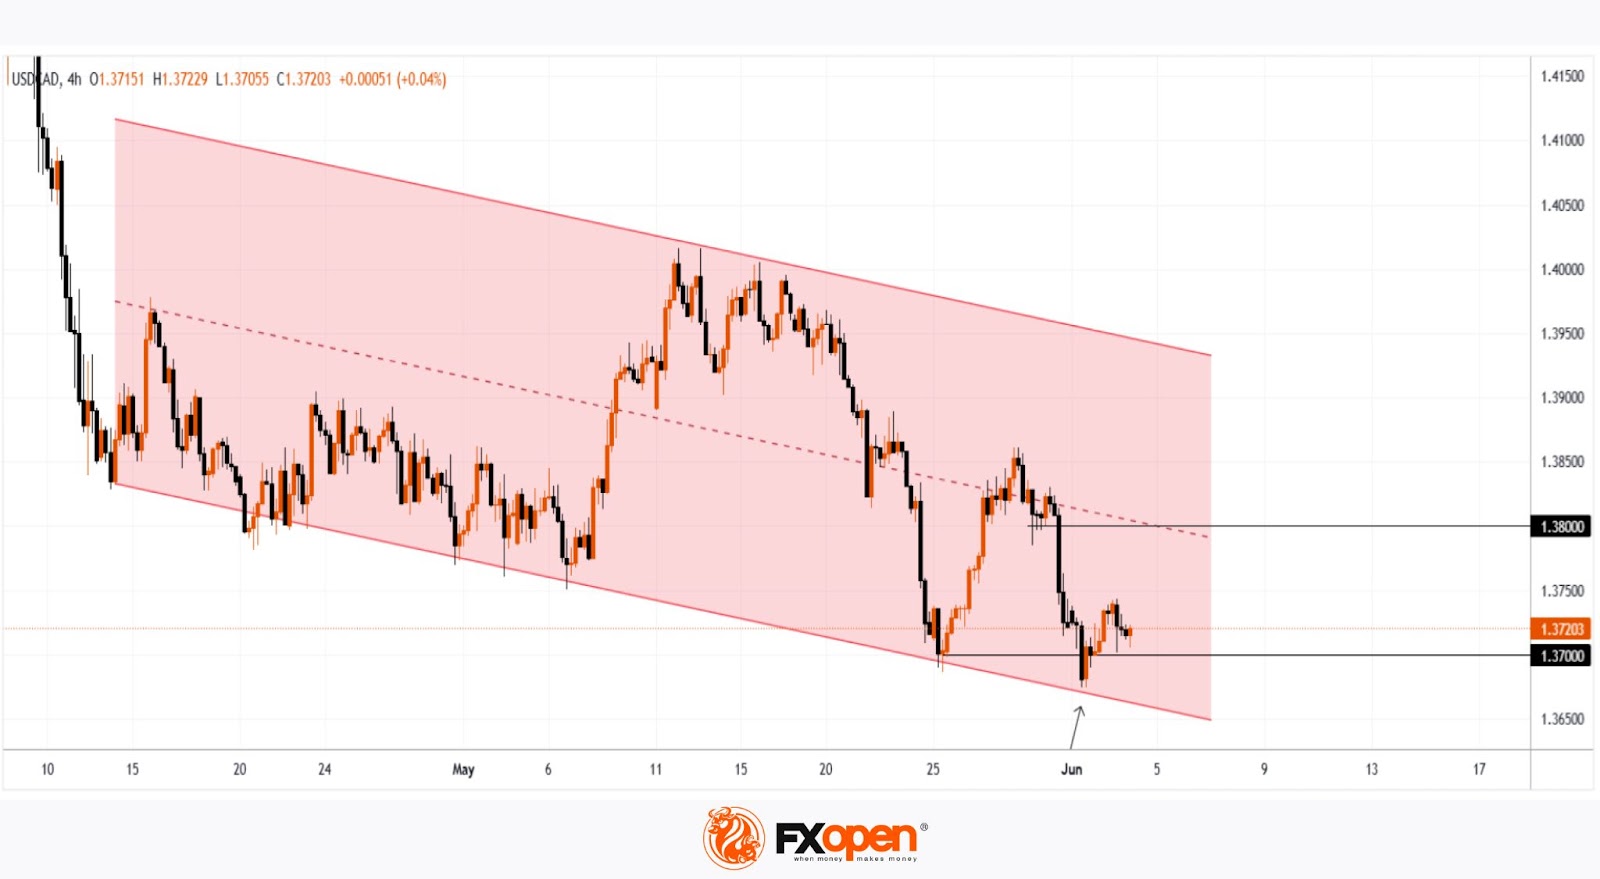
Since the second half of April, the price has been moving within a downward channel (marked in red), largely influenced by tariff-related developments in US-Canada trade relations.
Bulls are attempting to prevent further decline, taking advantage of the support provided by the channel’s lower boundary. Note the sharp rebound following a failed bearish breakout (marked with an arrow), which suggests strong demand around the 1.3700 level.
On the other hand, bears have gained control over the 1.3800 level, based on the following:
→ The exchange rate found local support at this level on 29th May, but it was breached on 30th May.
→ The drop from 30th May was notably aggressive, indicating strong selling pressure.
Given the above, it is reasonable to assume that if, following today’s news, the USD/CAD rate remains within the 1.3700–1.3800 range, it may signal that supply and demand have reached a stable balance. This could suggest that the pair is ready to stabilise after the intense volatility seen in the first half of April.
Trade over 50 forex markets 24 hours a day with FXOpen. Take advantage of low commissions, deep liquidity, and spreads from 0.0 pips. Open your FXOpen account now or learn more about trading forex with FXOpen.
This article represents the opinion of the Companies operating under the FXOpen brand only. It is not to be construed as an offer, solicitation, or recommendation with respect to products and services provided by the Companies operating under the FXOpen brand, nor is it to be considered financial advice.
XBR/USD Chart Analysis: Oil Price Rises to Key Resistance
Yesterday, the price of Brent crude climbed above $65.60 — the highest level in over a week.
According to media reports, several bullish factors are driving this move:
→ Stalled negotiations between the US and Iran over abandoning Iran’s nuclear programme in exchange for lifting oil export sanctions;
→ Wildfires in Canada, which have significantly reduced oil output;
→ Market reaction to the OPEC+ meeting held over the weekend;
→ A weakening US dollar.
Technical Analysis of the XBR/USD Chart
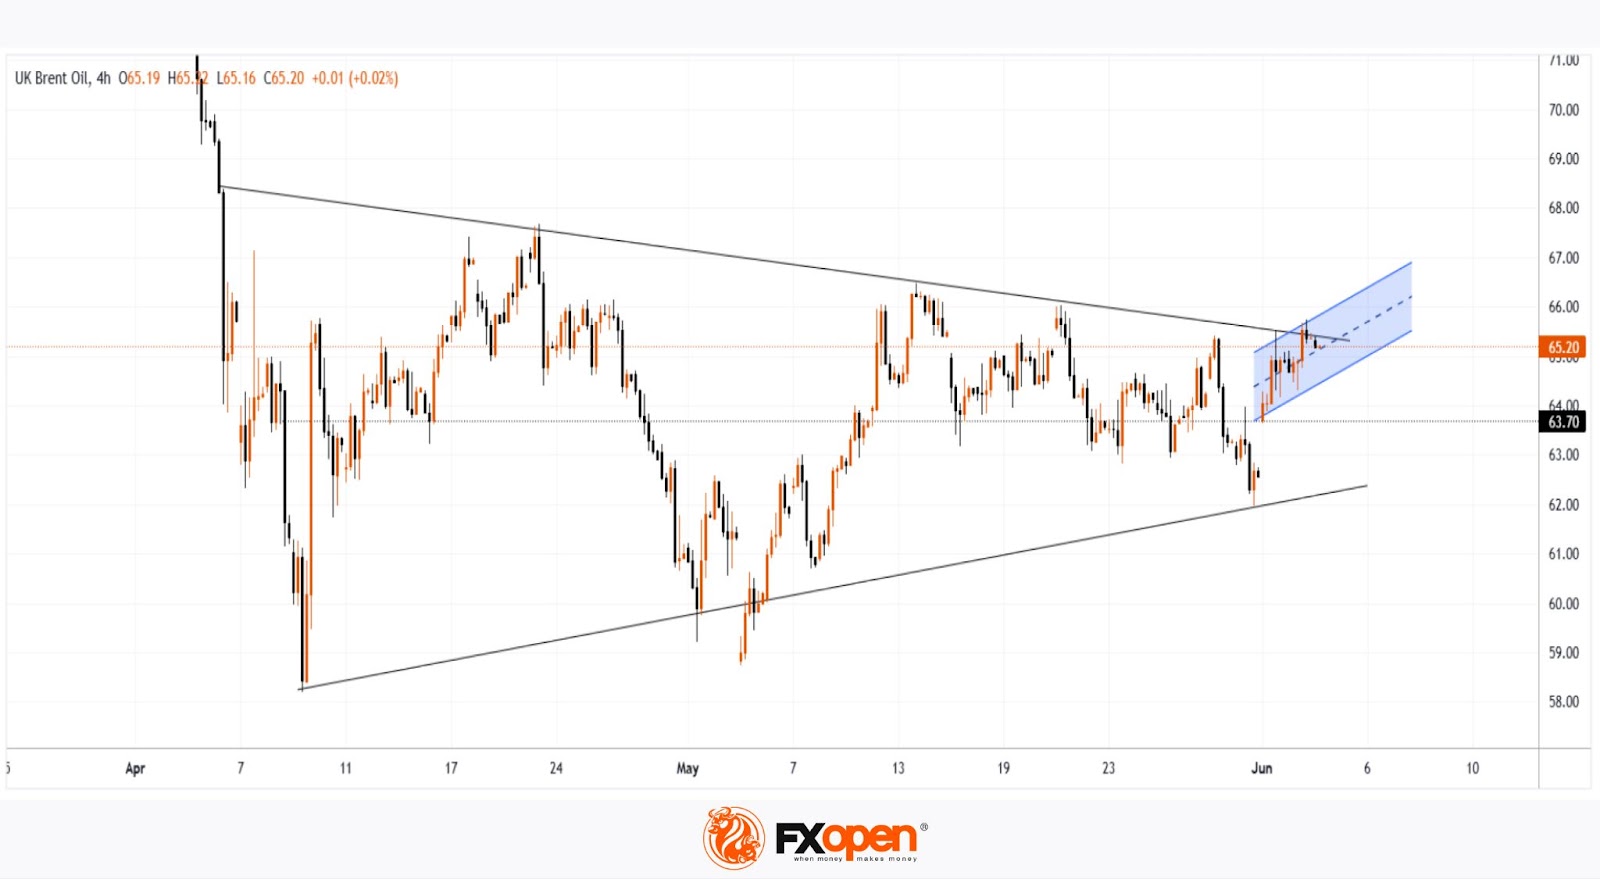
From a technical standpoint, Brent crude oil:
→ Has been forming a short-term ascending channel (marked in blue) since the beginning of the week;
→ Has approached a major resistance level.
This resistance is defined by the upper boundary of a narrowing triangle, with its central axis around the $63.70 level — a price that could be considered a fair value based on trading over the past one and a half months.
This situation points to two possible scenarios:
→ A downward reversal from the key resistance, with expectations that the price will return to the triangle’s central axis. A break below the lower boundary of the local blue channel would support this scenario.
→ An attempt at a bullish breakout of the triangle. While this scenario cannot be ruled out, it appears less likely due to the global economic slowdown risks posed by tariff-related trade barriers.
Start trading commodity CFDs with tight spreads. Open your trading account now or learn more about trading commodity CFDs with FXOpen.
This article represents the opinion of the Companies operating under the FXOpen brand only. It is not to be construed as an offer, solicitation, or recommendation with respect to products and services provided by the Companies operating under the FXOpen brand, nor is it to be considered financial advice.