
Sample Category Title
Japan’s real wages fall -1.8% yoy in April, down for the fourth month
Real wages in Japan fell by -1.8% yoy in April, marking the fourth consecutive month of decline as persistent inflation continued to erode household purchasing power.
While nominal wages rose 2.3% yoy, slightly below the expected 2.6%, gains were outpaced by a still-elevated consumer inflation rate of 4.1%, driven by rising food and energy costs. The inflation metric used by the labor ministry has remained near 4% for five straight months, keeping real income in negative territory.
On the positive side, base salaries rose 2.2% yoy, the fastest increase in four months and well above March’s 1.4% yoy gain. This also marked the 42nd consecutive month of growth in regular pay. Overtime pay rebounded with a modest 0.8% yoy rise, while special payments grew 4.1% yoy.
Fed’s Beige Book: General tone slightly pessimistic and uncertain
Fed's Beige Book report paints a picture of slowing US economy marked by pervasive caution and subdued sentiment.
Economic activity was reported to have “declined slightly” overall, with half of the twelve Districts seeing slight to moderate declines, while three reported no change and three noted slight growth. The general tone remains “slightly pessimistic and uncertain,” echoing the previous report, as elevated policy and economic uncertainty continues to weigh on both business and household decision-making.
Consumer spending trends were mixed, with most Districts reporting little change or modest declines. However, in some cases, spending picked up on goods expected to be affected by tariffs—suggesting front-loading behavior amid trade concerns. Employment levels were largely stable, while price pressures persisted, rising at a moderate pace.
GBP/USD Aims More Upsides, Bulls In Control
Key Highlights
- GBP/USD started a fresh increase above the 1.3500 resistance zone.
- A connecting bullish trend line is forming with support at 1.3530 on the 4-hour chart.
- EUR/USD is now gaining pace and might clear the 1.1450 resistance zone.
- USD/JPY extended losses and traded below the 143.50 level.
GBP/USD Technical Analysis
The British Pound formed a base above 1.3350 and started a fresh increase against the US Dollar. EUR/USD cleared the 1.3450 resistance to enter a positive zone.
Looking at the 4-hour chart, the pair traded settled above the 1.350 level, the 100 simple moving average (red, 4-hour), and the 200 simple moving average (green, 4-hour).
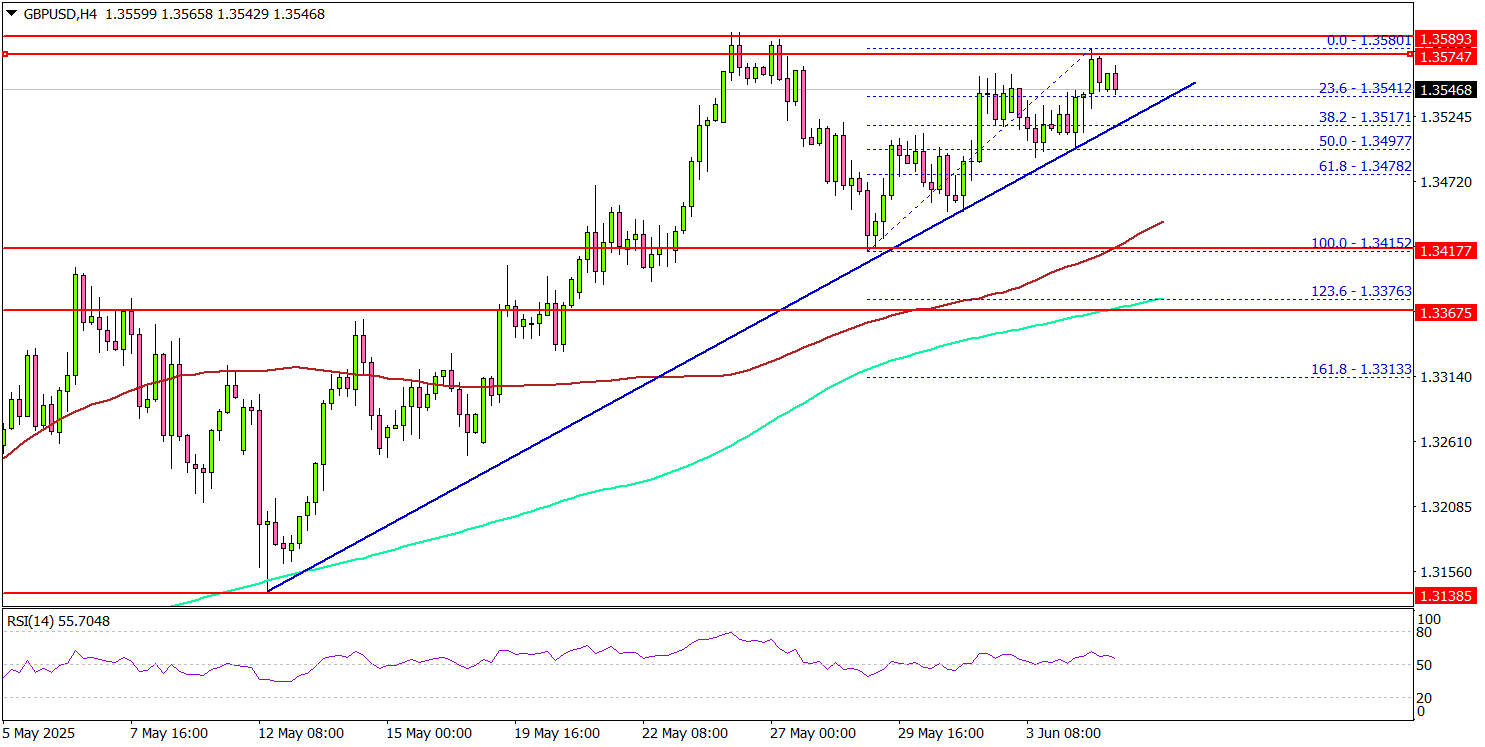
The bulls pushed the pair above the 1.3550. On the upside, the pair could face resistance near the 1.3580 level. The next key resistance sits near the 1.3620 level. The first major resistance sits at 1.3650. A close above the 1.3650 level could set the pace for another increase.
In the stated case, the pair could even clear the 1.3800 resistance. The next major stop for the bulls could be near the 1.4000 resistance.
On the downside, immediate support sits near the 1.3530 level. There is also a connecting bullish trend line forming with support at 1.3530 on the same chart. The next key support sits near 1.3480. Any more losses could send the pair toward the 1.3400 pivot level in the near term. The main support could be near 1.3350.
Looking at EUR/USD, the pair started another increase, but the bulls seem to be facing hurdles near the 1.1450 level.
Upcoming Economic Events:
- US Initial Jobless Claims - Forecast 235K, versus 240K previous.
- US Goods and Services Trade Balance for April 2025 - Forecast $-94.0B, versus $-140.5B previous.
USDJPY Elliott Wave Forecast: Bearish Trend Set to Resume
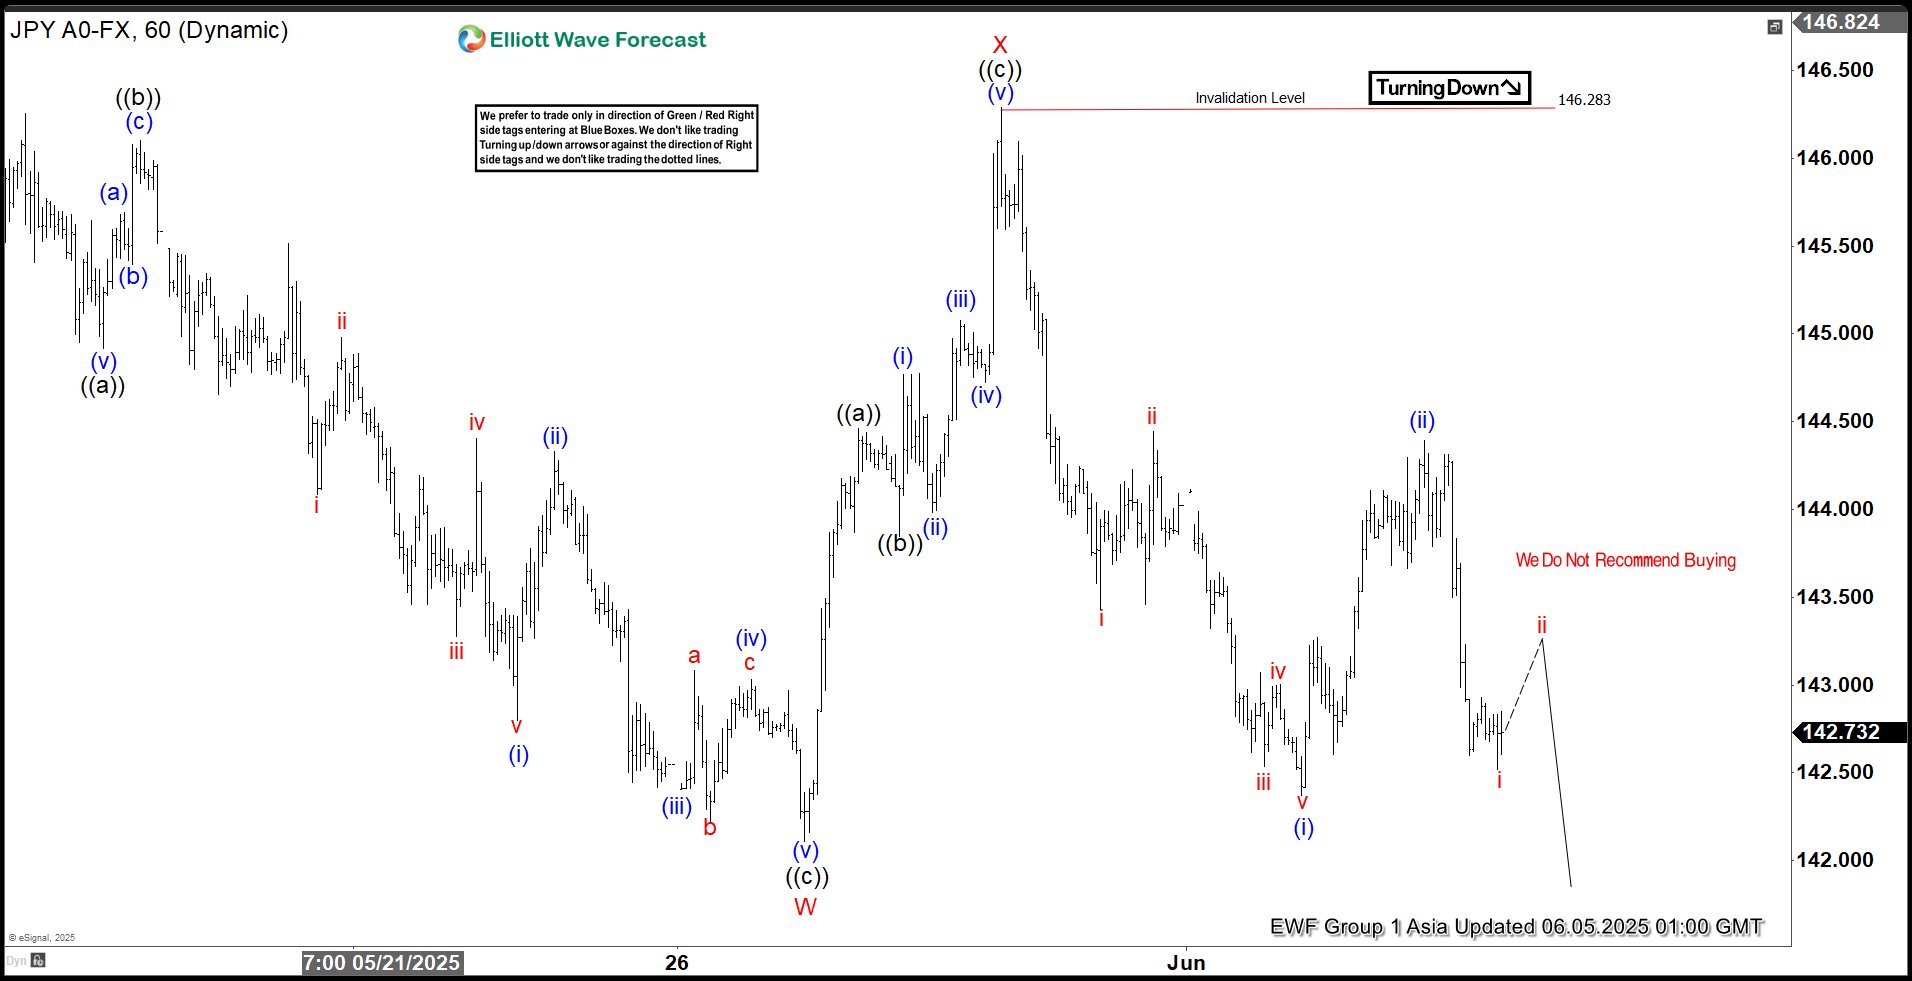
The USDJPY pair has exhibited a bearish sequence since its high on July 3, 2024, signaling potential for further downside. In the near term, the cycle from the May 13, 2025, high is unfolding as a double three Elliott Wave structure, a complex corrective pattern. From the May 13, 2025, peak, the initial decline, labeled wave ((a)), concluded at 144.91. It is then followed by a corrective bounce in wave ((b)) to 146.1. The subsequent drop, wave ((c)), completed at 142.10, finalizing the larger wave W, as illustrated on the 1-hour chart below.
Following this, the pair entered a corrective phase, wave X, structured as a zigzag. From the wave W low, wave ((a)) advanced to 144.46 and wave ((b)) pulled back to 143.84. Wave ((c)) rallied to 146.28, completing wave X in the higher degree. This zigzag correction temporarily halted the bearish momentum. The pair has now turned lower, initiating wave Y, which is also unfolding as a zigzag structure with sub-waves ((a))-((b))-((c)).
From the wave X high, wave (i) of ((a)) declined to 142.37, and the corrective wave (ii) of ((b)) reached 144.39. The pair is expected to continue lower in wave (iii) of ((a)). As long as the pivot high at 146.28 remains intact, any rally is likely to fail in a 3, 7, or 11 swing pattern, setting the stage for further declines. A break below the wave (i) low at 142.37 and the wave W low at 142.10 would reinforce the bearish sequence from the May 29 and May 13 peaks, respectively. Such a move would further confirm and validate the bearish outlook, strengthening the case for continued downside in the USDJPY pair.
USDJPY 60-Minute Elliott Wave Technical Chart
USDJPY Elliott Wave Technical Video
https://www.youtube.com/watch?v=jXvwB7XqepU
Dollar Trends Lower While Loonie Gets Dragged
The Dollar index is consolidating below the 100.00 level for the second consecutive week as Tuesday’s rally in the USD was not strong enough to hold. The DXY is trading at 98.80 and hasn’t crossed above 100 this week.
Between renewed menaces and the actual delay in implementing tariffs, US President Trump is making sure that the ongoing trend of USD selling doesn’t stall.
The announcement in the middle of last week from the US Federal Court boosted the USD initially, though the appeal of the court decision just added to more uncertainty.
Overall mixed US Data hasn't helped to add demand for the Greenback.
Manufacturing PMI and JOLTS beat while ADP Employment and Services PMI, entering into contraction, missed - everybody looking to price in cuts would focus more on the negatives, especially with 70% of the US Economy being service oriented, and the JOLTS data being a month-old (as the data released is from the past month).
Equity Indices Snapshot
US and Canadian Indices have had quite a positive week with a generally positive sentiment from Markets, also propelling Industrial Metals, Oil and traditionally more risk-on currencies like the AUD and NZD.
I would take a look at the S&P 500 for a guide to this week's appetite for buyers as we approach the 6,000 Milestone - Momentum will find a few hurdles as traders brace for the upcoming Non-Farm Payroll report on Friday 6th.
Breaking the level before the data gets released will show that markets are looking at other themes like the de-escalation of trade tensions (i.e. Taco Trump).
Still, expect a lot of volatility as all eyes are on the upcoming NFP report.
Bank of Canada June Meeting
There was the Bank of Canada rate decision this morning, the BoC held rates at 2.75% and are still waiting for more insights on the impact of US Tariff policies.
There has been a bounce in Canadian consumption and hiring, but the Central Bank would like to see more - in the meantime, there is still a cut about halfway priced in for the July meeting, which won't materialize if the data holds.
The May headline inflation report came in at 1.7%, below the 2% Target though the BoC's favourite Core CPI is still at 2.5%.
There isn't any particular citation from Macklem or Rogers to note.
US Dollar Mid-Week Performance vs Majors
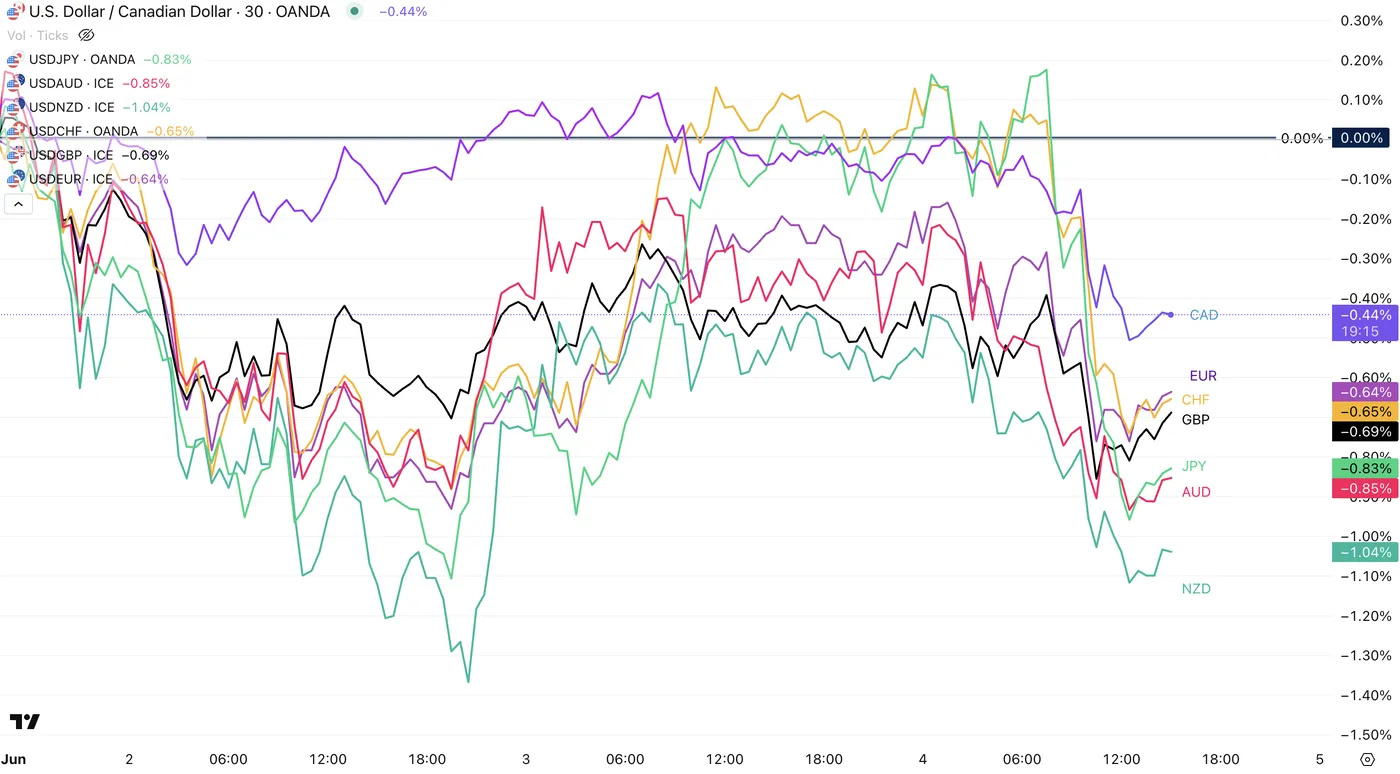
USD vs other Majors, June 4, 2025 - Source: TradingView.
The Greenback is onto another losing week, down against all majors.
There has been some particular strength from Asian-Pacific currencies, boosted from the pushback of US import tariffs on many Chinese goods all the way to August 31.
Canadian Dollar Mid-Week Performance vs Majors
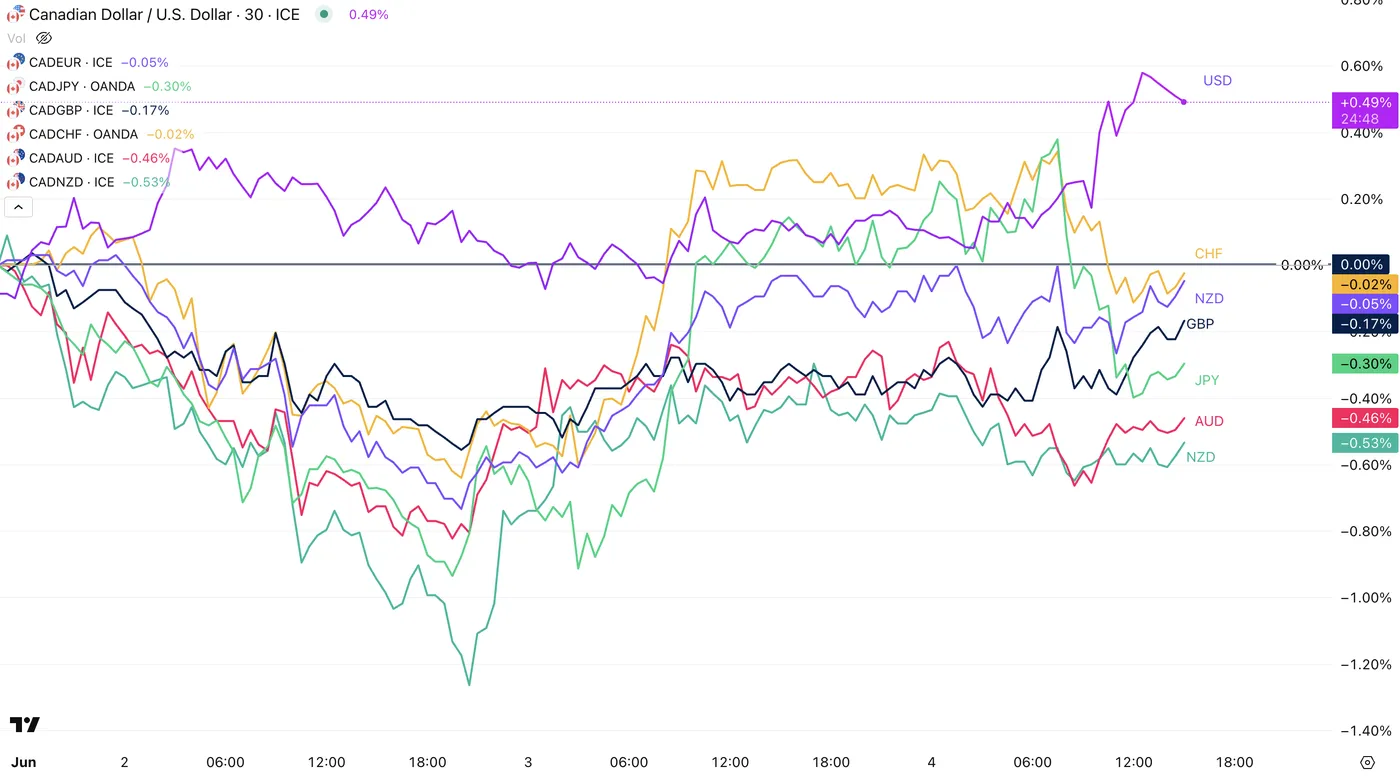
CAD vs other Majors, June 4, 2025 - Source: TradingView.
The Loonie got somewhat dragged down by the USD and is losing the most against the strong APAC currencies. The Canadian Dollar is still broadly unchanged against European Majors.
The absence of a cut this morning gives the CAD some fundamental strength, though markets will be looking at Canadian employment data coming at the same time as the NFP before moving the currency forward.
Intraday Technical Levels for the USD/CAD
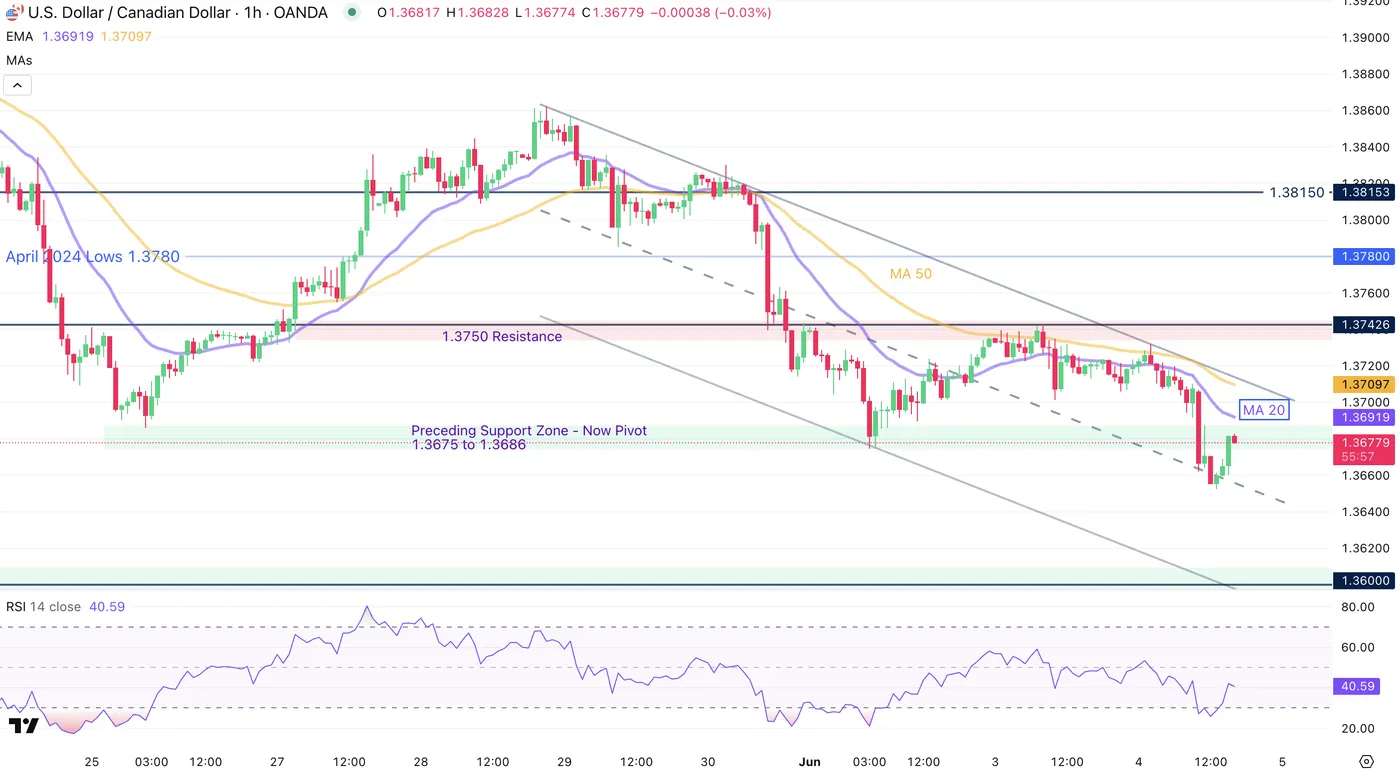
USD/CAD 1h Chart, June 4, 2025. Source: TradingView
USDCAD broke below the past week's lows and has started to form a downward channel with decent selling momentum.
Currently trading around 1.3680, there isn't much to retain the USDCAD from stabilizing below the 1.37 level and moving down further towards the 1.36 psychological level.
The hourly RSI is back to neutral from oversold and EMA 20 and 50 are acting as Resistance.
There are rumours of a trade deal coming up between the US and Canada, potentially next week.
I would focus on the current trend before the data, though do be cautious on the double Employment report on Friday.
US and Canada Economic Calendar for the Rest of the Week
As discussed before, all eyes are on the double employment report coming in on Friday at 8:30 A.M E.T.
US Non-Farm Payrolls are expected at 130K and Canada is expecting a drop of 15K.
The CAD tends to move on the Ivey PMI Data that gets released tomorrow at 10:00 A.M., therefore keep this one in check. It's expected at 48.3, already in contraction territory with last month's report at 47.9.
For the rest, a few FED Speakers with only Kugler being a voter for 2025 and the weekly Jobless Claims report coming up tomorrow.
Safe Trades!
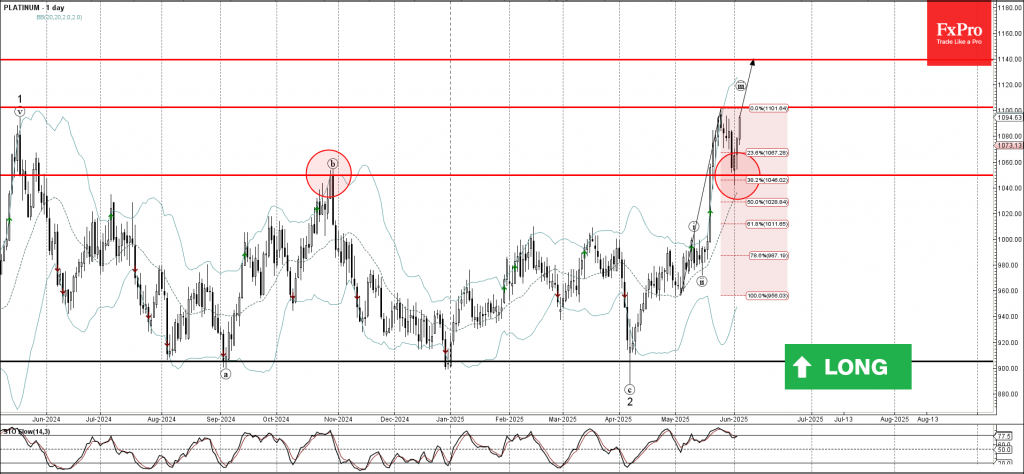
Platinum Wave Analysis
Platinum: ⬆️ Buy
- Platinum reversed from support zone
- Likely to rise to resistance level 1100.00
Platinum recently reversed up from the support zone between the support level 1050.00 (former multi-month high from October) and the 38.2% Fibonacci correction of the upward impulse from May.
The upward reversal from this support zone continues the active impulse wave iii of intermediate impulse wave 3 from April.
Platinum can be expected to rise to the next resistance level 1100.00, the breakout of which can lead to further gains toward 1140.00.
US Services PMI Dipping into Contraction – Equities Continue to Reject Highs
Consecutive misses on US data in the North-American Morning Session as the US Services PMI came in at 49.9 vs 52 expected.
Equity markets which rallied back after the miss on ADP Data, gapped right back down as Services Data, which has been holding strong throughout Hike cycles and geopolitical certainty is now showing weakness.
New Orders, deliveries, production and Employment are contracting while prices are increasing at the highest pace since November 2022.
Markets are not pleased with this news as we start to see a shift in PMI data, tariffs are starting to have an impact.
Stock Indices are turning red and the US Dollar takes a toll as the consecutive data misses blocks a third consecutive risk-on session.
The day is not over as the Bank of Canada held rates at 2.75% for the second time, and the Press conference is coming up right now.
USDCAD and USDJPY Intra-day Charts
USDCAD 30m Chart
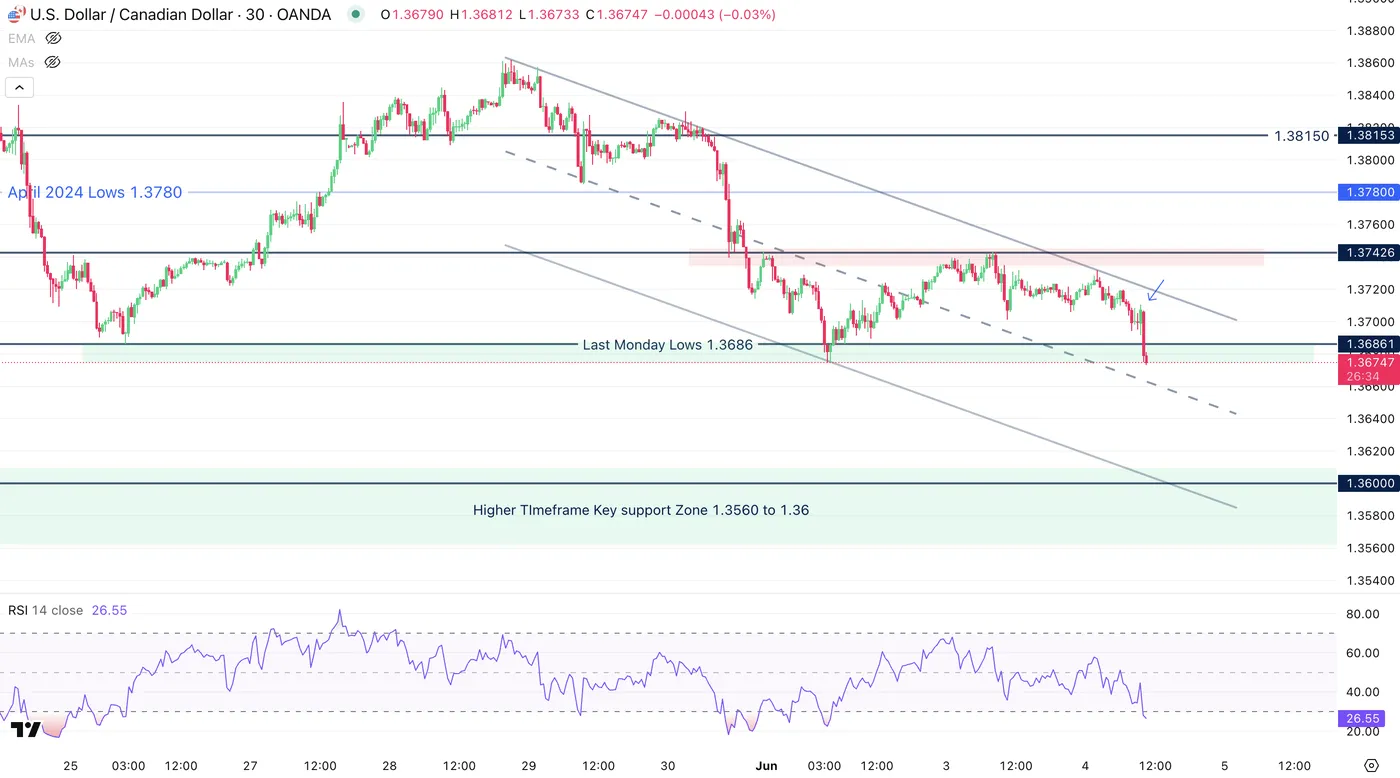
USDCAD 30M Chart, June 4, 2025. Source: TradingView
USDCAD is making new lows after the BoC stays put and US Data misses, there isn't much support before the Higher Timeframe Support Zone (1.3560 to 1.36) except for an oversold RSI.
BoC Governor Macklem is speaking live here.
USDJPY 30m Chart
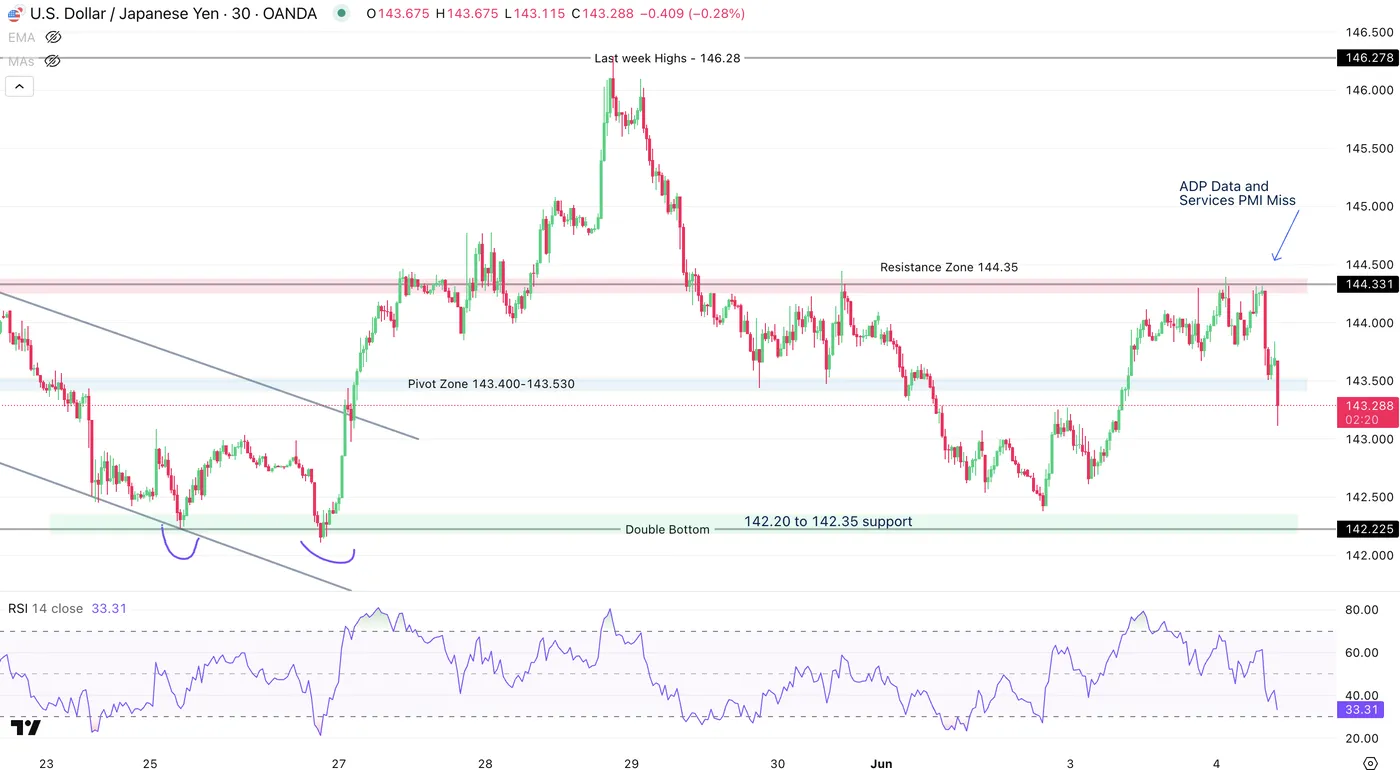
USDJPY 30M Chart, June 4, 2025. Source: TradingView
USDJPY broke through the immediate pivot zone at 143.400 to 143.530 with decent selling momentum.
RSI is also oversold though the situation is similar to the USDCAD.
Safe Trades!
US: ISM Services Index Falls into Contractionary Territory in May
The ISM Services index fell 1.7 points to 49.9 in May, coming in well below expectations for a modest improvement to 52.0. This marked the first time that the index fell into contractionary territory since June 2024. Ten of eighteen industries reported growth in May, down from eleven in April and fourteen at the start of the year.
Business activity fell 3.7 points to 50.0, while new orders fell an even sharper 5.9 points to 46.4. The backlog of orders also declined a steep 4.6 points to 43.4. Meanwhile, new exports orders remained relatively unchanged, easing only modestly to 48.5.
The employment subindex managed to improve, moving back into expansion territory after rising 1.7 points to 50.7.
The supplier deliveries index trended higher, increasing by 1.2 points to 52.5. Meanwhile, the prices paid sub-component shot up 3.6 points to 68.7 – the highest level since the end of 2022. Several survey respondents made direct references to tariffs, with one stating “Tariffs remain a challenge, as it is not clear what duties apply. The best plan is still to delay decisions to purchase where possible”.
Key Implications
Today's ISM report is disappointing, as it indicates that even the services sector is starting to feel the pinch from the uncertain trade environment. The details of this morning's report were not particularly encouraging, with steep drops reported in business activity, new orders, and the backlog of orders. The only bright spot was the improvement in the employment subindex, which indicates that despite the challenging environment, services-based businesses are still hanging on to their workers and likely doing some moderate hiring.
The fact that the ISM services index joined its manufacturing counterpart in contractionary territory is a clear sign that the tariff turmoil is rubbing off on the services sector too, with comments from survey respondents that touched on the impact of tariffs also supporting this theme. Additionally, the ongoing increase in the prices paid subindex, indicates that the inflationary pressure from tariffs is sure to make its way on the services sector too.
Bank of Canada Holds Rates Steady, Offers More Forward Guidance
The Bank of Canada (BoC) held its policy rate at 2.75% for the second consecutive announcement.
In justifying its stand-pat decision the Bank pointed to tariff uncertainty remaining high, the economy is softer, but not sharpy weaker, and there has been some unexpected firmness in inflation. In their calculus these changes netted out to keeping a wait-and-see approach in place as they wait for more information on U.S. trade policy and its impacts.
In more detail, the Bank stated that first quarter economic growth in Canada was above their expectation, but that the composition of growth was basically as expected. They also pointed out that despite softer headline inflation, their preferred measures of inflation have moved up.
Looking forward the Bank expects the economy to be "considerably weaker" in the second quarter as the strength in exports and inventories reverse, and domestic demand remains "subdued".
The forward-looking language on "proceeding carefully" and the risks they are balancing remained unchanged. However, they dropped the comment that monetary policy cannot offset the impacts of a trade war. Instead, focusing on ensuring "price stability through this period of global upheaval" and adding that they will "support economic growth while ensuring inflation remains well controlled".
Key Implications
As markets expected, the Bank of Canada left interest rates unchanged today. At its April decision the BoC said that they would proceed carefully with attention to the risks and uncertainties. Since then, the private sector shed jobs in back-to-back months, demand in the domestic economy came to a halt in the first quarter, and the housing market remains soft. However, core inflation pressures also picked up above 3%, putting the BoC in a bind. Given there isn't any more certainty on tariffs than there was in April, there was a clear consensus among Governing Council to hold policy unchanged as they gained more information.
Looking ahead though, members of Governing Council thought there could be a need for a reduction in the policy rate if the economy weakens and inflation is contained. But, that the Bank is being less forward looking than usual given the high degree of uncertainty on what the tariff picture looks like. We expect that barring a trade negotiation miracle with the Trump administration, Canada's economy is likely to tip into recession this year, and more interest rate cuts will be required.