Sample Category Title
EUR/USD: Remains Constructive Ahead of ECB – US NFP Report
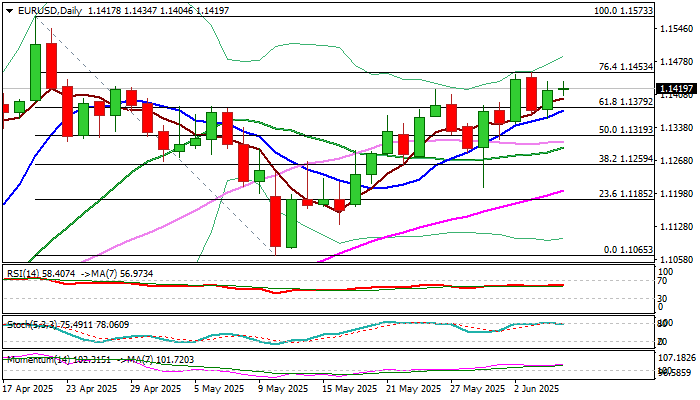
EURUSD holds in extended consolidation under new multi-week high (1.1454) but keeps firm tone that boosts prospects for further growth.
Bullish daily studies (strong positive momentum, MA’s in bullish configuration and thick daily cloud underpinning near-term action) contribute to positive outlook
Rising 10DMA tracks the price action since May 19, and offers solid support at 1.1373 (also near broken Fibo 61.8% of 1.1573/1.1065 pullback) followed by daily Tenkan-sen (1.1332) which should hold dips and keep lower trigger at 1.1286 (daily cloud top) intact.
All eyes are on today’s ECB decision and Friday’s US NFP report which would provide fresh direction signals.
The European Central Bank is widely expected to cut rates by additional 25 basis points and likely to signal pause in its year-long easing cycle until autumn.
Traders will be focusing on President Lagarde’s press conference for more details about ECB’s action in coming months.
Eurozone inflation is at CB’s target zone, however the policymakers remain cautious about potential stronger negative consequences, as escalation of trade war would fuel inflation.
On the other hand, the two recent reports from the US labor sector were mixed, as JOLTS showed stronger than expected results in May while hiring in US private sector slumped last month (ADP report).
US Nonfarm Payrolls rose by 177K in April and economists expect 130K increase in May, though some banks lowered their expectations after disappointing ADP report results that added to growing worries about unexpected NFP drop.
The US dollar is in a downward trajectory and may accelerate losses on NFP miss that would provide fresh boost to the single currency and open way for potential retest of 2025 peak (1.1573).
Res: 1.1453; 1.1473; 1.1500; 1.1547.
Sup: 1.1404; 1.1373; 1.1357; 1.1332.
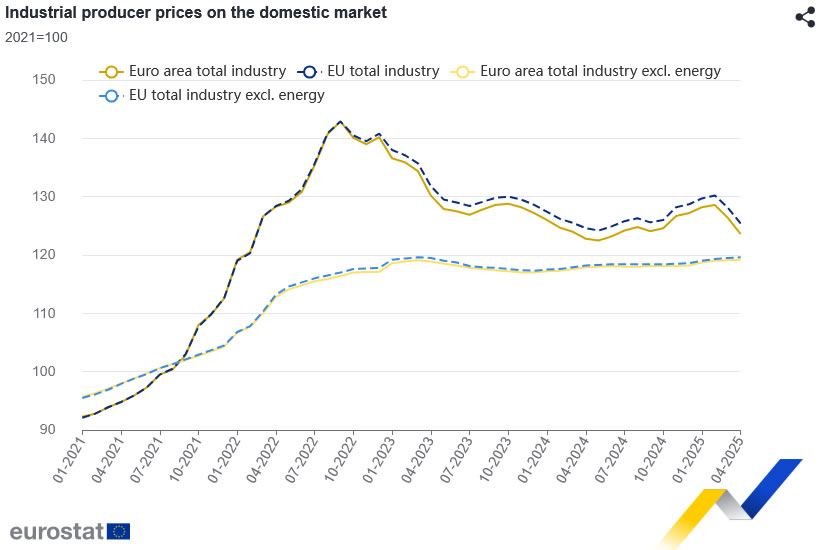
Eurozone PPI slumps -2.2% mom on energy prices
Eurozone PPI dropped sharply by -2.2% mom in April, steeper than the expected -1.8% mom. decline. Annual PPI rose just 0.7% yoy, below forecasts of 1.2% yoy. PPI ex-energy was up 0.1% mom, 1.1% yoy
The drag on Eurozone PPI was driven primarily by a -7.7% mom fall in energy prices. Prices for intermediate goods also declined slightly by -0.1% mom, while capital goods prices held flat. In contrast, consumer goods offered some offset, with durable and non-durable segments rising 0.1% mom and 0.3% mom respectively.
The broader EU showed a similar picture, with PPI falling -2.1% mom and rising just 0.6% yoy. Country-level data revealed significant monthly drops in industrial prices in France (-4.3%), Ireland (-4.0%), and Bulgaria (-4.9%). Only a handful of smaller economies like Cyprus and Malta posted slight increases.
Gold Poised for Further Gains as US Economic Outlook Deteriorates
Gold prices held firm at 3,373 USD per troy ounce on Thursday, remaining near a four-week high. The metal’s strength is being fuelled by mounting concerns over the US economic slowdown, boosting demand for non-yielding safe-haven assets.
US data signals economic distress
The latest reports revealed a contraction in the US service sector for the first time in nearly a year – an alarming sign of broader weakness.
Additionally, the ADP employment report indicated a notable slowdown in private-sector hiring. In May, only 37,000 new jobs were added, far below the expected 111,000 and lower than April’s figure of 60,000.
These weak indicators have bolstered expectations that the Federal Reserve will cut interest rates at least twice this year. Such prospects typically favour gold, as the metal becomes more attractive in a low-rate environment.
Despite Donald Trump’s repeated calls for rate cuts, Fed officials remain cautious, especially in light of persistent trade risks and volatile global conditions.
Attention now shifts to the US non-farm payrolls report, due on Friday, which could provide further clarity on the Fed’s policy path.
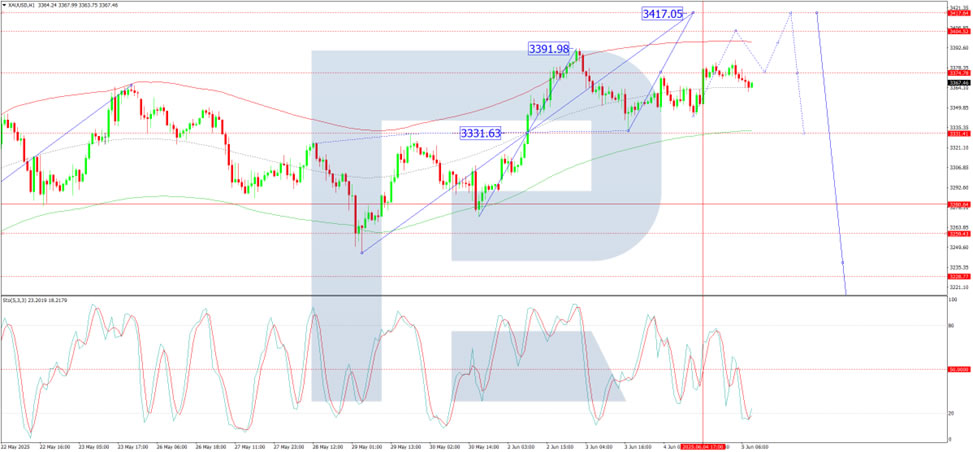
Technical analysis of XAU/USD
On the H4 chart, gold is forming the fifth wave of growth, targeting 3,415 USD. The entire structure is viewed as a corrective phase following the previous decline. Once this wave is complete, a new downtrend towards 3,060 USD is anticipated. The MACD indicator supports this scenario, with its signal line above zero and pointing sharply upwards, indicating continued bullish momentum for now.
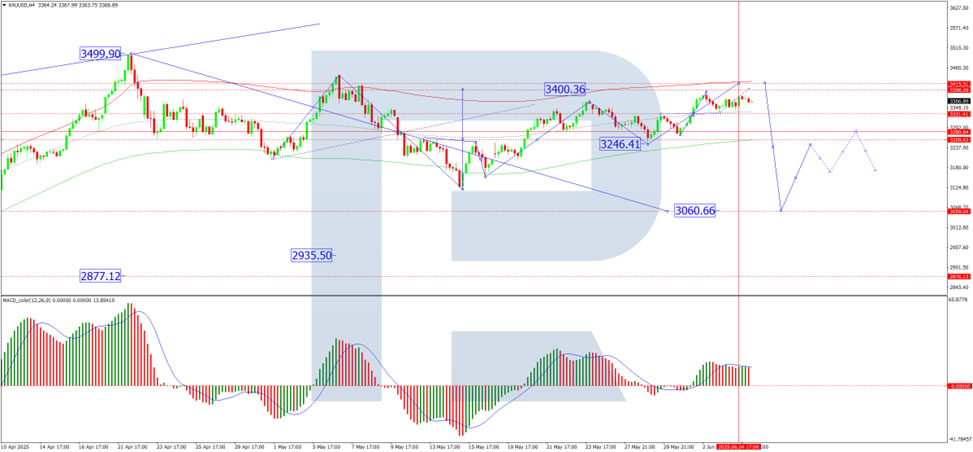
On the H1 chart, gold formed a consolidation range around 3,331 USD, then broke out upwards, reaching the local target of 3,391 USD. A correction to 3,333 USD has already played out. Currently, the market is developing the final leg of the fifth wave towards 3,417 USD, with a compact consolidation zone forming around 3,374 USD. If gold breaks upwards, the next resistance will be at 3,404 USD, followed by a pullback to 3,374 USD, and then further growth to the 3,417 USD target. The Stochastic oscillator confirms this scenario, with its signal line below 20 and moving sharply upwards towards 80, signalling the potential for near-term upward continuation.
Conclusion
Gold remains well-supported by deteriorating US economic data and expectations of monetary easing by the Fed. As long as concerns over employment, services activity, and trade uncertainty persist, gold’s upward momentum is likely to continue. Key technical levels include support at 3,333 USD and resistance at 3,404-3,417 USD, with broader downside risk emerging only after the current bullish wave concludes.
USD/JPY Analysis: Bears Put Pressure on Key Support
As shown on the USD/JPY chart, the pair is hovering near key support at ¥142.50 per US dollar.
While demand was strong enough at the end of May to lift the exchange rate from this level to a peak around ¥146.00, USD/JPY has once again retreated to the ¥142.50 area.
Why has USD/JPY declined?
On one hand, the US dollar has weakened following disappointing economic data released yesterday. The figures revealed a sharp slowdown in private sector hiring and an unexpected contraction in the US services sector, fuelling concerns over a possible recession.
On the other hand, yen strength is being driven by the Bank of Japan's apparent willingness to raise interest rates — reaffirmed on Tuesday by Governor Kazuo Ueda — which has reinforced expectations of a tightening cycle.
USD/JPY Technical Analysis
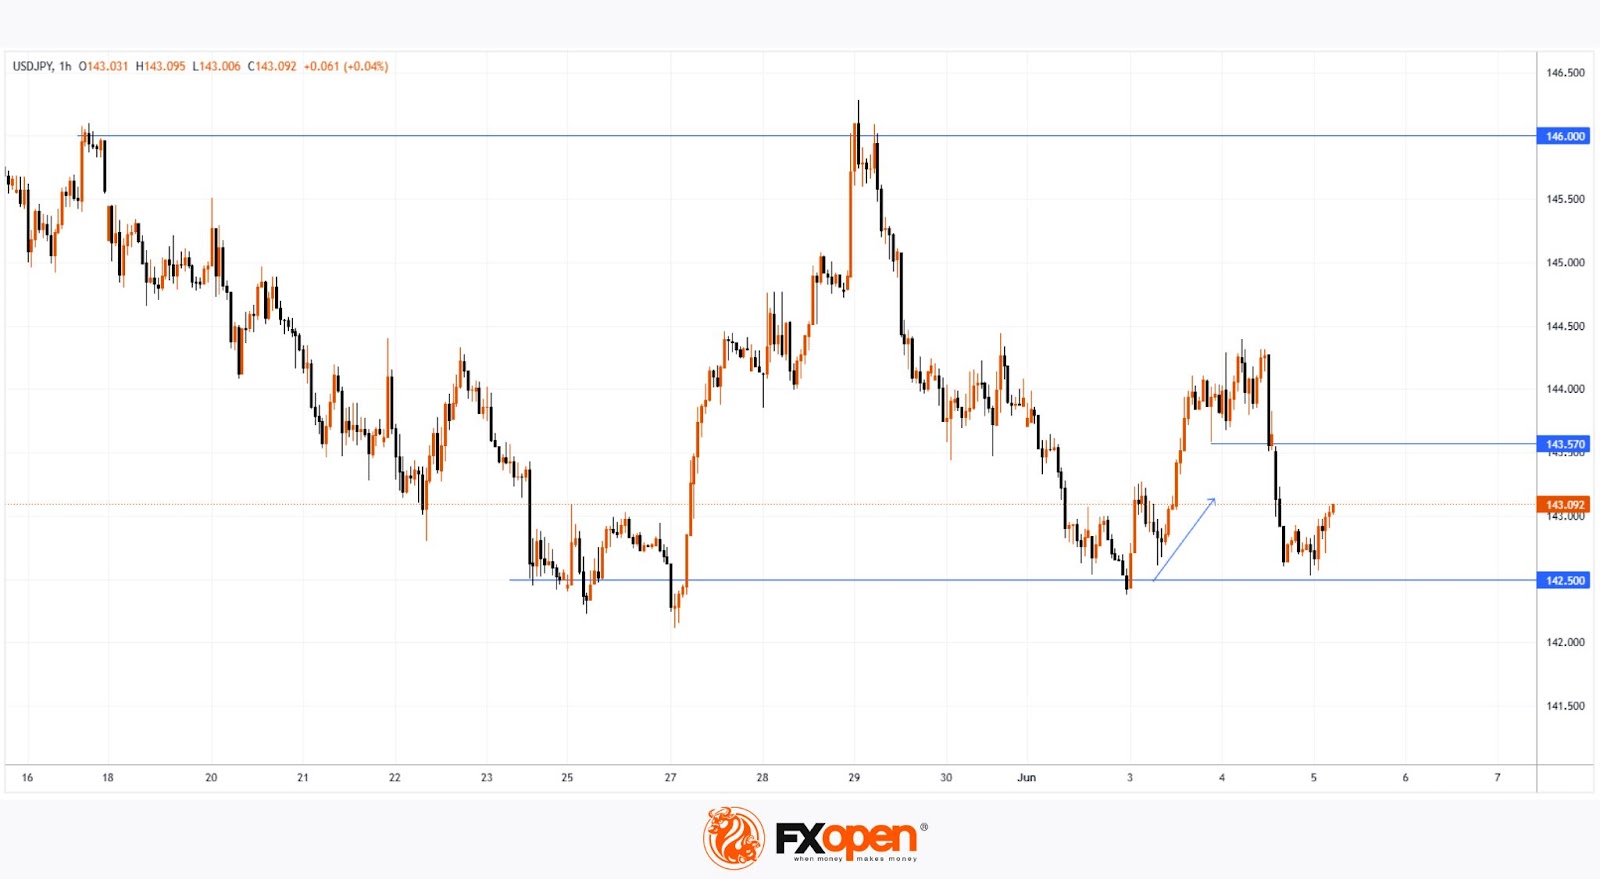
In early June, the ¥142.50 level had already shown its role as support (as indicated by the arrow), but it is once again under pressure — a sign of bearish dominance.
Yesterday, sellers broke through local support at ¥143.57, which may now act as resistance.
More US economic data is due on Friday, with key labour market figures set to be released at 15:30 GMT+3. These could potentially trigger a bearish attempt to break below the ¥142.50 level on the USD/JPY chart.
Trade over 50 forex markets 24 hours a day with FXOpen. Take advantage of low commissions, deep liquidity, and spreads from 0.0 pips. Open your FXOpen account now or learn more about trading forex with FXOpen.
This article represents the opinion of the Companies operating under the FXOpen brand only. It is not to be construed as an offer, solicitation, or recommendation with respect to products and services provided by the Companies operating under the FXOpen brand, nor is it to be considered financial advice.
GBP/JPY Daily Outlook
Daily Pivots: (S1) 192.86; (P) 194.05; (R1) 194.66; More...
Intraday bias in GBP/JPY remains neutral at this point. Further rise is in favor as long as 191.86 support holds. Firm break of 196.38 will resume whole rally from 184.35. However, firm break of 191.86 will indicate near term reversal and turn bias back to the downside.

In the bigger picture, price actions from 208.09 are seen as a correction to rally from 123.94 (2020 low). Strong support should be seen from 38.2% retracement of 123.94 to 208.09 at 175.94 to contain downside. However, sustained break of 175.94 will bring deeper fall even still as a correction.
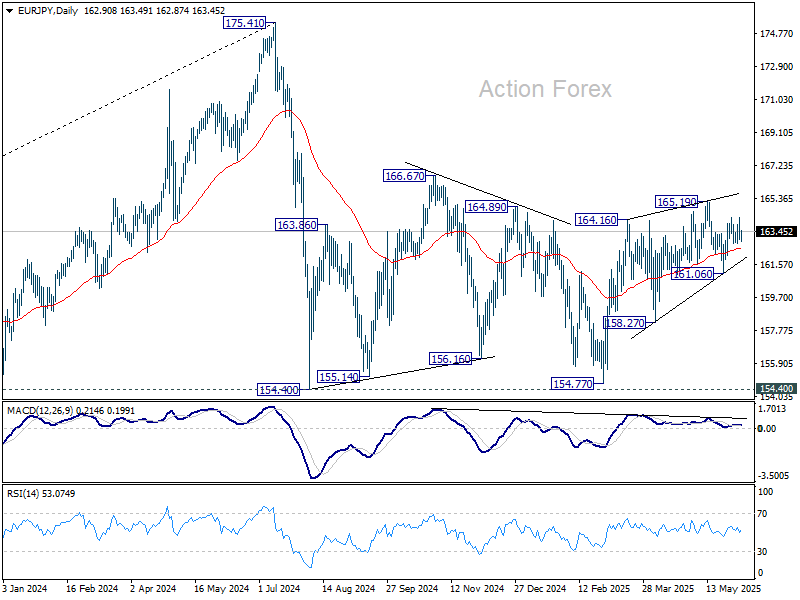
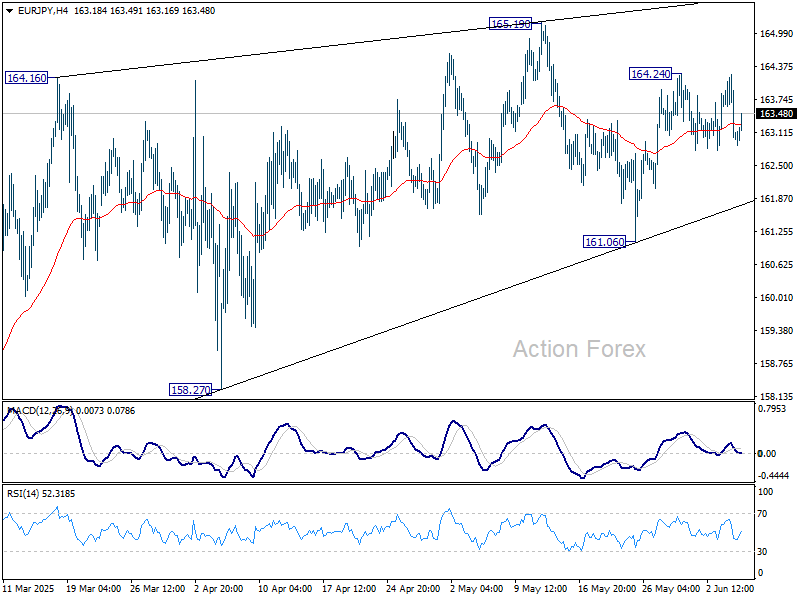
EUR/JPY Daily Outlook
Daily Pivots: (S1) 162.57; (P) 163.41; (R1) 163.84; More...
Intraday bias in EUR/JPY stays neutral at this point. On the upside, above 164.24 will bring retest of 165.19 resistance first. Firm break there will resume while rise from 154.77 to 166.67 resistance. On the downside, however, break of 161.06 will resume the decline from 165.19 instead.
In the bigger picture, price actions from 175.41 are seen as correction to rally from 114.42 (2020 low). Strong support should be seen from 38.2% retracement of 114.42 to 175.41 at 152.11 to contain downside. However, sustained break of 152.11 will bring deeper fall even still as a correction.

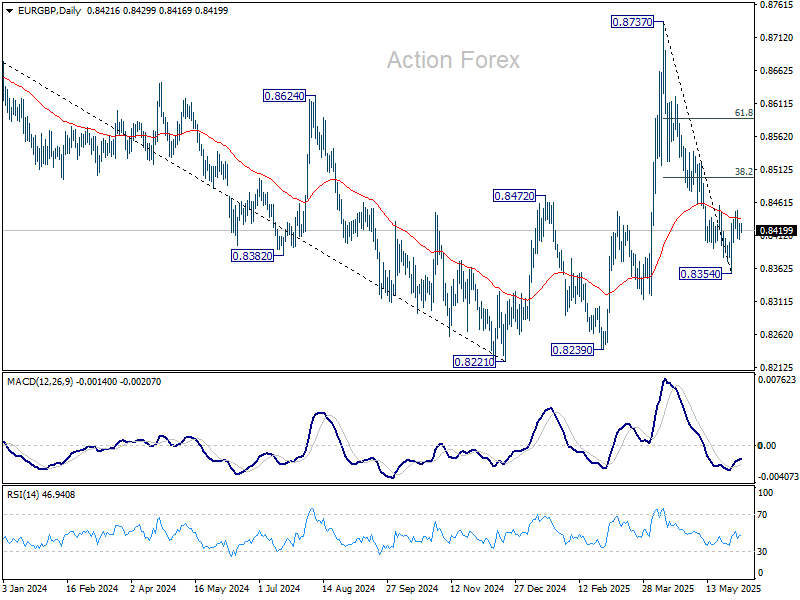
EUR/GBP Daily Outlook
Daily Pivots: (S1) 0.8411; (P) 0.8421; (R1) 0.8436; More...
Intraday bias in EUR/GBP remains neutral for the moment. On the upside, above 0.8448 will resume the rebound to 38.2% retracement of 0.8737 to 0.8354 at 0.8500. On the downside, however, break of 0.8401 minor support will bring retest of 0.8354 low.
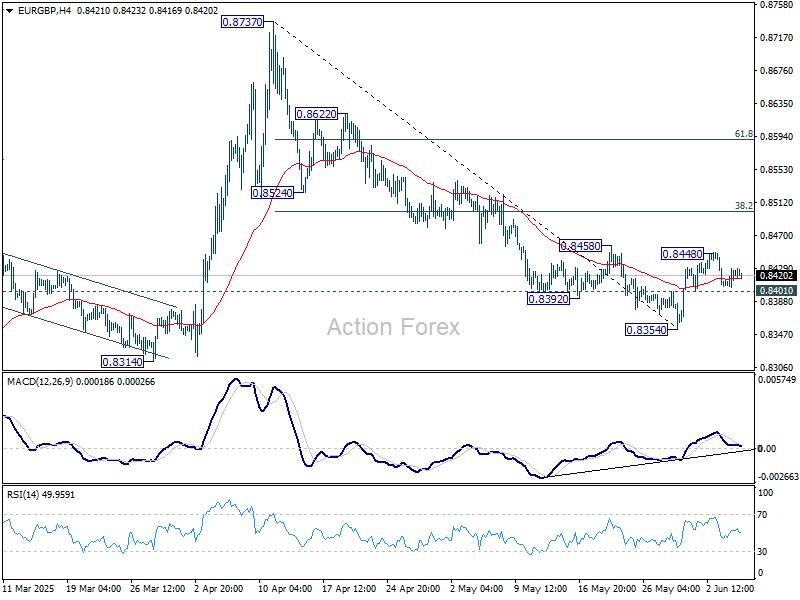
In the bigger picture, price actions from 0.8221 medium term bottom are merely forming a corrective pattern. There is no clear momentum to break through 0.8201 key support (2022 low) yet. Hence, range trading is expected between 0.8221/8737 for now.
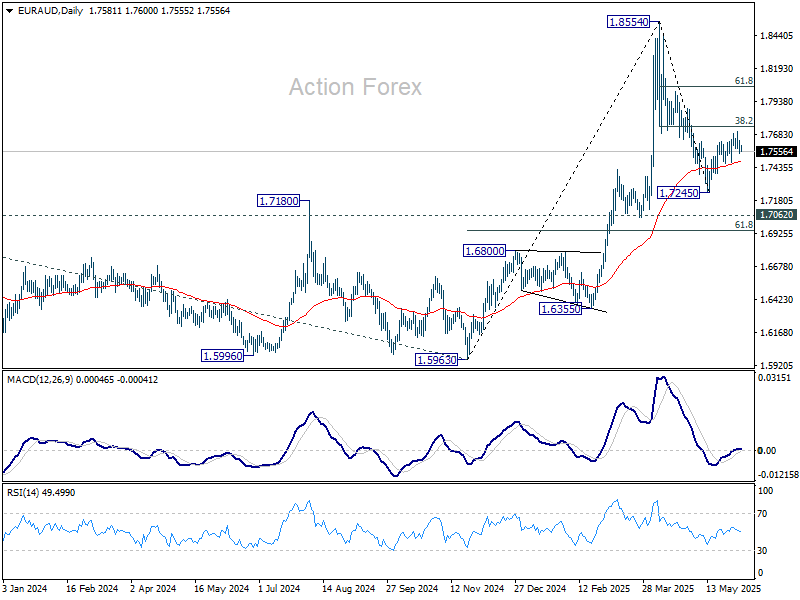
EUR/AUD Daily Outlook
Daily Pivots: (S1) 1.7541; (P) 1.7590; (R1) 1.7637; More...
Intraday bias in EUR/AUD remains neutral. On the upside, firm break of 38.2% retracement of 1.8554 to 1.7245 at 1.7745 will solidify the case that fall from 1.8554 has completed as a correction. Next target is 61.8% retracement at 1.8054. On the downside, however, break of 1.7460 support will bring retest of 1.7245 instead.
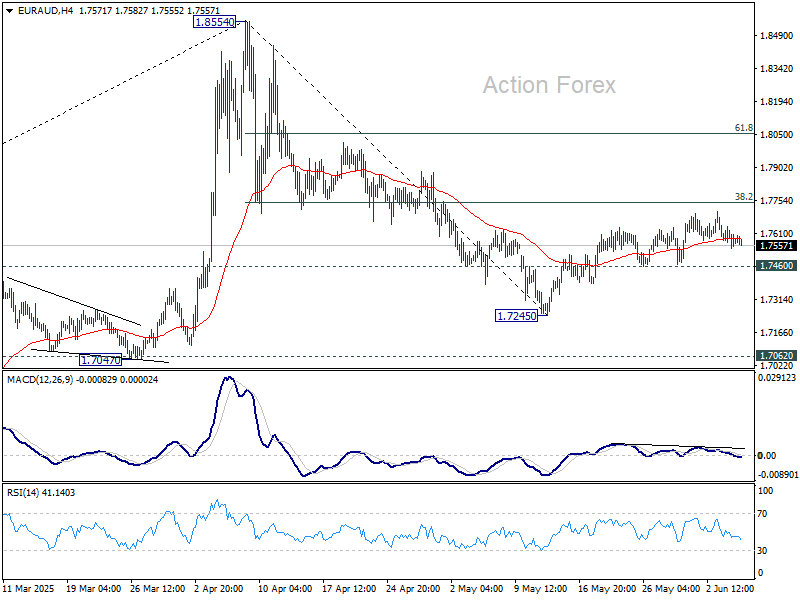
In the bigger picture, as long as 1.7062 resistance turned support (2023 high) holds, up trend from 1.4281 (2022 low) should still be in progress. Break of 1.8554 is expected after the whole corrective pattern from there completes. However, sustained break of 1.7062 will bring deeper fall back to 1.5963 support.
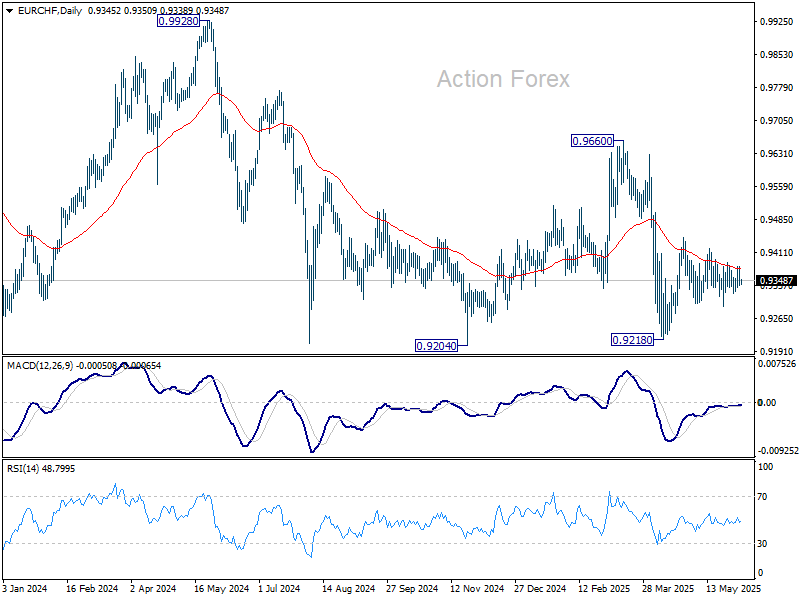
EUR/CHF Daily Outlook
Daily Pivots: (S1) 0.9329; (P) 0.9355; (R1) 0.9371; More....
Intraday bias in EUR/CHF remains neutral. Rise from 0.9218 might continue, either as a correction to fall from 0.9660, or the third leg of the pattern from 0.9204. On the upside, above 0.9419 will target 0.9445 resistance and above. Nevertheless, on the downside, firm break of 0.9291 will bring retest of 0.9218 low.
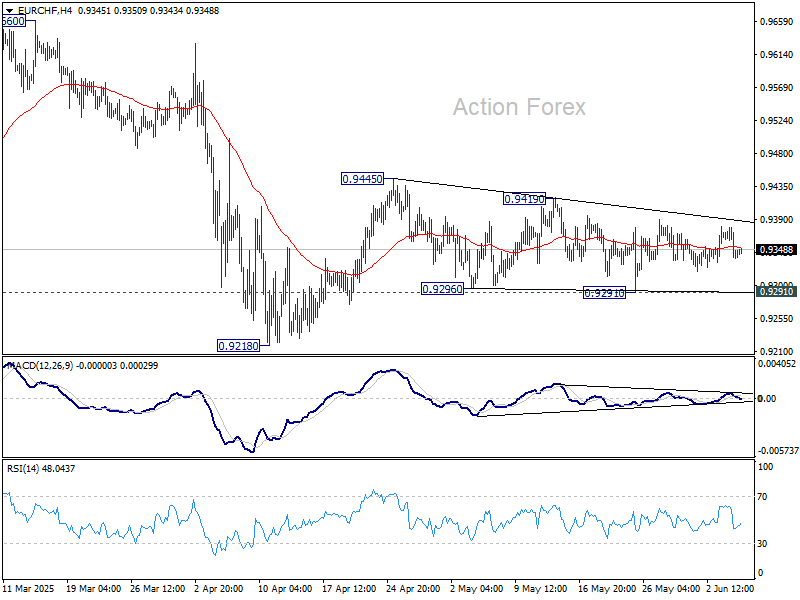
In the bigger picture, prior rejection by long-term falling channel resistance (now at 0.9527) retains medium term bearishness. That is, down trend from 1.2004 (2018 high) is still in progress. Firm break of 0.9204 (2024 low) will confirm resumption. This will remain the favored case as long as 0.9660 resistance holds.
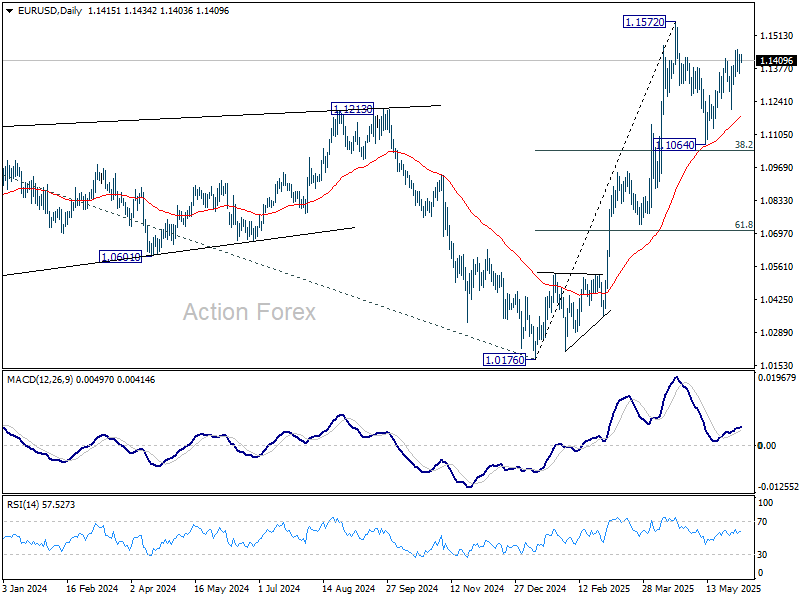
EUR/USD Daily Outlook
Daily Pivots: (S1) 1.1371; (P) 1.1403; (R1) 1.1449; More...
Intraday bias in EUR/USD remains neutral for the moment. Rebound from 1.1064 could extend higher, but strong resistance should be seen from 1.1572 to limit upside, at least on first attempt. On the downside, break of 1.1209 support will indicate that the corrective pattern from 1.1572 has started the third leg, and target 1.1064 support.
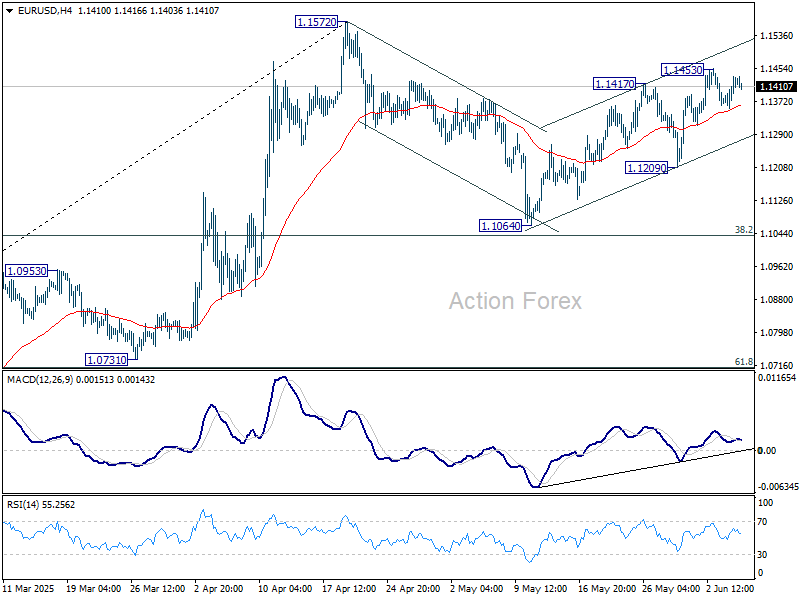
In the bigger picture, rise from 0.9534 long term bottom could be correcting the multi-decade downtrend or the start of a long term up trend. In either case, further rise should be seen to 100% projection of 0.9534 to 1.1274 from 1.0176 at 1.1916. This will now remain the favored case as long as 55 W EMA (now at 1.0856) holds.