
Sample Category Title
US NFP: Muted Hiring or Major Miss?
Markets are awaiting today’s US non-farm payrolls release, with little doubt that hiring had slowed meaningfully in May amid heightened tariff threats and elevated uncertainty. The key question now is just how sharp the slowdown was.
Consensus forecasts see NFP at 130K, unemployment steady at 4.2%, and average hourly earnings rising 0.3% mom. Recent labor indicators have painted a dismal picture. ADP private employment came in at just 37k, a stark miss. ISM Manufacturing employment stayed subdued at 46.8 and the Services component barely rose back into expansion territory at 50.7. Meanwhile, 4-week average of jobless claims has crept up to 235k.
While a modest softening in job growth would likely be tolerated as a natural response to macro headwinds, any significant downside surprise could reignite recession fears. An NFP reading below 100K could provoke a sharp risk-off response in equities. However, such a result would likely weigh further on Dollar, as markets would begin pricing in earlier Fed rate cuts in response to labor market deterioration.
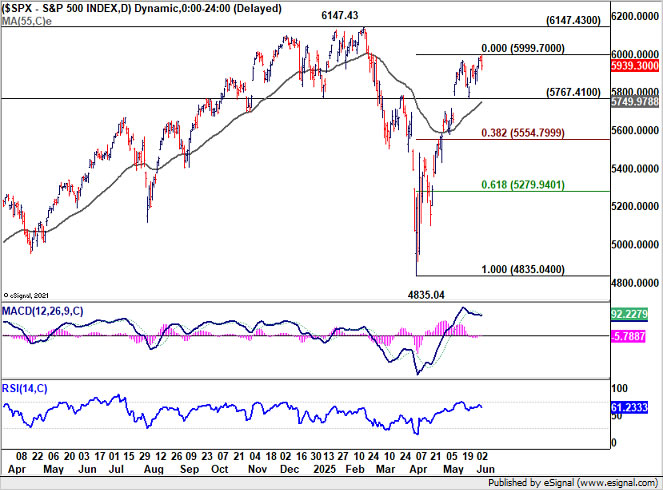
Technically, S&P 500 extended the near term rise from 4835.04 this week, but continued to lose upside momentum as seen in D MACD. This rise is seen as the second leg of the corrective pattern from 6147.43. Hence, while further rise cannot be ruled out, given that S&P 500 is now close to 6000, upside potential is limited. On the other hand, break of 5767.41 support will signal that a short term top was already formed. Deeper pull back should be seen back to 38.2% retracement of 4835.04 to 5999.70 at 5554.79, with risk of bearish reversal.
Fed’s Schmid: Tariff impact uncertain, policy must stay nimble
Kansas City Fed President Jeff Schmid acknowledged in a speech overnight that monetary theory may suggest to "looking through a one-time price shock", he would be "uncomfortable staking the Fed’s reputation and credibility on theory alone."
Despite the expected drag from tariffs, Schmid remains “optimistic” about the economy’s momentum. However, he acknowledged that both the inflationary and growth implications of tariffs are highly uncertain.
As a result, he argued that Fed will "need to remain nimble", and be prepared to adjust its stance as needed to maintain both price stability and maximum employment.
Fed’s Kugler: Tariffs may entrench inflation via expectations, pricing power, and productivity
Fed Governor Adriana Kugler cautioned that disinflation "has slowed" and that tariffs are beginning to exert upward pressure on prices, a trend she expects to continue into 2025. Speaking overnight, Kugler emphasized that the balance of risks has tilted, with “greater upside risks to inflation” now emerging, even as downside risks to employment and growth loom on the horizon. As a result, she reaffirmed support for holding the current policy rate steady.
Kugler outlined three channels through which tariffs could entrench inflationary pressures. First, she noted that rising short-term inflation expectations may grant businesses "more leeway to raise prices", thereby increasing inflation persistence.
Second, she flagged the risk of "opportunistic pricing", where firms use tariff headlines as cover to hike prices even on unaffected goods. This, combined with higher costs on intermediate goods, could generate "second-round effects" on inflation.
The third concern relates to "lower productivity". As firms contend with elevated input costs and weaker demand, they may reduce capital investment and resort to less efficient production methods, reinforcing inflationary pressure through lower productivity.
Bitcoin Wave Analysis
Bitcoin: ⬇️ Sell
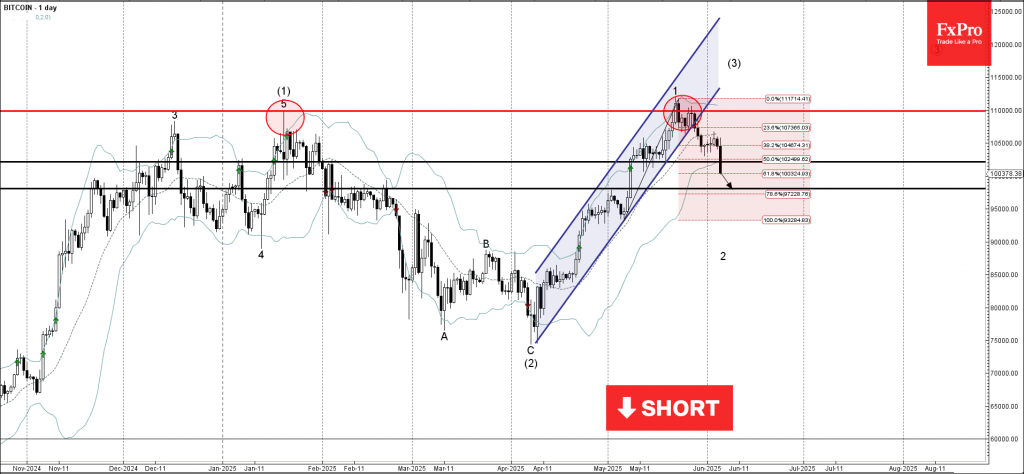
- Bitcoin broke support zone
- Likely to fall to support level 98,000.00
Bitcoin cryptocurrency recently broke the support zone located between the key support level 102150.00 (which reversed the price multiple times from the start of May) and the 50% Fibonacci correction of the upward impulse from last month.
The breakout of this support zone accelerated the active short-term ABC correction 2, which started earlier from the major multi-month resistance level 110,000.00.
Bitcoin cryptocurrency can be expected to fall to the next support level 98,000.00 (former strong resistance from February).
Is It Ethereum’s Time Again? ETH and ETH/BTC Technical Outlook
Ethereum had a rough beginning of 2025—failing to reach new all-time highs, while Bitcoin smashed through its own ATH multiple times. Solana, providing a cheaper alternative to ETH services, also held stronger than the Ether throughout the latter part of 2024 and beginning 2025.
ETH performance is key to the overall crypto market performance; the past Altcoin cycles have always been led by ETH performance over BTC.
ETH/BTC is a great cryptocurrency spread for a crypto trader to spot relative performance, provide a direction for which crypto to choose, and track the appetite for altcoins.
Through this Crypto Market Update, you will see how ETH/BTC rising helped altcoin bull-runs in the past cycle, something that many crypto traders have been awaiting and is yet to materialize again.
ETH/BTC and its Correlation to total Market Performance
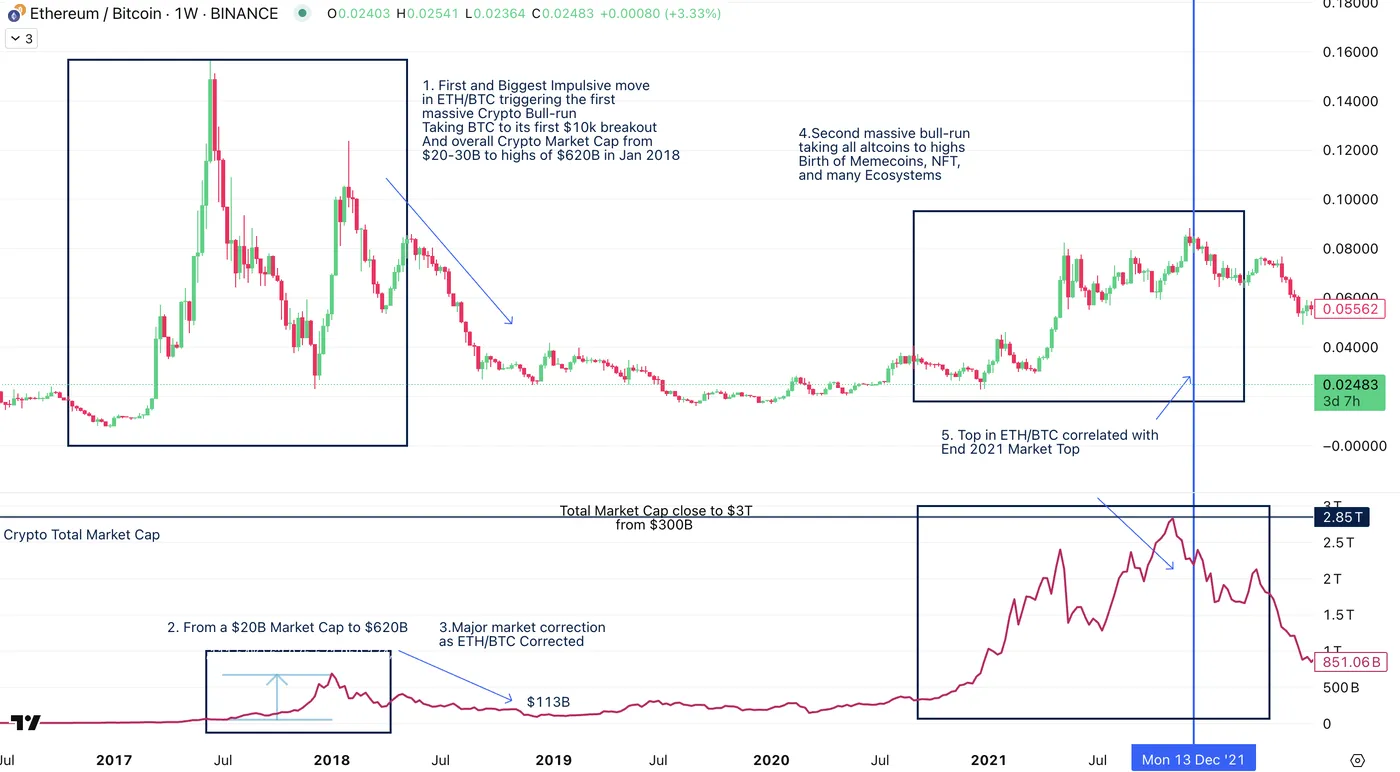
ETH/BTC and Total Crypto Market Cap, 2017 to End 2021 - Source: TradingView
This 2017 to 2021 chart of ETH/BTC contains essential information about understanding the Crypto Market.
Through 1 and 2 we observe how the first bull run in ETH and ETH/BTC led to the 2017 Total Crypto Market bull run - taking the Market Cap from $20B-$30B average to highs of $620B in November 2017.
Number 3 on the chart shows how a drop in ETH/BTC leads to a significant cool down of the Crypto Market, going back towards a total market cap between $100 to $250B from 2018 to the end of 2020.
From end 2020 to the end of 2021, number 4 shows the same correlation of ETH/BTC and Crypto markets rallying.
This Covid-Era bull run introduced crypto for an ever-bigger number of investors, and led to the flurry of altcoins and cryptocurrency projects such as Doge, Avax, Solana. The Crypto Market cap went from $300B to $2.86T, this level only got reached again in November 2024.
Finally, number 5 shows similarly to number 3 how the drop in Market Cap correlates with a drop in the ETH/BTC spread.
ETH/BTC from 2020 to Today
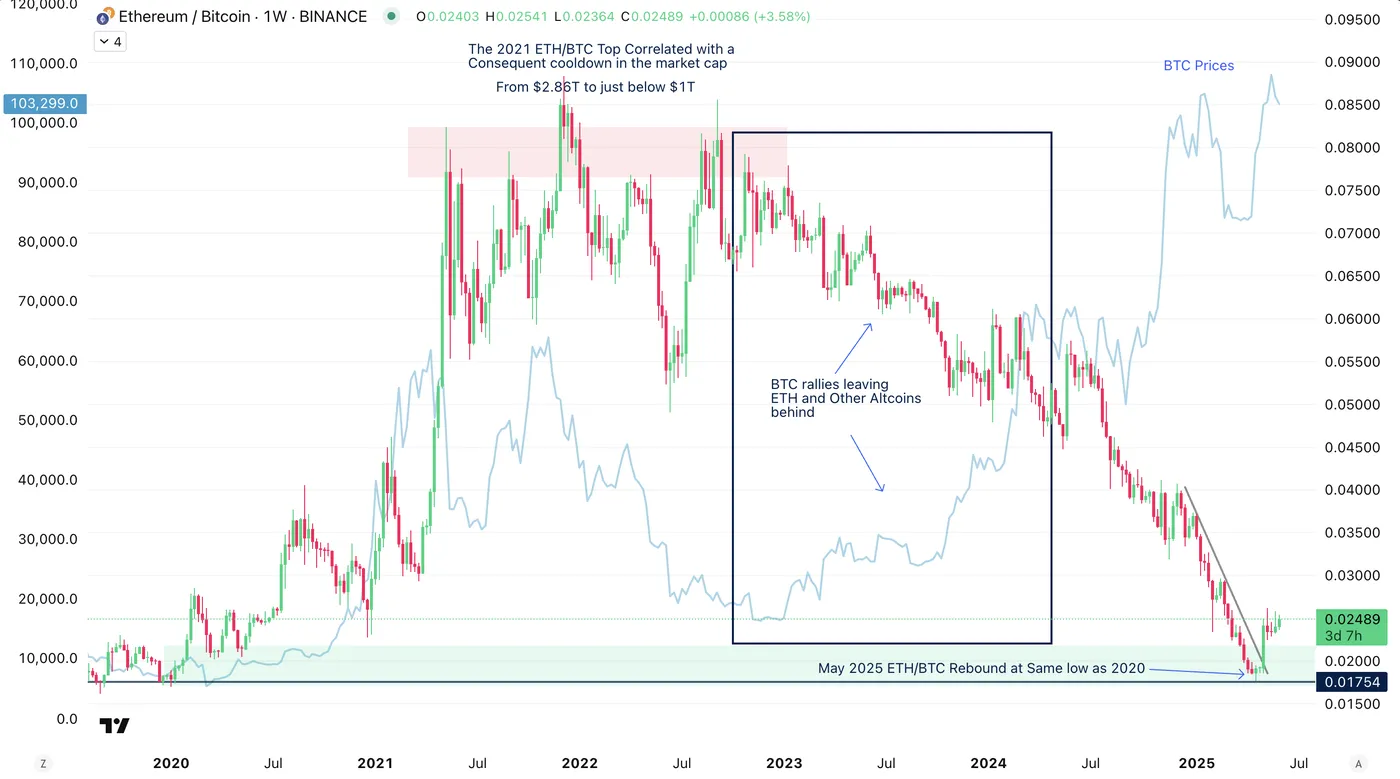
ETH/BTC and Bitcoin, 2020 to June 5, 2025 - Source: TradingView
We take a closer look at the 2021 Bull Run and how the December 2021 top in ETH/BTC led again a significant correction in the Crypto Market.
2023 was all about Bitcoin Dominance as its rally from $14,475 to its record highs of $112,030 left Ethereum and all other altcoins lagging.
We are seeing a breakout from the descent that started at the same level as the 2020 ETH/BTC bullish breakout - we will see if the spread continues upward and if it generates another Bull Run for altcoins.
ETH Daily Chart
ETH Daily Chart, June 5, 2025 - Source: TradingView
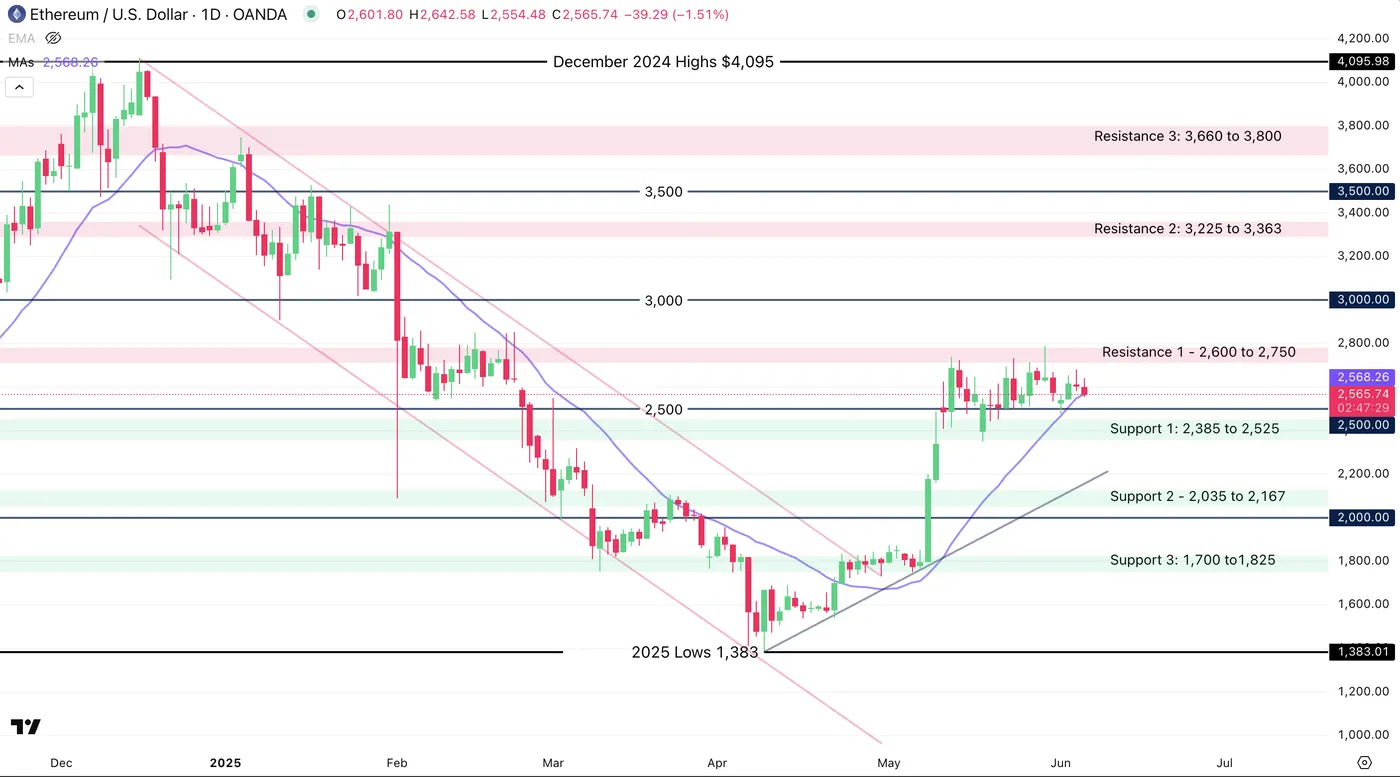
ETH had a consequent rally after a significant drop between $4,000 highs in December 2024 to $1,363 lows in April 2025.
Prices are consolidating between $2,300 and $2,600 - The key is to see if Bitcoin prices that are also stagnating above the $100,000 Mark leads to rallies in other cryptos as the same phenomenon happened in past bull cycles.
Levels to watch:
Support Zones:
- S1: 2,385 to 2,525
- S2: 2,035 to 2,167
- S3: 1,700 to 1,825
Resistance Zones:
- R1: 2,600 to 2,750
- R2: 3,225 to 3,363
- R3: 3,660 to 3,800
ETH 4H Chart
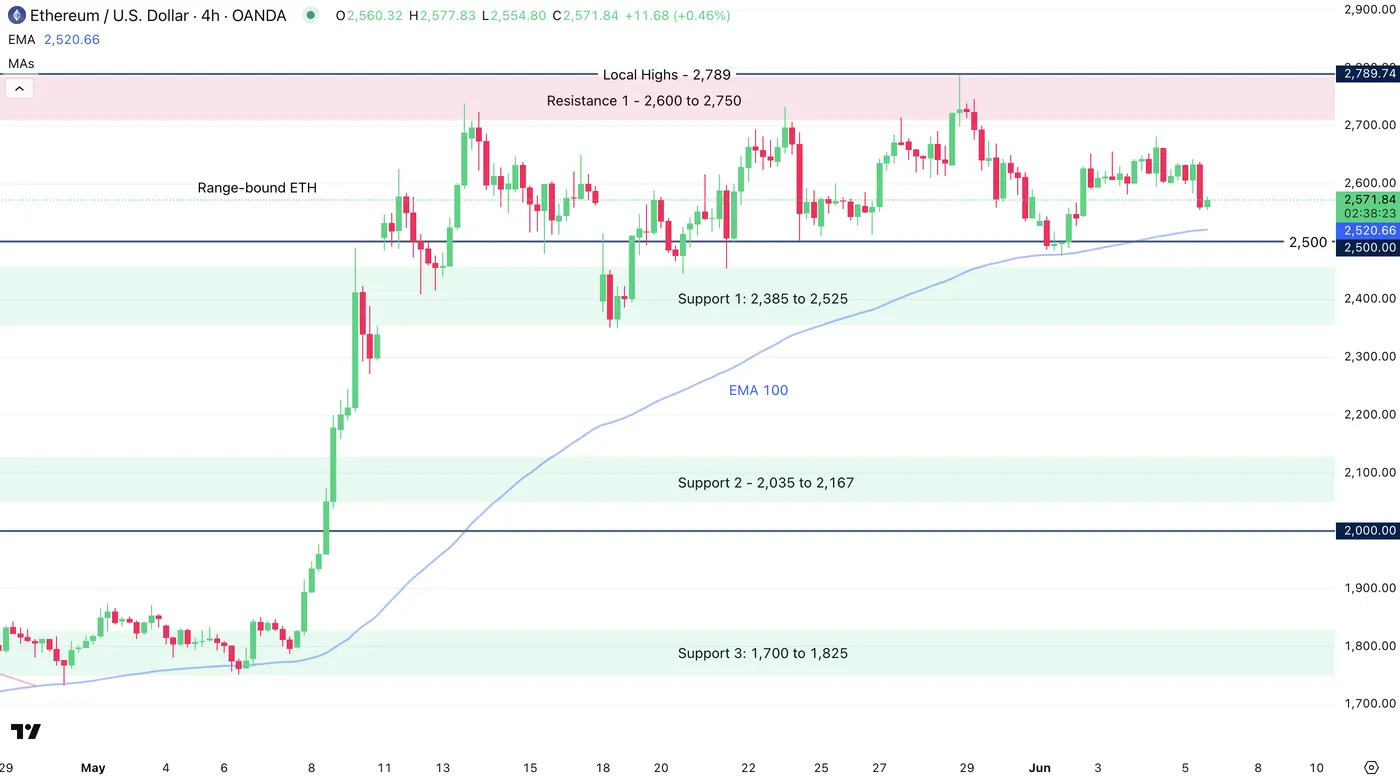
ETH 4H Chart, June 5, 2025 - Source: TradingView
Safe Trades!
Trump and Xi Jinping Conclude Their Highly Anticipated Call, Markets Rally
US-China trade tensions keep abating as the leaders from the two most powerful nations conclude their talk.
Both expressed positive comments on their own media outlets as Xi Jinping and Donald Trump hang up after a 1 and a half hour long call.
Donald Trump expressed on his Truth Social media that the call "resulted in a very positive conclusion for both countries. [...] The conversation was focused almost entirely on trade".
Xi Jinping expressed on the CCTV that they agreed to start a new round of talks and that both the US and China should increase cooperation on their economy, reduce misunderstandings.
Both Xi and Trump invited each other for an encounter though the location has yet to be disclosed - it though seems that Xi is reluctant to go to the United States.
Markets had been on a risk-on sentiment in the anticipation of the conversation from the leaders of the biggest nations, and still found material to rally on - the USD and Equities, particularly the Nasdaq are rallying on the headlines
Nasdaq 100 Intra-Day Chart
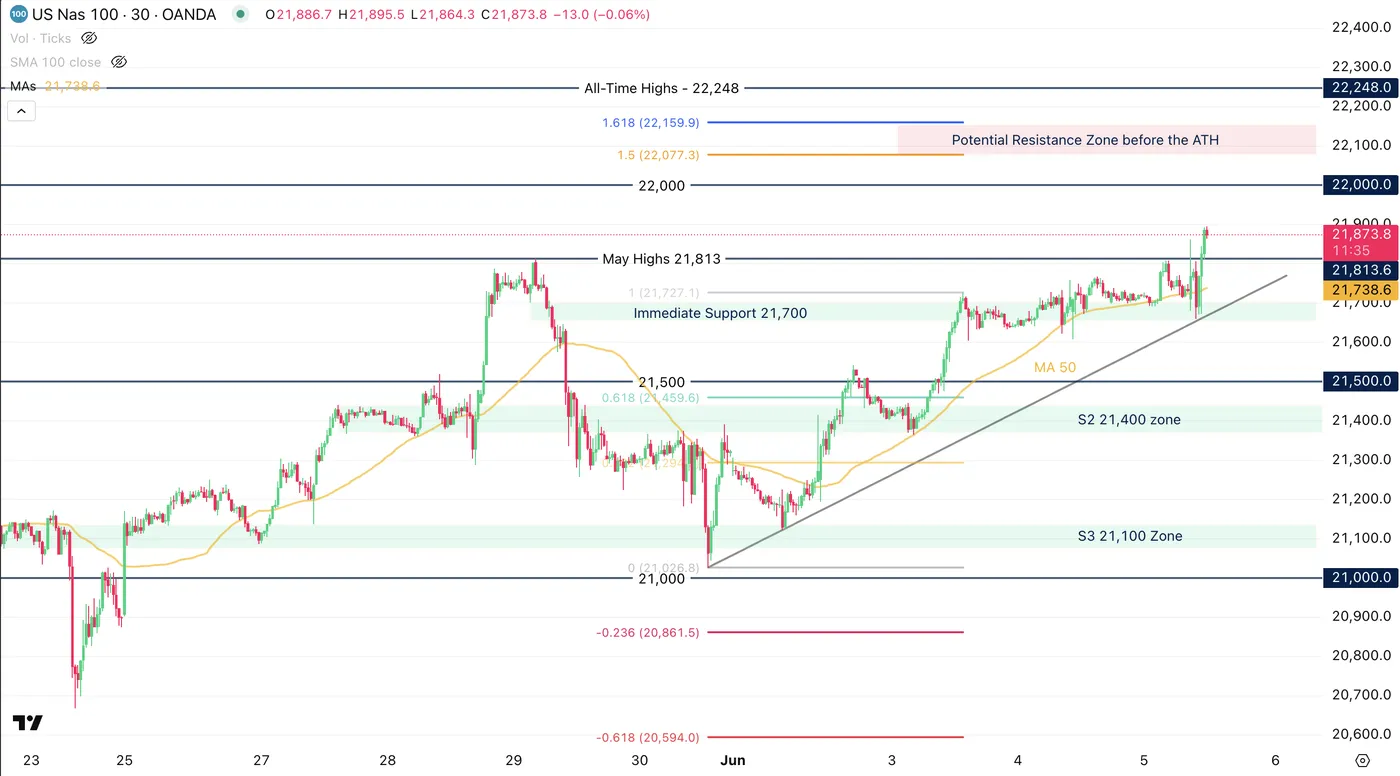
Nasdaq 100 30m Chart, June 5, 2025 - Source: TradingView
The Nasdaq which was already on a decent week is up above 0.70% as we speak, with very strong bullish candles.
The Tech-focused Index is less than 400 points (and 2%) from its all-time highs, located at 22,248.
The broadly positive sentiment is giving another leg to the rally that had started since the middle of April in what now looks like a flash recovery.
This is giving even more importance to the Non-Farm Payroll report tomorrow, expected at 130K, as a beat on expectations could easily lead to new all-time Highs.
Zones for support and resistances:
Support Zones (+/- 25 points)
- 21,700 S1
- 21,400 S2
- 21,100 S3
Resistance Zones
- 22,000 (psychological Level)
- 22,077 to 22,150 (Fib Projections)
- 22,248 (all-time highs)
Dollar Index Intra-Day Chart
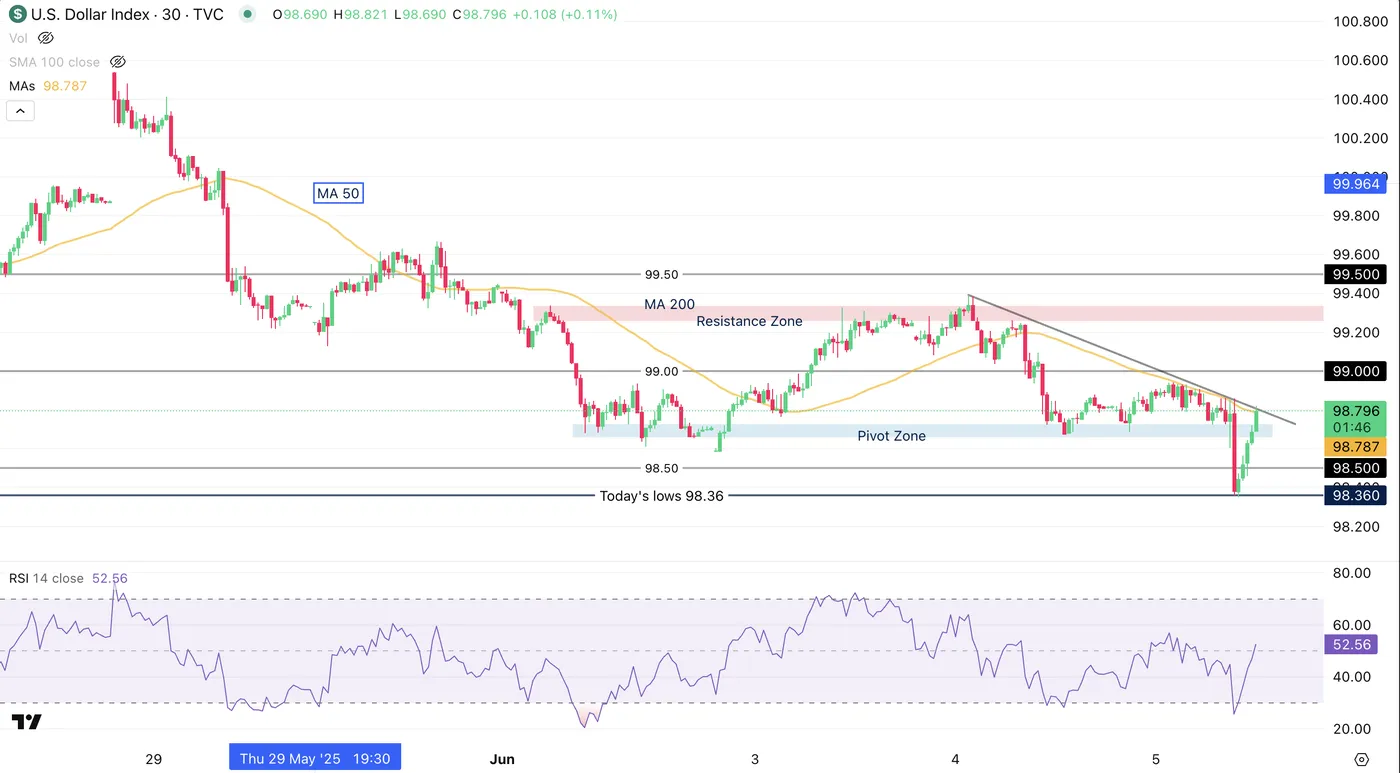
DXY 30M Chart, June 5, 2025 - Source: TradingView
The Dollar which had been having a tough week rallied from its post-ECB press conference lows - The forex outlook is risk-on overall.
The sharp reversal towards the last support now turning into Immediate Pivot Zone (between 98.65 to 98.73) will be essential for both bulls and bears.
A break above points toward the 99.00 psychological level, then the 99.25 to 99.35 Resistance Zone.
Prices will have to breach the 30m MA 50 and downtrend, though momentum is strong and RSI is still far from overbought.
A rejection of today's highs points to a retest of today's lows at 98.40, and a further break to the 98.00 psychological level.
Safe Trades!
European Central Bank Continues Rate Cut Cycle
Summary
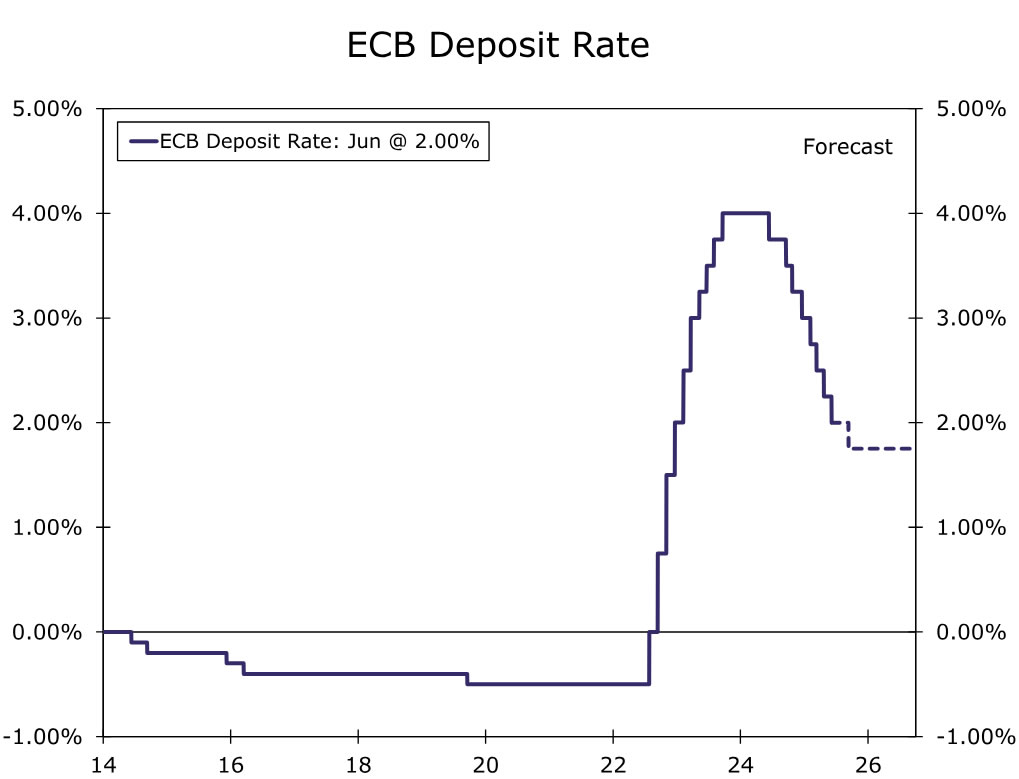
- The European Central Bank (ECB), in a widely expected decision, lowered its Deposit Rate by 25 bps to 2.00% at today's announcement, while its accompanying statement contained both dovish elements and some more constructive elements.
- The ECB noted that current conditions were exceptionally uncertain, while also observing a deceleration in underlying inflation pressures and wage growth. While the ECB offered limited policy guidance for the meetings ahead, ECB President Lagarde did say the central bank was “getting to the end of a monetary policy cycle.”
- The ECB also provided updated economic projections. The central bank's GDP growth forecasts were little changed. Regarding prices, the forecasts for headline inflation were lowered on the back of reduced oil prices and a stronger euro. There was little change to the ECB's underlying (CPI ex food and energy) forecasts, although a projection of 1.9% for both 2026 and 2027 suggests, in our view, the ECB maintains a modest easing bias.
- We think today's monetary policy announcement supports further monetary easing, though it does not alter our view on the likely pace of ECB rate cuts. We expect a pause from the ECB at its July meeting and a 25 bps rate cut by the ECB in September, which would take the Deposit Rate to 1.75%. While we think the risks are likely tilted toward a more pronounced easing cycle, we do not yet see compelling enough evidence for the ECB to hasten or add to its rate cut cycle.
European Central Bank Cuts Rates, Leaves Door Open For Further Easing
The European Central Bank (ECB) cut its Deposit Rate by 25 bps to 2.00% at today's monetary policy announcement in a widely expected decision, bringing the cumulative easing during the current cycle to 200 bps. The accompanying announcement was careful to provide only limited guidance on the path for future monetary policy, though, in our view, the ECB's comments and updated economic projections keep the door open for further monetary easing. Among the key elements of today's announcement, the ECB said:
- Current conditions were that of “exceptional uncertainty.”
- Most measures of underlying inflation suggest inflation will settle around 2% on a sustained basis.
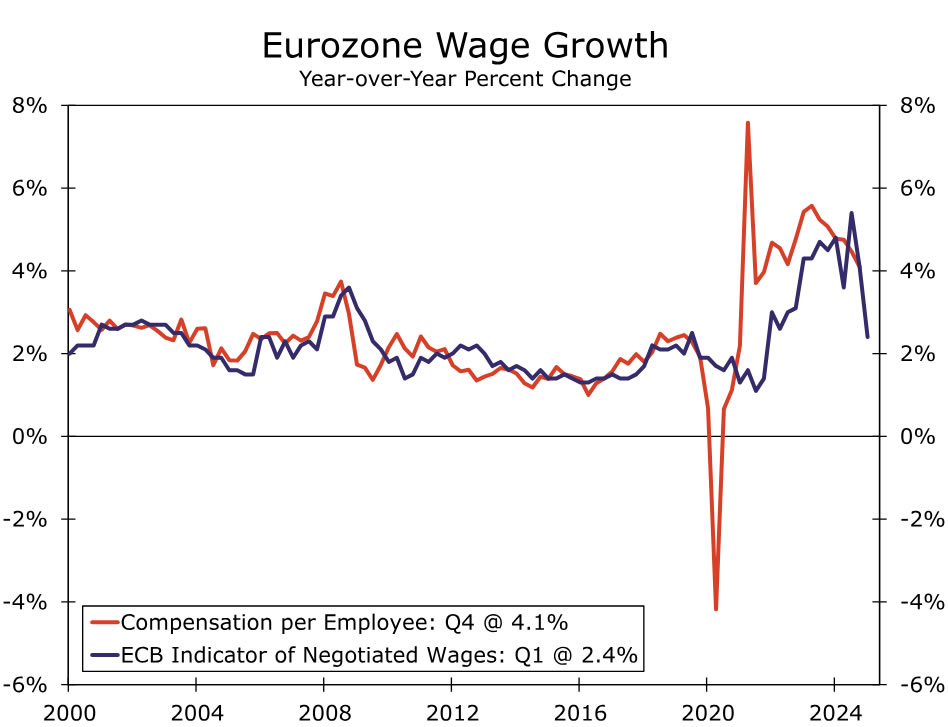
- Wage growth is still elevated but continues to moderate visibly, and profits are partially buffering its impact on inflation.
While acknowledging near-term headwinds to growth, on a somewhat more constructive note, the ECB also said “rising government investment in defense and infrastructure will increasingly support growth over the medium term. Higher real incomes and a robust labor market will allow households to spend more. Together with more favorable financing conditions, this should make the economy more resilient to global shocks.”
As has typically been the case recently, the ECB offered limited future guidance. The central bank said “it will follow a data-dependent and meeting-by-meeting approach to determining the appropriate monetary policy stance” and that it is “not pre-committing to a particular rate path.” Importantly however, in the post-meeting press conference, ECB President Lagarde said the central bank was “getting to the end of a monetary policy cycle.”
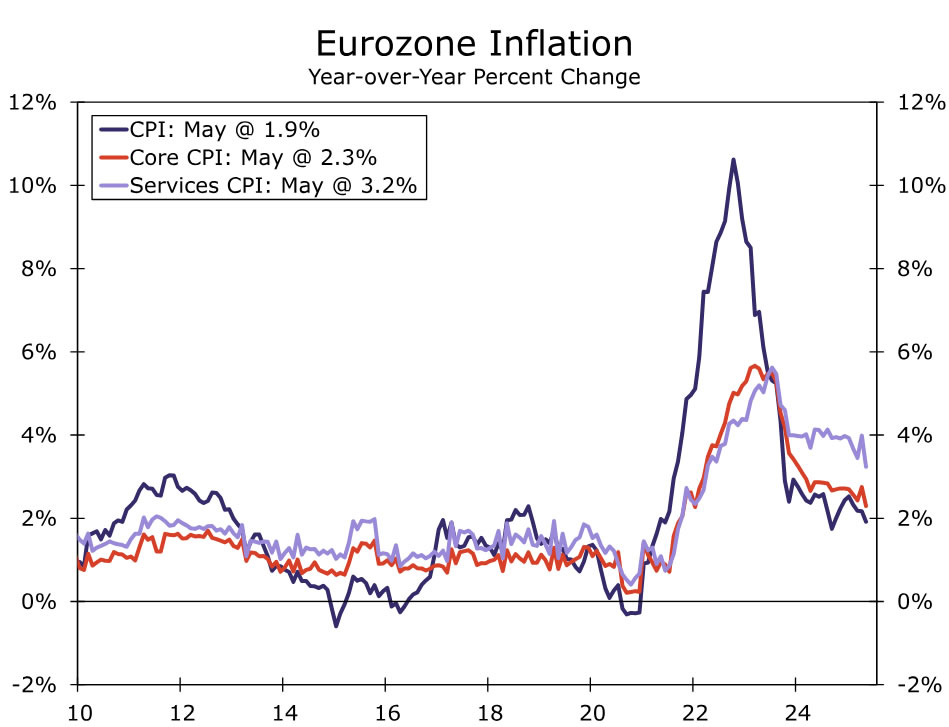
Regarding the ECB's updated economic projections, the central bank's GDP growth forecasts were little changed at 0.9% for 2025, 1.1% for 2026 and 1.3% for 2027. We, along with the ECB, assess the risks around these growth forecasts as likely tilted to the downside. The forecasts for headline inflation were reduced, reflecting lower oil prices and in part a stronger euro, at 2.0% for 2025, 1.6% for 2026 and 2.0% for 2027. However, forecasts for underlying inflation trends (the CPI excluding food and energy) were actually revised higher to 2.4% for 2025, slightly lower to 1.9% for 2026 and unchanged at 1.9% for 2027. The fact that the underlying inflation forecasts for 2026 and 2027 are slightly below the ECB's 2% inflation suggests, in our view, that the ECB maintains a modest easing bias.
Finally, the ECB outlined some scenario analysis related to differing potential paths for the evolution of global trade tensions. Under these scenarios, “a further escalation of trade tensions over the coming months would result in growth and inflation being below the baseline projections. By contrast, if trade tensions were resolved with a benign outcome, growth and, to a lesser extent, inflation would be higher than in the baseline projections.”
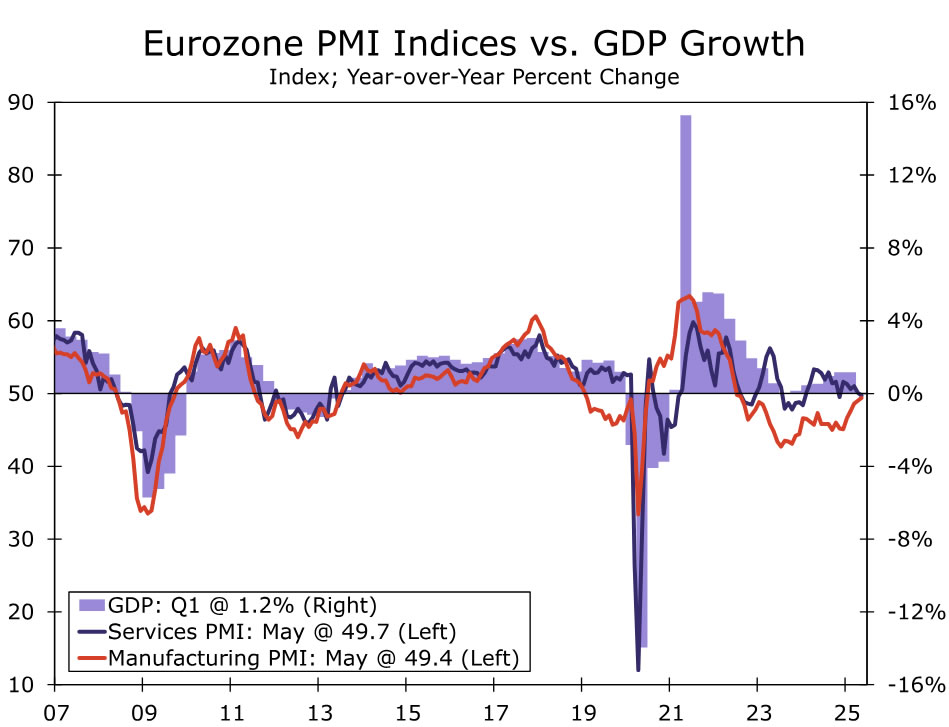
Overall we view the ECB's ongoing, albeit modest, easing bias as well-founded. Both headline and core inflation slowed in May, to 1.9% year-over-year and 2.3% year-over-year respectively. The ECB's Indicator of Negotiated Wages slowed to 2.4% year-over-year in Q1, and other wage growth measures are also moderating. Meanwhile, sentiment surveys remain downbeat, suggesting that growth is likely to underwhelm in the immediate months ahead. That said, while we think today's monetary policy announcement supports the view of further monetary easing, it does not alter our view on the likely pace of ECB rate cuts, especially considering Lagarde's comments regarding where we are in the easing cycle. We expect a pause from the ECB at its July meeting, and a 25 bps rate cut by the ECB in September, which would take the Deposit Rate to 1.75%. To be sure, the risks still appear somewhat tilted toward faster or more pronounced ECB rate cuts, with CPI inflation, GDP growth, sentiment surveys, and the evolution of trade tensions all having the potential to disappoint to the downside in the coming months. That said, we also remain “data-dependent” and do not yet see compelling enough evidence to suggest a more extended ECB easing cycle, given the ECB's policy rate is already in a neutral zone. Against that backdrop, at this time our base case remains for the ECB to deliver its final rate cut of the current easing cycle in September.
Sunset Market Commentary
Markets
The ECB delivered as expected its eighth 25 bps rate cut to 2%. One member (most likely Holzmann) voted to skip. ECB chair Lagarde avoided a question whether this was now a neutral rate but said the current level means it is well positioned to navigate through the uncertain conditions. It clearly mimics recent Fed wording used by policy makers when they are supporting the long rates status quo. Lagarde in any case noted the ECB is getting towards the end. It penciled in a lower inflation forecasts for this year to 2% (from 2.3%) and 1.6% (from 1.9%) in 2026 owing to lower energy prices and a stronger euro. 2027 remained unchanged at 2%. Core CPI forecasts were broadly the same at 2.4%-1.9%-1.9%. GDP is seen at 0.9%-1.1%-1.3% over the policy horizon, barely deviating from March. A strong start in 2025 but a trade uncertainty-related weaker remainder of the year resulted in the unchanged forecast. Rising government spending in defense and infrastructure will increasingly support growth over the medium term, flanked by higher real incomes and a robust labour market underpinning household consumption. On these growth forecasts, Lagarde said she wouldn’t exclude further upward revisions. ECB staff produced alternative scenarios where an escalation of trade tensions ends up in below-baseline growth and inflation forecasts. A benign outcome leads to higher growth and to a lesser extent CPI. Such scenario analysis is testament to the high uncertainty context, which is also why the ECB refrains from giving any forward guidance. Growth risks are tilted to the downside, with Lagarde referring to the trade and geopolitical theme. Some note this is a less alarming analysis than in April, when Lagarde spoke about “increasing” downside risks. On inflation the (risks surrounding the) outlook is more uncertain than usual with a series of factors often delivering a conflicting impact.
European yields initially dipped when digesting especially the new inflation forecasts but quickly rebounded after a relatively upbeat growth assessment and the hint to a pause. The curve bear flattens with net daily changes varying between +1.2 and +5.4 bps. Money markets pared easing bets though still expect at least one more this year. The euro strengthens to EUR/USD 1.1485 and is nearing the April high. The marginal USD appreciation after reports of president Trump and his Chinese counterpart Xi having held a phone call quickly evaporated. It is nevertheless their first contact, initiated by Trump, and potentially an important step towards easing trade tensions. The news also helped US yields overcome their intraday weakness (jobless claims related) to trade virtually flat on the day.
News & Views
The Bank of England published its monthly Decision Maker Panel (DMP) survey of CHO’s from SME’s. Firms reported that their realised own-price growth remained unchanged at an average annual rate of 3.5% in the three months to May. Year-ahead own-price inflation was expected to be 3.7% in the three months to May (from 3.9%). Expectations for year-ahead CPI inflation remained unchanged at 3.2% and at 2.8% for the 3-yr ahead gauge. Firms reported annual wage growth was 4.7%. Expected year-ahead wage growth fell from 3.8% to 3.7%. Across all questions on the potential impact of recent changes to US trade policy on sales, prices and investment over 70% of firms reported that these would have no material impact on their firms. 56% of firms nevertheless reported that the overall level of uncertainty facing their business was high or very high.
In a press conference today, Governor Glapinski of the National Bank of Poland (NBP) commented yesterday’s NBP policy decision. The NBP left its policy rate unchanged at 5.25% with few clues going forward. Growth in Q1 at 3.2% was supported both by consumption and investment. The NBP also mentioned an ongoing low unemployment rate and a high level of employment, with mixed signals on wage growth. CPI inflation in April declined to 4.1%, but this was mainly due to a lower fuel prices. NBP expects inflation ex food and energy prices to decline slightly in May, but services inflation is expected to remain elevated. At the press conference today, governor Glapinski said economic growth and in particular fiscal policy as being pro-inflationary. New gas tariffs might decelerate inflation in coming months, but at the same time, the NBP governor still sees risk of higher inflation longer term. The comments suggest that there is still division inside the MPC on the timing for further rate cut after May’s 50 bps one. The zloty gained modest ground during the press conference (EUR/PLN 4.28).
EUR/USD Rallies Despite 25 Bps Cut from the ECB
The Euro is rallying despite the 25bps cut from the European Central Bank from this morning. The ECB Deposit Rate is now at 2% from 2.25%.
The fact that the markets had the cut priced in (well-expected) led to prices were broadly unchanged - markets seesawed but came right back to their level from the beginning of the session.
As I am writing this, markets are rallying on the "We are well positioned" comments from Christine Lagarde, speaking right now.
Christine Lagarde is speaking on the ongoing press conference mentioned that Inflation (core inflation) is targeted to be on target towards 2027, therefore there is still need for some change.
She also mentioned how a strong Euro will hurt exports as things have already been slowing down going into the meeting.
These two lines are contradicting - my base case is a pause for next meeting in the waiting for September ECB Projections.
2% is also the longer-run targeted interest rate for the ECB but they still mention that they are in a good position and will take things meeting-by-meeting.
Lagarde also expressed. like every speaker of every central bank, how one of the biggest upcoming challenge is the uncertainty of Global Tariffs - one of the reasons why any trade deal news is welcomed by markets.
By the way, we are waiting for more news on these headlines but Trump and Xi Jinping are currently discussing.
Let’s break down the charts from the Daily to the Hourly timeframe to identify the key levels worth monitoring.
EUR/USD Technical Analysis
EUR/USD Daily
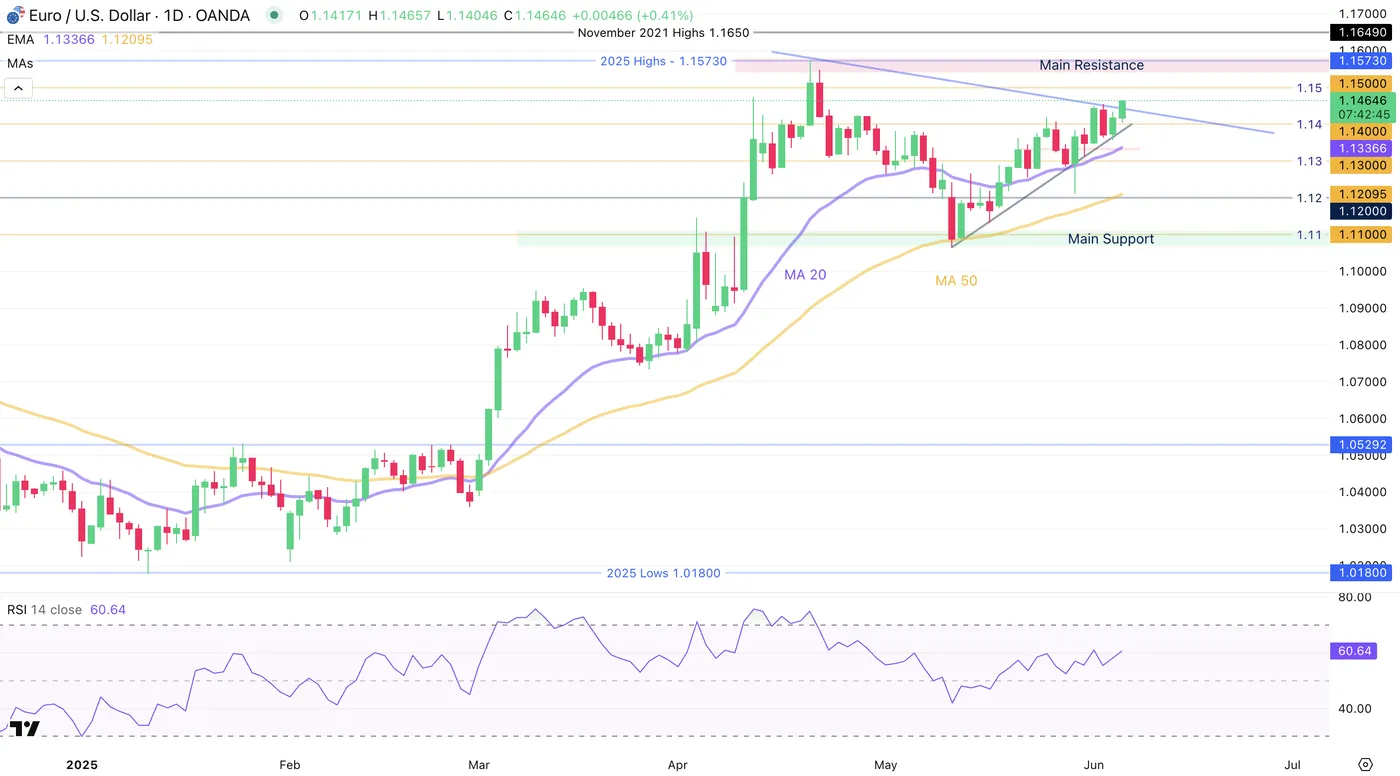
EUR/USD Daily Chart, June 5, 2025 - Source: TradingView
The Euro is maintaining its upwards direction from the mid-May bounce. The Daily Exponential MA 20 and EMA 50 are both acting as support.
Momentum is strong and the RSI is not overbought on the daily yet, giving space for movement.
Expect volatility on the currency though as the day is not over!
The current Daily Candle is strong and overlapping the June 3 Daily bear candle.
Let's dive further.
EUR/USD 4H Chart
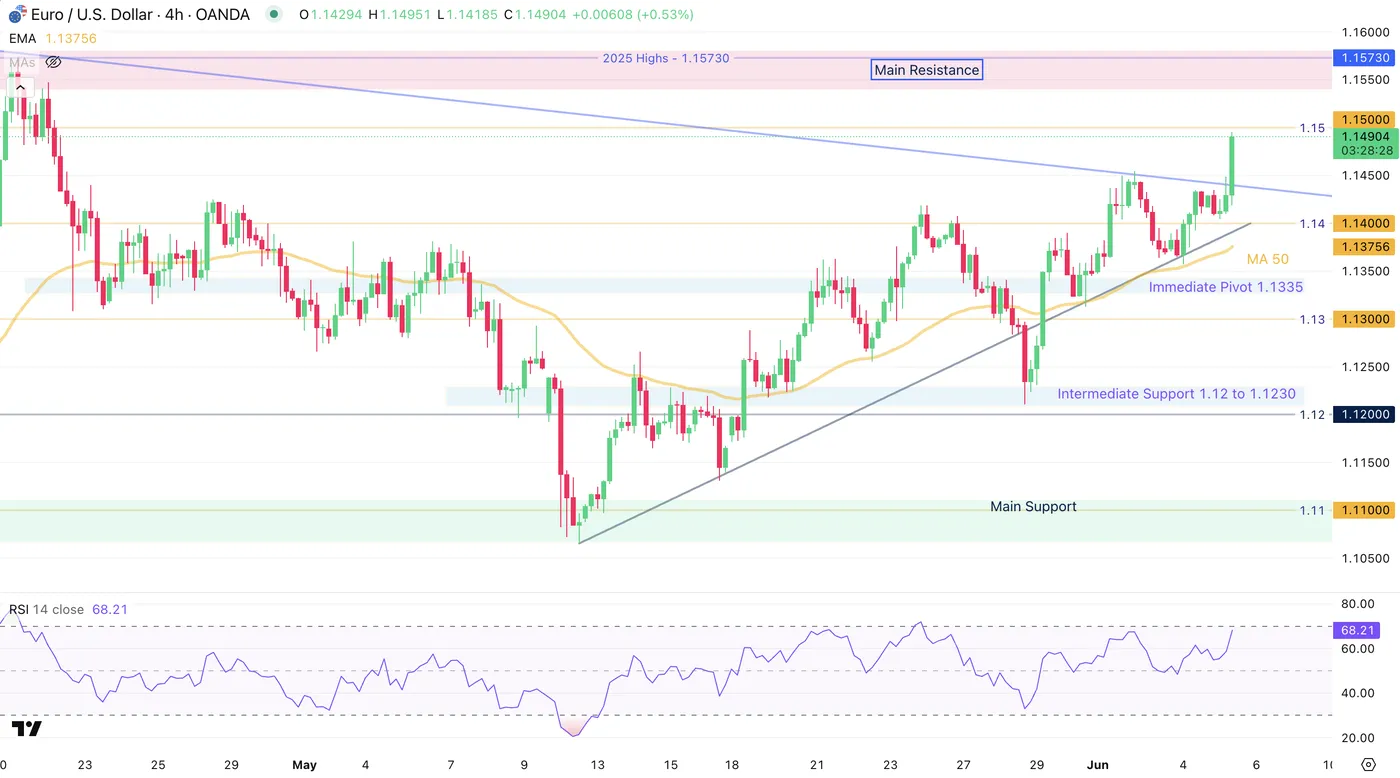
EUR/USD 4H Chart, June 5, 2025 - Source: TradingView
Prices have yesterday bounced on the Immediate Pivot at 1.1335 enjoying from a weak USD overall, but today confirms the bullish momentum especially with the current strong candle.
Markets are really appreciating the "well-positioned" comments and we are currently heading to the 1.15 key level and we are breaking through the downward trendline formed from the June 3 highs.
Next up is the EUR/USD yearly highs at 1.15730, though keep in mind that there are a few levels to break before - especially with a 4H overbought RSI (which doesn't mean reversal but stretched momentum - which may keep going).
Let's look at potential hurdles before the yearly highs on the 1H chart.
EUR/USD 1H Chart
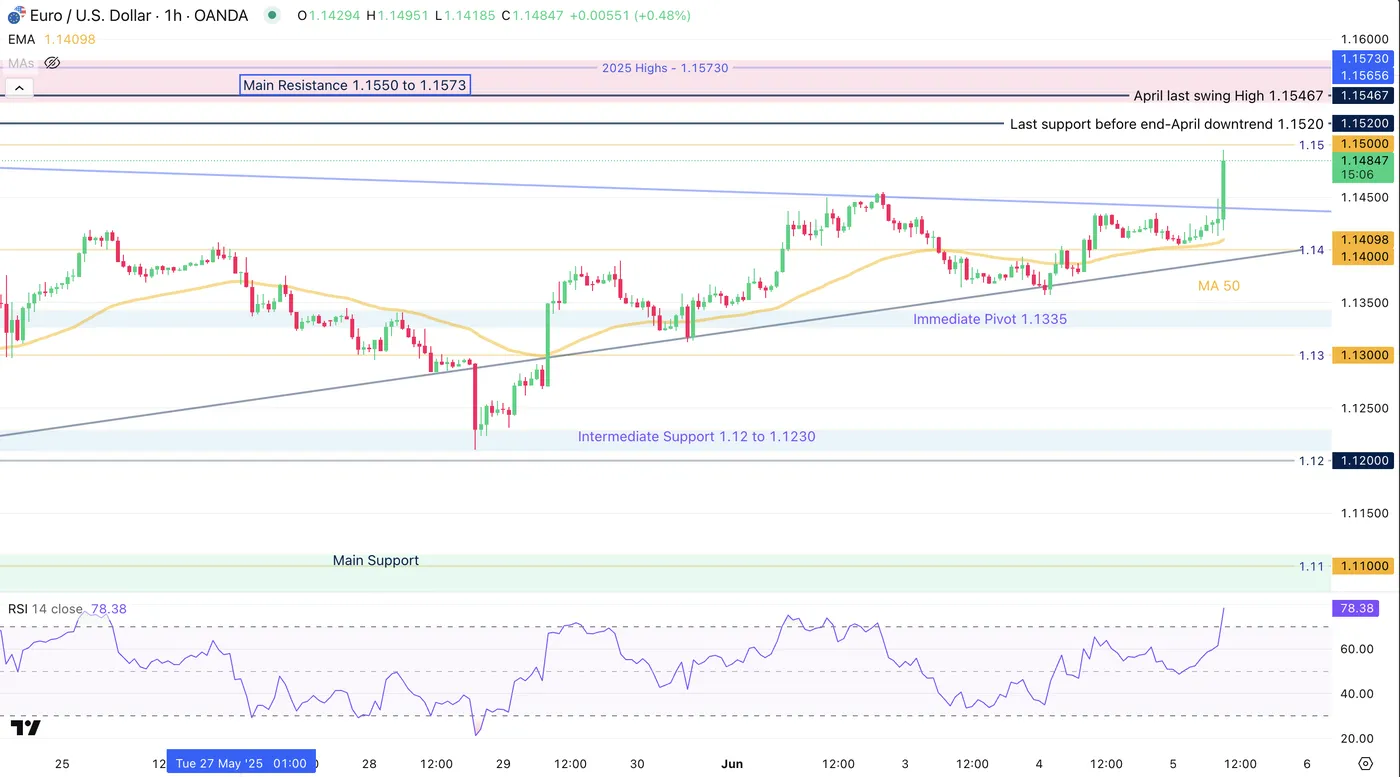
EUR/USD 1H Chart, June 5 2025 - Source: TradingView
The ECB conference is coming to its end on a very strong 1H Candle - we are approaching the 1.15 Key level fast.
The Prices have used the MA 50 as support on the 1H and the RSI is currently well-into overbought - This momentum is very tough to fade.
There are only a few hurdle going towards the April 2025 highs:
- Last support before end-April downtrend 1.1520
- Main Resistance Zone 1.1550 to 1.1573
The Euro is currently up over 0.60% on the day.
Safe Trades!