
Sample Category Title
USD/JPY Daily Outlook
Daily Pivots: (S1) 142.75; (P) 143.36; (R1) 144.20; More...
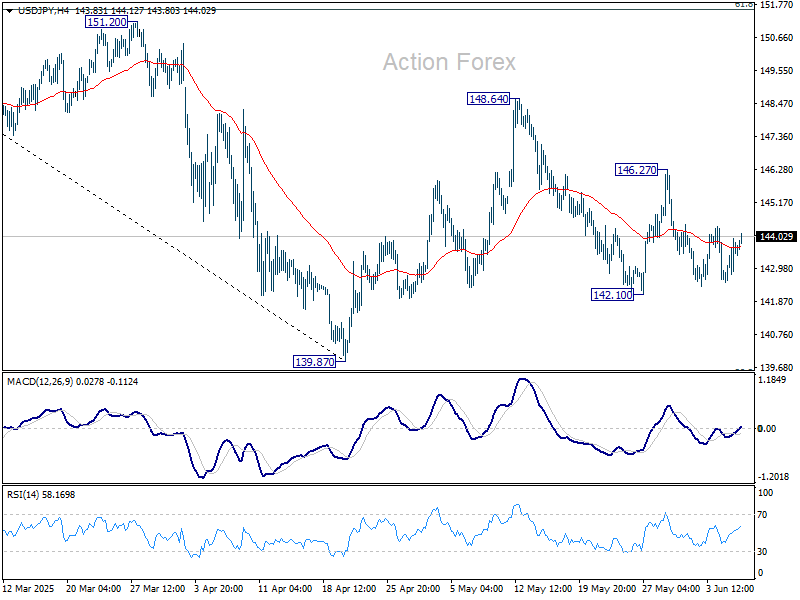
USD/JPY is still bounded in established range and intraday bias stays neutral. On the upside, above 146.27 will target 148.64 resistance first. Firm break there will resume the rebound from 139.87. Nevertheless, break of 142.10 will bring deeper fall back to 139.87 low.
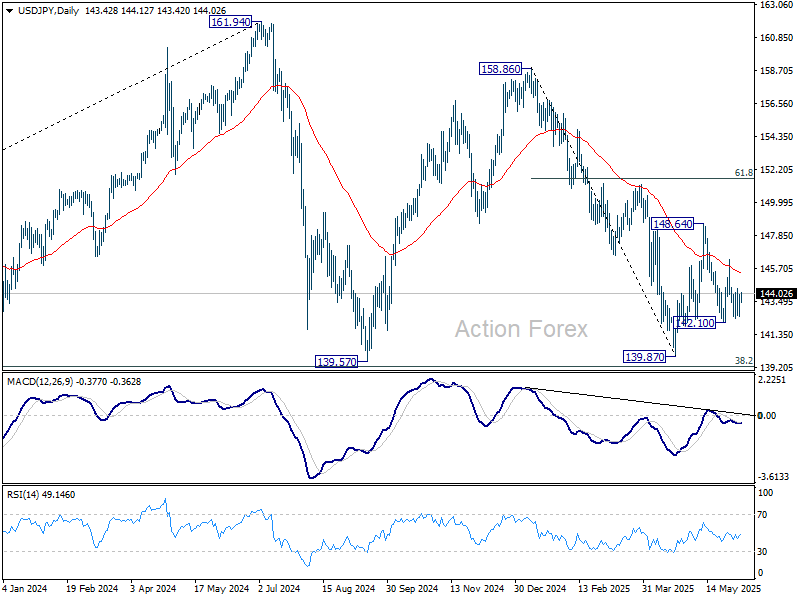
In the bigger picture, price actions from 161.94 are seen as a corrective pattern to rise from 102.58 (2021 low), with fall from 158.86 as the third leg. Strong support should be seen from 38.2% retracement of 102.58 to 161.94 at 139.26 to bring rebound. However, sustained break of 139.26 would open up deeper medium term decline to 61.8% retracement at 125.25.
GBP/USD Daily Outlook
Daily Pivots: (S1) 1.3536; (P) 1.3577; (R1) 1.3612; More...
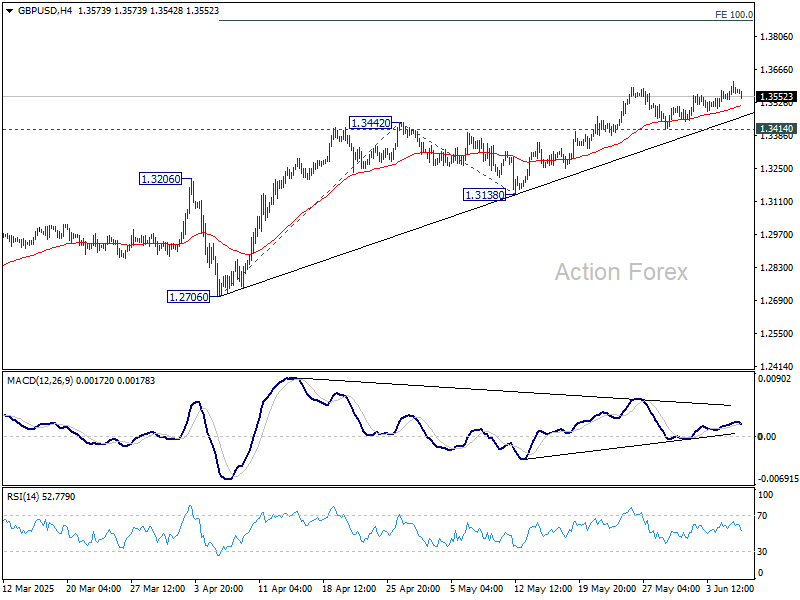
Further rally is expected in GBP/USD with 1.3414 support intact. Current rise should target 100% projection of 1.2706 to 1.3442 from 1.3138 at 1.3874. However, break of 1.3414 will turn bias back to the downside for deeper pullback to 1.3138 support.
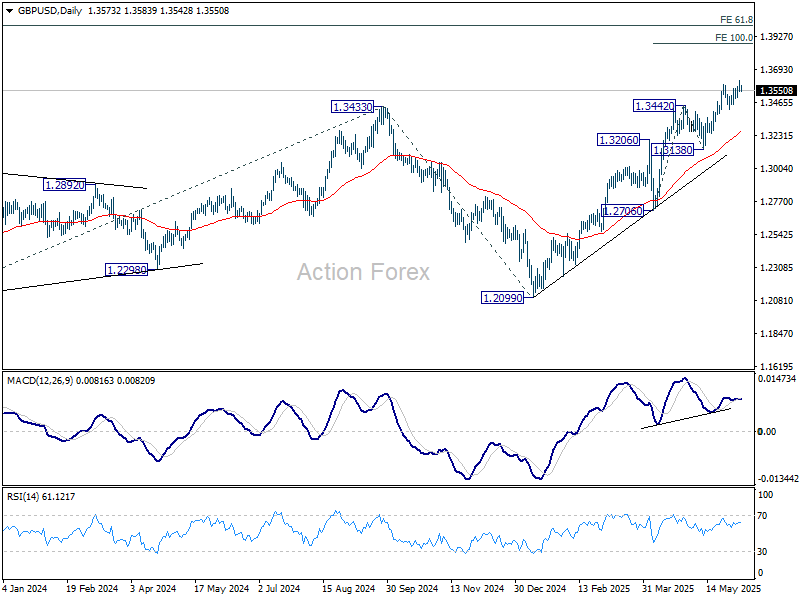
In the bigger picture, up trend from 1.3051 (2022 low) is in progress. Next medium term target is 61.8% projection of 1.0351 to 1.3433 from 1.2099 at 1.4004. Outlook will now stay bullish as long as 55 W EMA (now at 1.2866) holds, even in case of deep pullback.
USD/CHF Daily Outlook
Daily Pivots: (S1) 0.8174; (P) 0.8195; (R1) 0.8217; More….
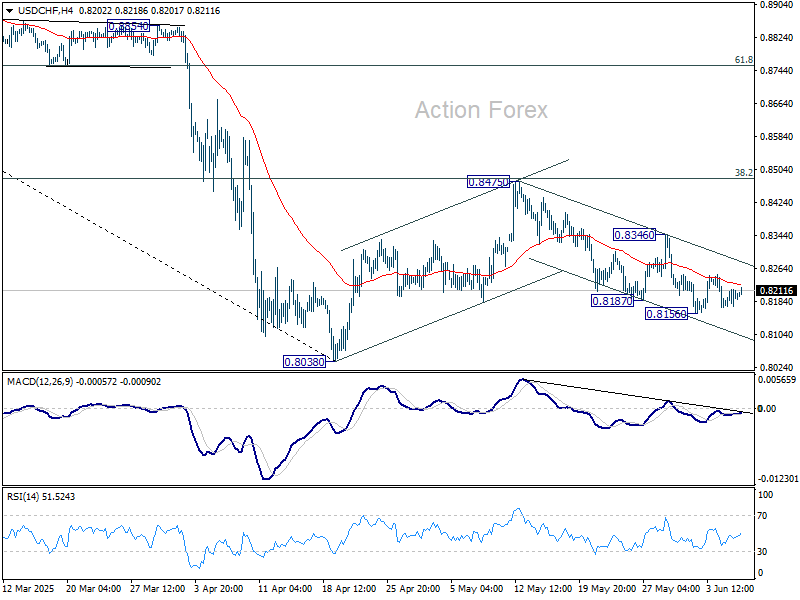
Range trading continues in USD/CHF and intraday bias stays neutral. Fall from 0.8475 could extend lower, and break of 0.8156 will target 0.8038 low. But strong support should be seen from there to bring rebound, at least on first attempt. On the upside, break of 0.8346 resistance will extend the corrective pattern from 0.8038 with another rising leg.
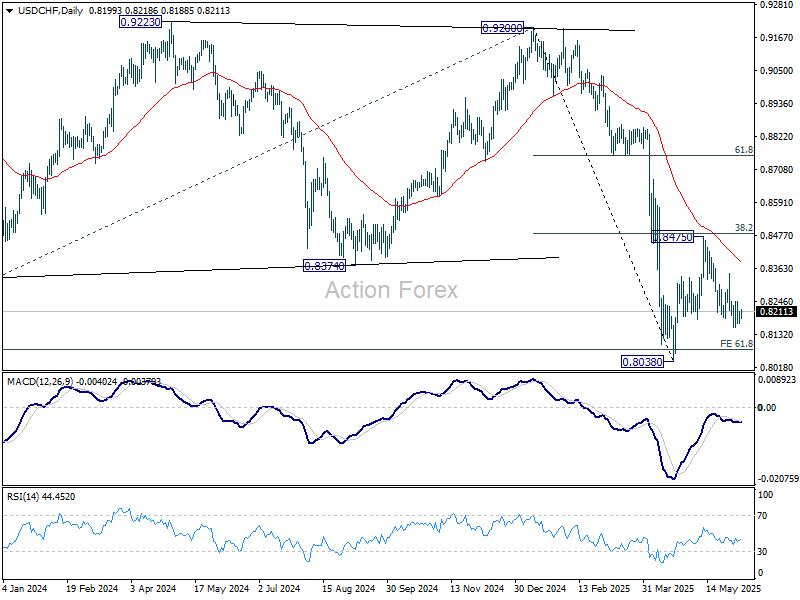
In the bigger picture, long term down trend from 1.0342 (2017 high) is still in progress and met 61.8% projection of 1.0146 (2022 high) to 0.8332 from 0.9200 at 0.8079 already. In any case, outlook will stay bearish as long as 55 W EMA (now at 0.8732) holds. Sustained break of 0.8079 will target 100% projection at 0.7382.
AUD/USD Daily Report
Daily Pivots: (S1) 0.6481; (P) 0.6510; (R1) 0.6533; More...
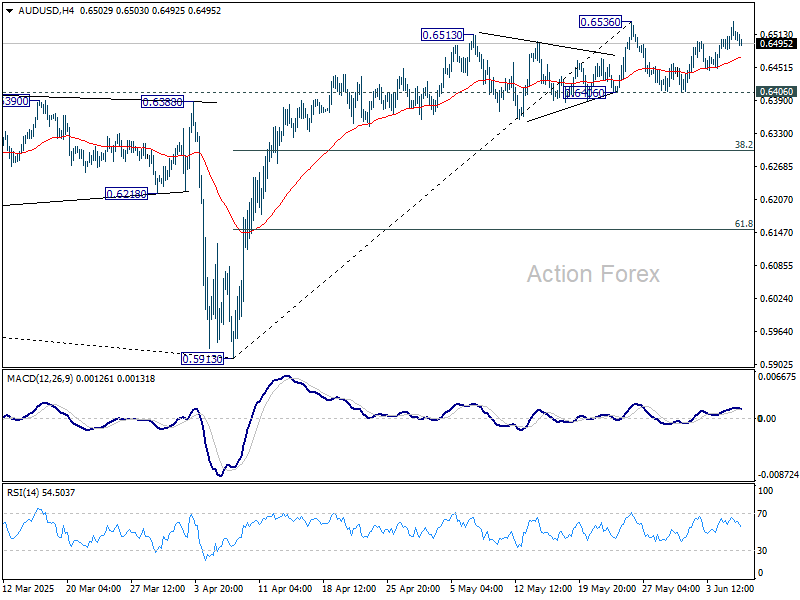
AUD/USD failed to break through 0.6536 resistance decisively and intraday bias stays neutral. With 0.6406 support intact, further rally is expected. On the upside, firm break of 0.6536 will resume the rally from 0.5913 to 61.8% retracement of 0.6941 to 0.5913 at 0.6548. However, decisive break of 0.6406 will turn bias back to the downside for 38.2% retracement of 0.5913 to 0.6536 at 0.6298.
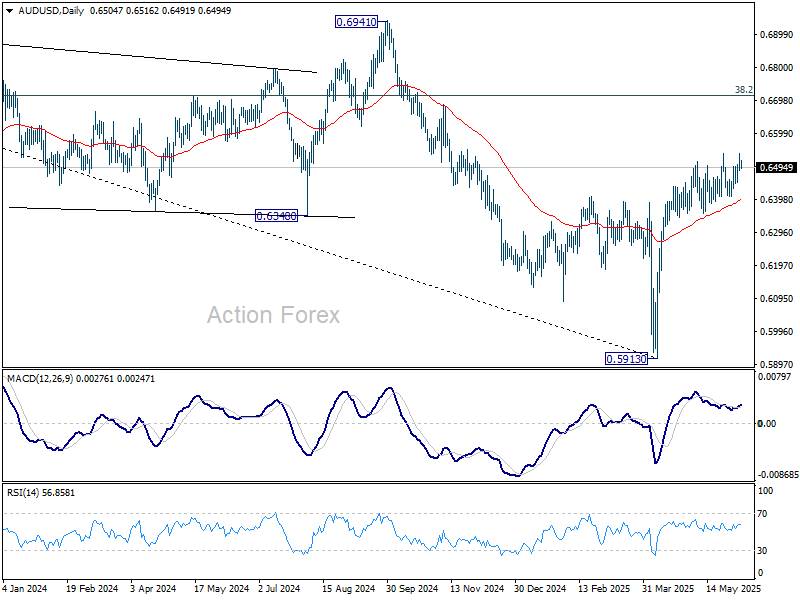
In the bigger picture, AUD/USD is still struggling to sustain above 55 W EMA (now at 0.6441) cleanly, and outlook is mixed. Sustained trading above 55 W EMA will indicate that rise from 0.5913 is at least correcting the down trend from 0.8006 (2021 high), with risk of trend reversal. Further rise should be seen to 38.2% retracement of 0.8006 to 0.5913 at 0.6713. However, rejection by 55 W EMA will revive medium term bearishness for another fail through 0.5913 at a later stage.
US Payrolls Will Have Potential to Decide on Short-Term Momentum Both in Yields and Dollar
Markets
As expected, the ECB cut its depo rate by another 25 bps to 2.0%. More than ever, the question for markets was what to expect next. Admittedly subject to a persistent high degree of event risk, conclusion is that the ECB might do less than what markets were positioned for. Chair Lagarde indicated that the bank is getting closer to the end of its policy cycle as ‘at the current level of interest rates, we believe that we are in a good position to navigate the uncertain conditions that will be coming up’. In new forecasts, the ECB sees lower headline inflation this year (2.0% from 2.3%) and in 2026 (1.6% from 1.9%). This is however mainly due to lower energy prices and a stronger euro. Inflation is expected to return to the target over the medium term (2.0% in 2027). Growth is seen unchanged at 0.9% this year, result of a strong start of the year to be followed by weaker activity due to trade uncertainty later this year. 2026 growth was slightly downwardly revised to 1.1%, fiscal measures (mainly in Germany) and a further rise in real wages and employment will continue to support growth further out. With this base scenario, the ECB can switch to a reactive, data/event driven approach. This at least suggests a pause in the easing cycle with the possibility of ending it if trade-related uncertainty would turn out less negative than feared. Yields initially still dropped on the lower inflation forecast, but soon reversed course with German yields adding between 7.5 bps (2-y) and 2.6 bps (30-y). Money markets still see about 85 % chance of one additional cut in September. Even so there is ever little reason to push for sub 1.75% levels given yesterday’s communication. The euro during the press conference briefly spiked to just below the 1.15 mark on higher yields and Lagarde referring to earlier analyses on a bigger international role for the euro. However, a big part of this gain was returned later in the session. This was partially due to a dollar comeback and a rebound in US yields. Both initially suffered after higher (247k) US jobless claims. However, both US yields and the dollar later were supported, amongst others, by more constructive headlines on the US China trade conflict after a phone call between US president Trump and XI Jinping. Some Fed comments also reinforced the reigning wait and see bias. US yields in the end even finished between +6.8 bps (5-y) and unchanged (30-y). DXY close little changed at 98.74. The euro maintained a minor gain (1.1445).
Even as the mainstream Fed-communication still firmly holds the wait-and-see narrative, today’s US payrolls will have the potential to decide on the short-term momentum both in US yields and the dollar. Recently markets grew ever more sensitive to softer than expected activity, and particular, labour market data. A weak figure might make markets change their assessment on the timing (and the pace) of additional Fed easing later this year and early next year. Consensus still sees near 125k of additional jobs in May, but the ADP report earlier this week suggests downside risks. If those were to materialize, the US yield curve might bull steepen. The dollar in such an scenario would be vulnerable with a the potential for EUR/USD to try a new attack on the 1.1573 YTD top.
News & Views
The US Treasury in its semi-annual currency report yesterday, the first since Trump’s second presidency, said that no major trading partners have manipulated their currencies in 2024. It uses three criteria: a trade surplus with the US of at least $15bln, a global current account surplus above 3% of GDP and persistent, one-way net FX purchases. Only when the three are met the country is possibly (but not necessarily, eg. Switzerland in 2022) labeled as such. Meeting two of those criteria will get you on the so-called monitoring list. Ireland and Switzerland were added to that list in yesterday’s report, along with Germany, Japan, South Korea, Singapore, Taiwan, Vietnam and China.
The Reserve Bank of India (RBI) lowered the key interest rate by a more than expected 50 bps to 5.5%. With the cut comes a change in the monetary policy stance to neutral from accommodative. Economic growth remains slower than hoped-for against the backdrop of a challenging global environment. The RBI nevertheless kept its GDP forecast for the fiscal year 2026 at 6.5%, buoyed by domestic demand. Risks are tilted to the downside. The inflation outlook was revised downward to 3.7% from 4%, potentially explaining the RBI’s stance shift back to neutral. The RBI a bit later unexpectedly slashed the cash reserve ratio to 3% from 4%, releasing an estimated INR 2.5tn by the end of November, according to RBI governor Malhotra. The bigger rate cut, the unexpected cash reserve ratio cut and switch in policy stance caused wild swings in the bond market. The 10-yr yield tumbled 12 bps initially only to reverse course (twice) and trade virtually unchanged. The Indian rupee reacted way more calmly around USD/INR 85.8.
From Big and Beautiful to Ugly and Personal
Popcorn sales will pop — that’s my best prediction for today — as the world watches the incredible escalation of tensions between Donald Trump and his – once – best buddy, Elon Musk. Musk joined the mounting chorus of critics regarding Trump’s Big and Beautiful Tax Bill. But because nothing is reasonable anymore, the tweet war between the two turned very ugly, very quickly, and ended with Trump saying that ‘the easiest way to save money in our Budget, Billions and Billions of Dollars, is to terminate Elon’s Governmental Subsidies and Contracts,’ while Musk claimed that Trump is involved in the ultra-sensitive ‘Epstein files.’
The latter exchange led to a 14% slump in Tesla’s stock price yesterday. The stock is still slightly above where it was just after Trump’s election, but we can now say that most of the gains have been given back. And of course, losing the White House’s support would be terrible for Tesla — which is being eaten alive in Europe and Asia by Chinese competition (and Elon Musk’s irritating involvement in politics) — especially since its self-driving cars and robotaxis need friendly legislation to thrive. Legislation is Trump. Q.E.D. The hype around Tesla is not looking good.
And Trump has a new friend! Well, maybe not friend friend, but apparently, Trump and Xi finally talked on the phone. They said nice things to each other. Xi agreed to relax export rules for rare earth metals that Trump’s America needs so badly to – Stay Great – while both leaders invited each other over, and both accepted. How nice! We’ll see how long this friendship lasts, but VanEck’s rare earth and metals ETF jumped nearly 4% yesterday, and close to 10% this week, climbing above the 50-DMA and leaving room to extend gains if tensions continue to ease.
Speaking of tensions, there is growing evidence — at least from this week’s job figures — that the US jobs market could be coming under pressure from trade uncertainties. While Tuesday’s job openings data hinted at more vacancies in April, Wednesday’s ADP data came in significantly softer-than-expected for May, and yesterday’s weekly update showed jobless claims rose to the highest levels since October. Today, all eyes are on the official jobs report. The US economy is expected to have added around 130K new nonfarm jobs in May, with average hourly earnings slightly higher month-on-month but slightly lower year-on-year. The unemployment rate is expected to remain steady around 4.2%.
A softer-than-expected report could further boost bets that the Federal Reserve (Fed) will cut rates sooner rather than later – if wage growth also remains soft. Another upside surprise would support optimism that the US economy is weathering the Trump shock quite well, and probably boost stock market sentiment. Fed funds futures currently price about a 1-in-3 chance of a rate cut in July. That probability — and the 2-year yield — are the ones to watch to see how investors digest today’s report. The US 2-year yield is sitting around 3.90%, well below the 4.40% level seen at the beginning of the year.
Either way, the pressure on the US dollar will likely continue amid expectations of weakening US growth and/or a dovish Fed. The EURUSD flirted with the 1.15 psychological level yesterday, after the European Central Bank (ECB) cut rates by 25bps — as widely expected — and signalled the end of its policy tightening cycle. The announcement significantly trimmed expectations of a summer cut but didn’t take the possibility of further support off the table, should trade tensions hit Eurozone economies. The ECB now expects inflation to ease to 1.6% next year and growth to stabilize around 1.1% — meaning it's giving itself room to do more if needed.
European equities welcomed the ECB decision: the Stoxx 600 added a meagre 0.16%, despite a sharp rise in short-term yields. Investors are ready to push the index higher if trade news sounds encouraging. Yesterday’s meeting between Trump and German Chancellor Merz went... not too bad. They still don’t agree on many things — starting with Ukraine — but Merz is being applauded for having ‘avoided public humiliation.’ That’s what diplomacy has come down to... avoiding public humiliation.
Elsewhere, the Nikkei is up and the yen is down this morning after data showed a much larger-than-expected decline in Japanese household spending, and a better-than-feared bond auction yesterday. In the UK, Cable traded above the 1.36 mark for the first time in more than three years, despite lingering nervousness about whether the ONS data is... accurate...
In energy, US crude has stalled around the $64.20pb mark for the fourth consecutive session and is slightly under pressure this morning. Inability to clear this resistance could trigger profit-taking into the weekend and send the barrel price below the 50-DMA, which stands near $62.40.
Elsewhere in commodities, silver rallied 10% this week. The sudden surge is being driven by ‘renewed interest from momentum traders’ as the price cleared a key resistance at $35/oz, touching a 13-year high. The mint ratio is being pulled lower due to silver's outperformance versus gold, which is stagnating near all-time highs. The mint ratio is around 93.50 right now. Historically, it has ranged between 60 and 80, and between 80 and 95 since 2022 — so there’s room for a further downward correction for the ratio to return to average levels.
US Jobs Report Concludes an Eventful Week
In focus today
In the US, the May Jobs Report is set to conclude an eventful week. We forecast nonfarm payrolls to increase by 130k, average hourly earnings rising at 0.3% m/m SA, and the unemployment rate to remain steady at 4.2%, aligning well with consensus.
In the euro area, focus turns to the third estimate of the national accounts data for the euro area in Q1. The estimate will include details on how exports and private consumption fared in Q1 as well as the ECB's preferred wage measure, compensation per employee, which will be interesting to watch following the decline in negotiated wages in Q1.
Also, in the euro area we receive the April retail sales data, which will be important to follow to see if the lower consumer confidence has translated into lower spending.
Economic and market news
What happened overnight
In geopolitics, Russia has launched a large-scale drone and missile attack on Ukraine, including residential areas in Kyiv. Earlier this week, President Putin warned of Kremlin's retaliatory actions against Kyiv in response to Ukrainian strikes on Russian air bases.
What happened since Wednesday:
In the global trade war, Presidents Trump and Xi Jinping have agreed to initiate a new round of trade talks between the US and China following a long-awaited phone call on Thursday. The conversation, primarily focused on trade, made progress on critical rare earth minerals, according to Trump. Both leaders have accepted invitations for presidential-level visits in the coming months. The call came ahead of Trump's meeting with German Chancellor Merz at the White House, where discussions on trade, defence commitments, and the Russia-Ukraine war set a positive tone for future US-German relations.
In the US, the ADP employment report came in weaker than expected with an increase of 37k private sector jobs (cons: 110, prior: 62). The Leisure & hospitality remained the most important driver of employment growth (+38k), consistent with trends seen in recent years. Meanwhile, the ISM services printed 49.9 (cons: 52.0, prior: 51.6), indicating contraction within the economy. The subcomponents painted a mixed picture as business activity and new orders weakened, while price pressures increased to 68.7 (prior: 65.1).
Jobless claims exceeded expectations, reaching 247k (cons: 235, prior: 240), indicating softening labour market conditions. Prior to the release, the May Challenger report showed a continued decline in layoff announcements of 94k, down from 105k in April and significantly lower than the DOGE-driven peak of 275k in March. This trend supports the notion that overall labour market conditions remain relatively steady, despite the ADP pointing towards a cooling in hiring.
In the euro area, the ECB cut its policy rates by 25bp, as widely expected bringing the deposit rate to 2.0%. The inflation forecast was revised downward, projecting 2.0% for this year and 1.6% for next year. While the announcement initially suggested potential for further rate cuts, ECB President Lagarde's remarks during the press conference were to the hawkish side, indicating the rate cutting cycle may be nearing its conclusion. Following today's hawkish communication, we have revised our forecast, removing the July cut and targeting a final cut in September with a terminal rate at 1.75% (prior: 1.50%). Read more in ECB review - In a good position, close to or at the end, 05 June.
Also in the euro area, the final services PMI for May was revised up to 49.7 compared to the flash release of 48.9 and 50.1 in April. The upward revision was due to France and Italy. The service sector was thus in contractionary territory in May but not as deeply as the flash print suggested. The PMI data for Q2 point to an economic stagnation in the euro area, following stronger than expected growth in Q1.
In Sweden, services PMI increased to 50.8 in May (prior: 48.7), indicating a modest return to expansion. This is encouraging news, as the service sector has previously been weaker than manufacturing, staying below the 50-mark for two consecutive months.
Sweden inflation figures for May were also released and slightly lower than expected. CPI came in at 0.0% m/m and 0.2% y/y, while CPIF printed 0.1% m/m and 2.3% y/y, and CPIF excl. energy printed 0.2% m/m and 2.5% y/y, all below consensus. This prompted the money market to add to its easing bets for the June meeting, with pricing now at 18 bp (prior: 15). Although we agree that yesterday's outcome has increased the probability of a cut already at the June meeting, we still see August as the most probable option and see market pricing as slightly excessive. Details will be released next week.
In Canada, the Bank of Canada left policy rates unchanged. The press release presented a balanced view, highlighting persistent trade uncertainties.
In China, the Caixin PMI revealed stronger services growth in May inching higher to 51.1 (prior: 50.7), despite concerns over US tariffs. The index indicates expansion, with robust new orders, although export orders faced headwinds. Positive sentiment persists, with companies increasing hiring to meet rising demand, while maintaining an optimistic outlook for the year ahead.
Equities: Equities ended the day lower yesterday, with losses led by the U.S., while European indices managed to stay in positive territory. Once again, despite a session packed with meaningful macro releases and central bank decisions, market attention was hijacked by a rather extraordinary public exchange between the President of the world's largest economy and the CEO of one of its largest corporations - mostly playing out on social media. If in doubt, just look at the performance dispersion among individual stocks - the impact is hard to miss. Defensive stocks generally outperformed cyclicals, which can be viewed through the lens of a multi-factor environment. Notably, despite a small uptick in the VIX yesterday, it remains below levels seen on April 1st - and at around 18.5 this morning, we still view sub-20 volatility as surprisingly low given the multitude of uncertainties globally. In the US yesterday, Dow -0.3%, S&P 500 -0.5%, Nasdaq -0.8% and Russell 2000 -0.1%. Developments in Asia remain mixed overnight, while European equity futures point slightly lower and U.S. futures marginally higher this morning.
FI & FX: In a choppy day for risk appetite - and by extension currency markets - the ECB decision to cut policy rates by 25bp took centre stage. While the decision was well anticipated the fairly hawkish Lagarde rhetoric at the press conference temporarily sent EUR/USD close to 1.15 before the cross erased most of its gains during the US session. The NOK enjoyed higher oil prices while the SEK largely disregarded lower-than-consensus Swedish CPI in the morning. Global yields ended the session higher with a slight continued flattening pressure from recent sessions extending. The anticipated 1:1 Danish rate cut from Danmarks Nationalbank had no impact on EUR/DKK.
USD/CAD Daily Outlook
Daily Pivots: (S1) 1.3645; (P) 1.3665; (R1) 1.3694; More...
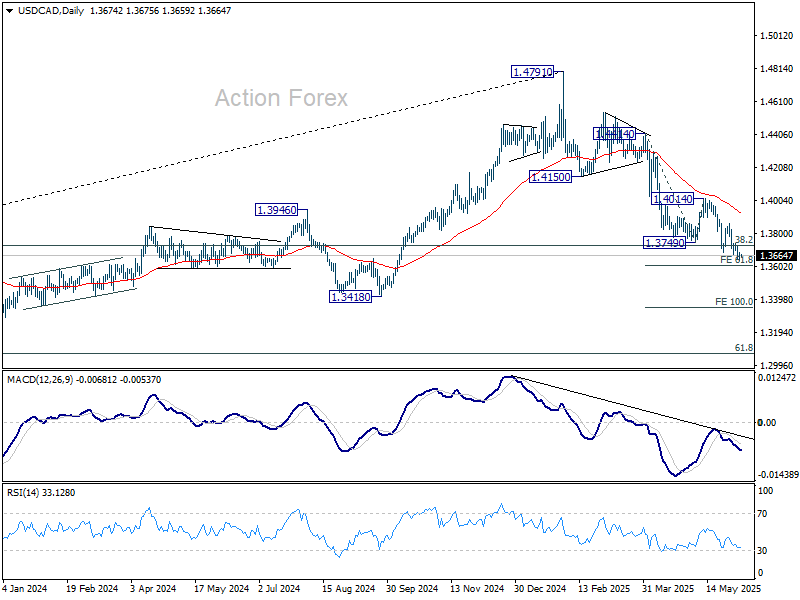
Intraday bias in USD/CAD stays on the downside as decline from 1.4791 is in progress. . Next target is 61.8% projection of 1.4414 to 1.3749 from 1.4014 at 1.3603. Firm break there will pave the way to 100% projection at 1.3349. On the upside, above 1.3741 minor resistance will turn intraday bias neutral and bring consolidations first.
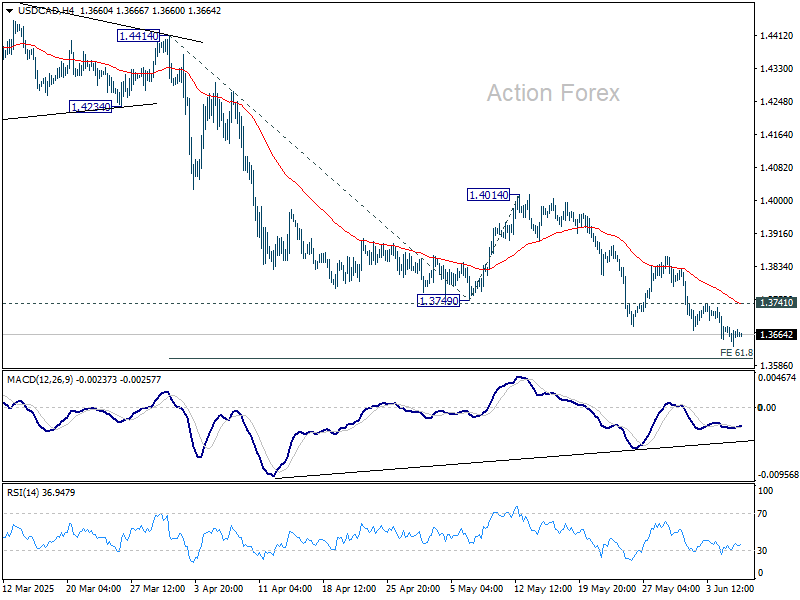
In the bigger picture, price actions from 1.4791 medium term top could either be a correction to rise from 1.2005 (2021 low), or trend reversal. In either case, further decline is expected as long as 1.4014 resistance holds. Firm break of 38.2% retracement of 1.2005 (2021 low) to 1.4791 at 1.3727 will pave the way back to 61.8% retracement at 1.3069.
Markets Eye NFP as Trump-Xi Call Fails to Lift Sentiment
There was a fleeting uptick in sentiment overnight after US President Donald Trump spoke by phone with Chinese President Xi Jinping, calling the conversation “very positive” and announcing renewed lower-level trade talks. However, the initial optimism quickly faded, with major US indexes reversing early gains to end the session lower.
The Chinese readout was more cautious, stressing that the US should “withdraw negative measures” and warning Washington to handle Taiwan “prudently.” The divergence in tone reinforces the sense that the two sides remain far apart. The agreement to more talks appears to be little more than a tactical delay rather than genuine progress.
Elsewhere, US Treasury called on BoJ to continue policy tightening to support a normalization of Yen and correct bilateral trade imbalances. The statement, part of the Treasury’s semiannual currency report, suggested Tokyo had more to do on the policy front.
However, Japan’s Finance Minister Katsunobu Kato offered a restrained response, reiterating that monetary decisions lie with the BOJ and avoiding direct comment on the US call for further tightening. Yen, meanwhile, barely reacted, continuing its technical consolidation as it drifts slightly lower against Dollar.
In currency markets, Dollar remains the worst performer of the week heading into Friday’s crucial non-farm payrolls release. With a string of weak labor-related indicators earlier this week—ADP, ISM employment components, and initial claims—markets are bracing for a soft headline. Yen and Swiss Franc are also lagging this week, underperforming alongside the greenback
On the other hand, Kiwi leads the pack, while Aussie and Sterling also posted modest gains Euro and Loonie Dollar are positioning in the middle. However, all these standings remain subject to sharp realignment depending on the tone of the upcoming US employment data and its interplay with broader market sentiment.
In Asia, at the time of writing, Nikkei is up 0.51%. Hong Kong HSI is down -0.09%. China Shanghai SSE is down -0.06%. Singapore Strait Times is up 0.16%. Japan 10-year JGB yield is flat at 1.462. Overnight, DOW fell -0.25%. S&P 500 fell -0.53%. NASDAQ fell -0.83%. 10-year yield rose 0.029 to 4.394.
Looking ahead, Germany will release industrial production and trade balance in European session. Swiss will publish foreign currency reserves while Eurozone will release retail sales and GDP revision. Later in the day, Canada will also release job data along with US non-farm payrolls.
US NFP: Muted Hiring or Major Miss?
Markets are awaiting today’s US non-farm payrolls release, with little doubt that hiring had slowed meaningfully in May amid heightened tariff threats and elevated uncertainty. The key question now is just how sharp the slowdown was.
Consensus forecasts see NFP at 130K, unemployment steady at 4.2%, and average hourly earnings rising 0.3% mom. Recent labor indicators have painted a dismal picture. ADP private employment came in at just 37k, a stark miss. ISM Manufacturing employment stayed subdued at 46.8 and the Services component barely rose back into expansion territory at 50.7. Meanwhile, 4-week average of jobless claims has crept up to 235k.
While a modest softening in job growth would likely be tolerated as a natural response to macro headwinds, any significant downside surprise could reignite recession fears. An NFP reading below 100K could provoke a sharp risk-off response in equities. However, such a result would likely weigh further on Dollar, as markets would begin pricing in earlier Fed rate cuts in response to labor market deterioration.
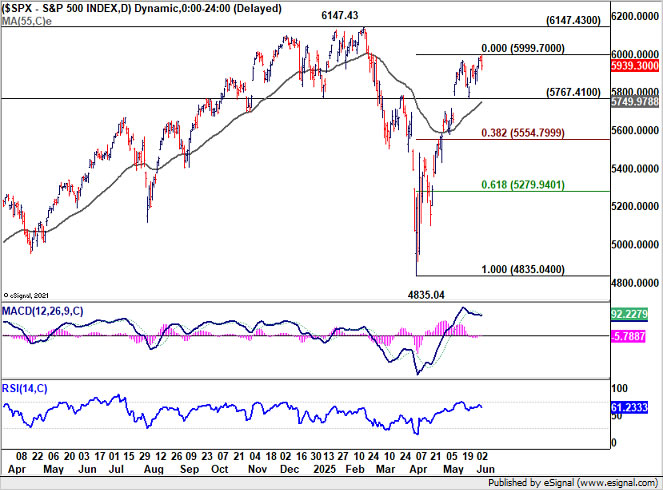
Technically, S&P 500 extended the near term rise from 4835.04 this week, but continued to lose upside momentum as seen in D MACD. This rise is seen as the second leg of the corrective pattern from 6147.43. Hence, while further rise cannot be ruled out, given that S&P 500 is now close to 6000, upside potential is limited. On the other hand, break of 5767.41 support will signal that a short term top was already formed. Deeper pull back should be seen back to 38.2% retracement of 4835.04 to 5999.70 at 5554.79, with risk of bearish reversal.
Fed's Kugler: Tariffs may entrench inflation via expectations, pricing power, and productivity
Fed Governor Adriana Kugler cautioned that disinflation "has slowed" and that tariffs are beginning to exert upward pressure on prices, a trend she expects to continue into 2025. Speaking overnight, Kugler emphasized that the balance of risks has tilted, with “greater upside risks to inflation” now emerging, even as downside risks to employment and growth loom on the horizon. As a result, she reaffirmed support for holding the current policy rate steady.
Kugler outlined three channels through which tariffs could entrench inflationary pressures. First, she noted that rising short-term inflation expectations may grant businesses "more leeway to raise prices", thereby increasing inflation persistence.
Second, she flagged the risk of "opportunistic pricing", where firms use tariff headlines as cover to hike prices even on unaffected goods. This, combined with higher costs on intermediate goods, could generate "second-round effects" on inflation.
The third concern relates to "lower productivity". As firms contend with elevated input costs and weaker demand, they may reduce capital investment and resort to less efficient production methods, reinforcing inflationary pressure through lower productivity.
Fed’s Schmid: Tariff impact uncertain, policy must stay nimble
Kansas City Fed President Jeff Schmid acknowledged in a speech overnight that monetary theory may suggest to "looking through a one-time price shock", he would be "uncomfortable staking the Fed’s reputation and credibility on theory alone."
Despite the expected drag from tariffs, Schmid remains “optimistic” about the economy’s momentum. However, he acknowledged that both the inflationary and growth implications of tariffs are highly uncertain.
As a result, he argued that Fed will "need to remain nimble", and be prepared to adjust its stance as needed to maintain both price stability and maximum employment.
USD/CAD Daily Outlook
Daily Pivots: (S1) 1.3645; (P) 1.3665; (R1) 1.3694; More...
Intraday bias in USD/CAD stays on the downside as decline from 1.4791 is in progress. . Next target is 61.8% projection of 1.4414 to 1.3749 from 1.4014 at 1.3603. Firm break there will pave the way to 100% projection at 1.3349. On the upside, above 1.3741 minor resistance will turn intraday bias neutral and bring consolidations first.
In the bigger picture, price actions from 1.4791 medium term top could either be a correction to rise from 1.2005 (2021 low), or trend reversal. In either case, further decline is expected as long as 1.4014 resistance holds. Firm break of 38.2% retracement of 1.2005 (2021 low) to 1.4791 at 1.3727 will pave the way back to 61.8% retracement at 1.3069.
USD/JPY Struggles Below Resistance: Is a Breakout on The Horizon?
Key Highlights
- USD/JPY started a fresh decline below the 144.00 level.
- A connecting bullish trend line is forming with support at 143.40 on the 4-hour chart.
- EUR/USD is now gaining pace and might clear the 1.1500 resistance zone.
- GBP/USD is also rising and testing the 1.3600 resistance.
USD/JPY Technical Analysis
The US Dollar started a fresh decline from 145.50 against the Japanese Yen. USD/JPY declined below the 144.20 and 144.00 support levels.
Looking at the 4-hour chart, the pair settled below the 144.00 level, the 100 simple moving average (red, 4-hour), and the 200 simple moving average (green, 4-hour). The pair even tested the 142.50 level and recently started a recovery wave.
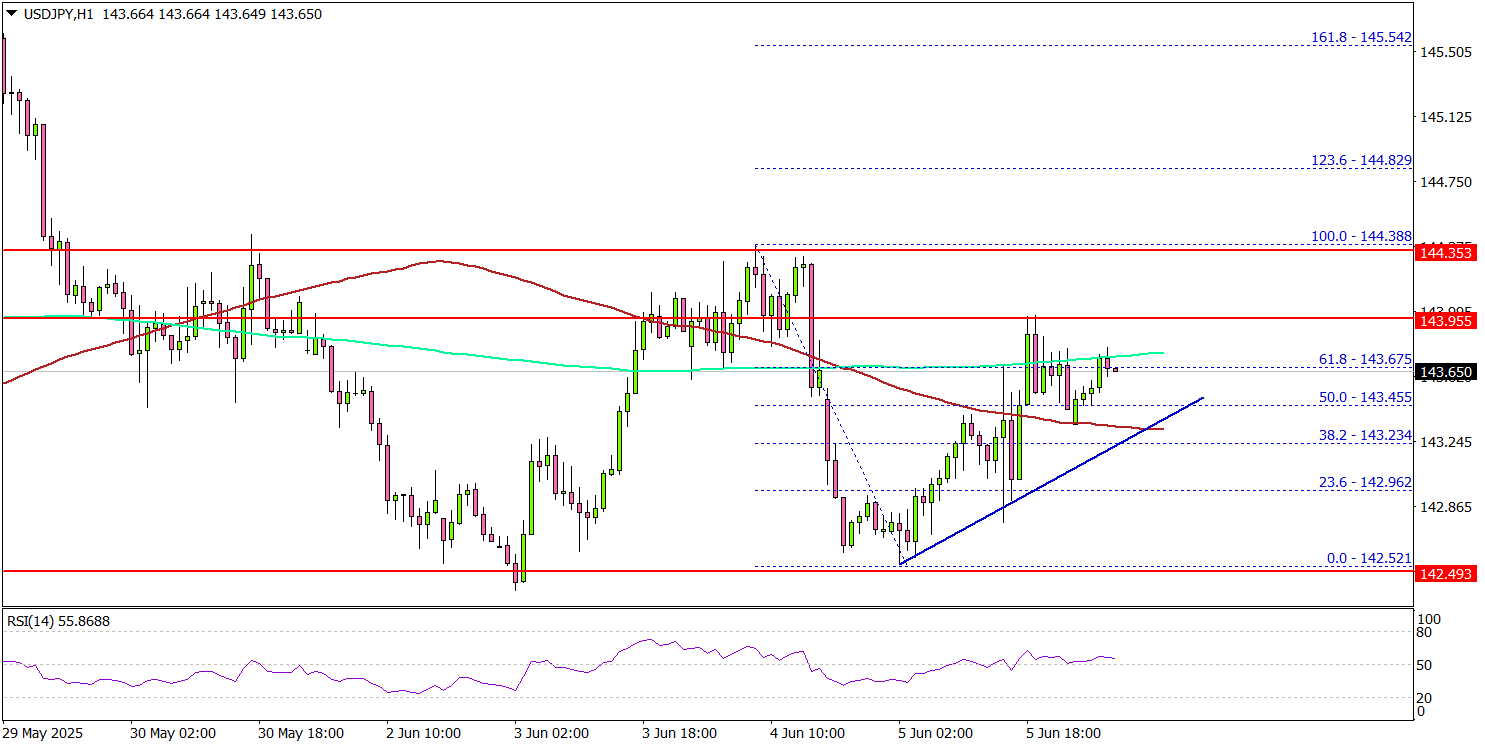
The bulls pushed the pair above the 143.20 and the 50% Fib retracement level of the downward move from the 144.38 swing high to the 142.52 low.
On the upside, the pair could face resistance near the 144.00 level. The next key resistance sits near the 144.40 level. The first major resistance sits at 145.00. A close above the 145.00 level could set the pace for another increase.
In the stated case, the pair could even clear the 145.50 resistance. The next major stop for the bulls could be near the 146.20 resistance.
On the downside, immediate support sits near the 143.50 level. There is also a connecting bullish trend line forming with support at 143.40 on the same chart. The next key support sits near 143.00. Any more losses could send the pair toward the 142.50 pivot level in the near term. The main support could be near 141.50.
Looking at EUR/USD, the pair started another increase, but the bulls seem to be facing hurdles near the 1.1480 level.
Upcoming Economic Events:
- US nonfarm payrolls for May 2025 – Forecast 130K, versus 177K previous.
- US Unemployment Rate for May 2025 - Forecast 4.2%, versus 4.2% previous.