Sample Category Title
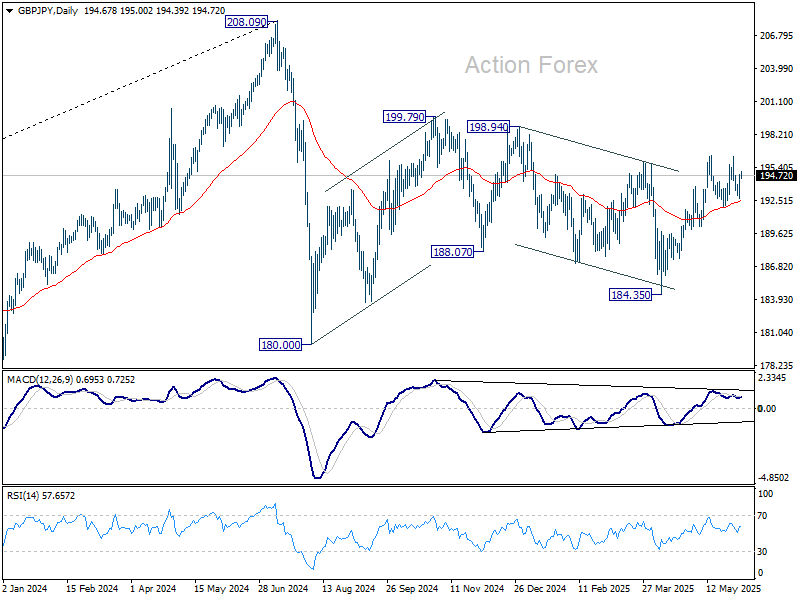
GBP/JPY Daily Outlook
Daily Pivots: (S1) 193.34; (P) 194.06; (R1) 195.39; More...
Intraday bias in GBP/JPY stays neutral for the moment. Further rise is in favor as long as 191.86 support holds. Firm break of 196.38 will resume whole rally from 184.35. However, firm break of 191.86 will indicate near term reversal and turn bias back to the downside.
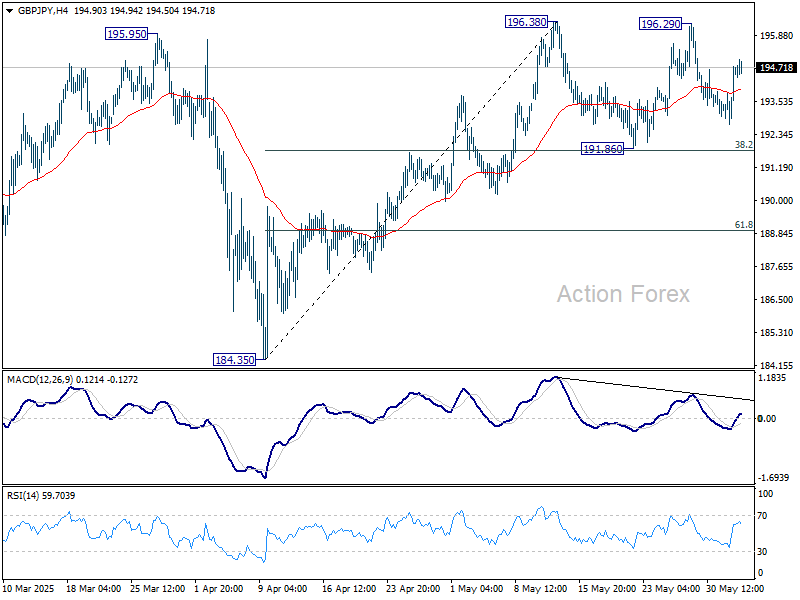
In the bigger picture, price actions from 208.09 are seen as a correction to rally from 123.94 (2020 low). Strong support should be seen from 38.2% retracement of 123.94 to 208.09 at 175.94 to contain downside. However, sustained break of 175.94 will bring deeper fall even still as a correction.
EUR/JPY Daily Outlook
Daily Pivots: (S1) 163.07; (P) 163.47; (R1) 164.15; More...
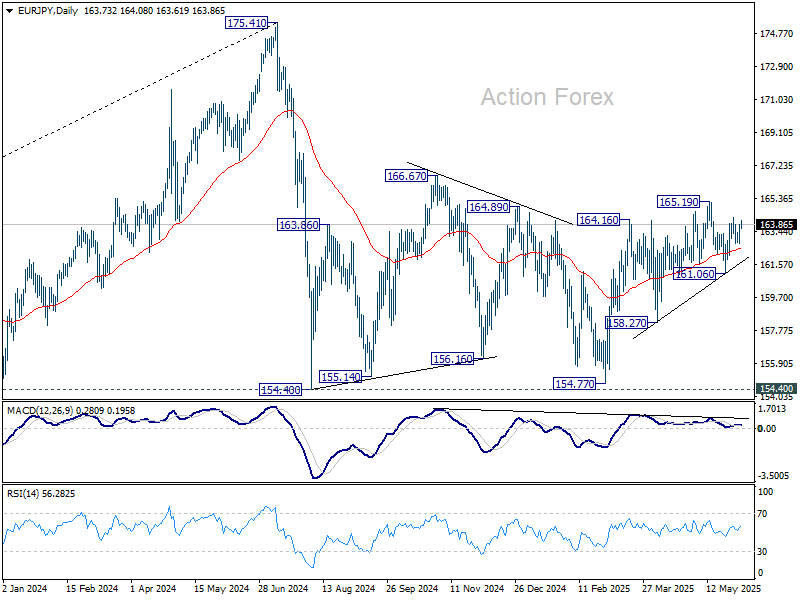
Intraday bias in EUR/JPY remains neutral for the moment, as sideway trading continues. On the upside, above 164.24 will bring retest of 165.19 resistance first. Firm break there will resume while rise from 154.77 to 166.67 resistance. On the downside, however, break of 161.06 will resume the decline from 165.19 instead.
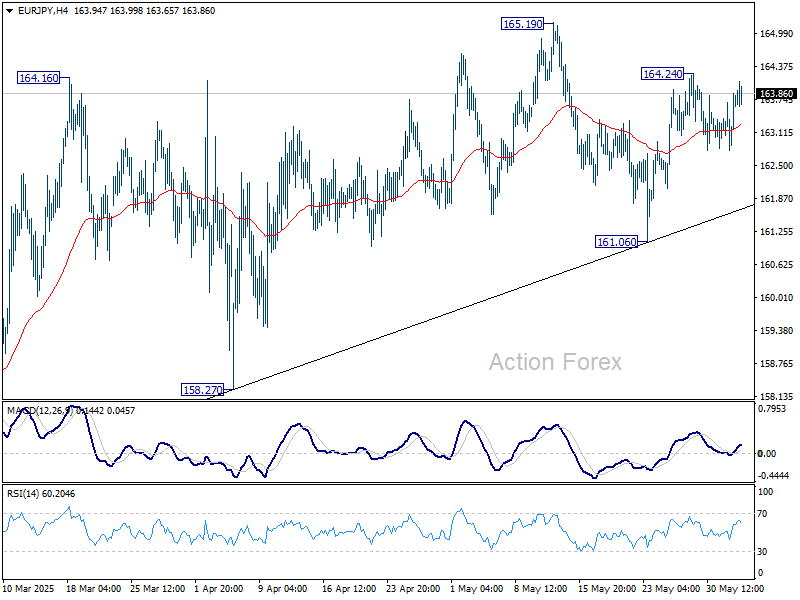
In the bigger picture, price actions from 175.41 are seen as correction to rally from 114.42 (2020 low). Strong support should be seen from 38.2% retracement of 114.42 to 175.41 at 152.11 to contain downside. However, sustained break of 152.11 will bring deeper fall even still as a correction.
EUR/GBP Daily Outlook
Daily Pivots: (S1) 0.8397; (P) 0.8424; (R1) 0.8438; More...
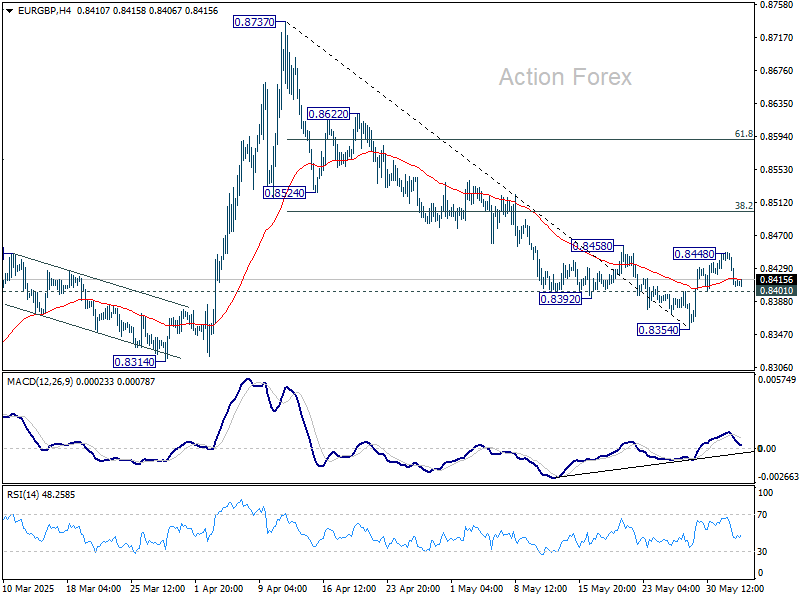
EUR/GBP retreated ahead of 0.8458 resistance and intraday bias is turned neutral first. On the upside, above 0.8448 will resume the rebound to 38.2% retracement of 0.8737 to 0.8354 at 0.8500. On the downside, however, break of 0.8401 minor support will bring retest of 0.8354 low.
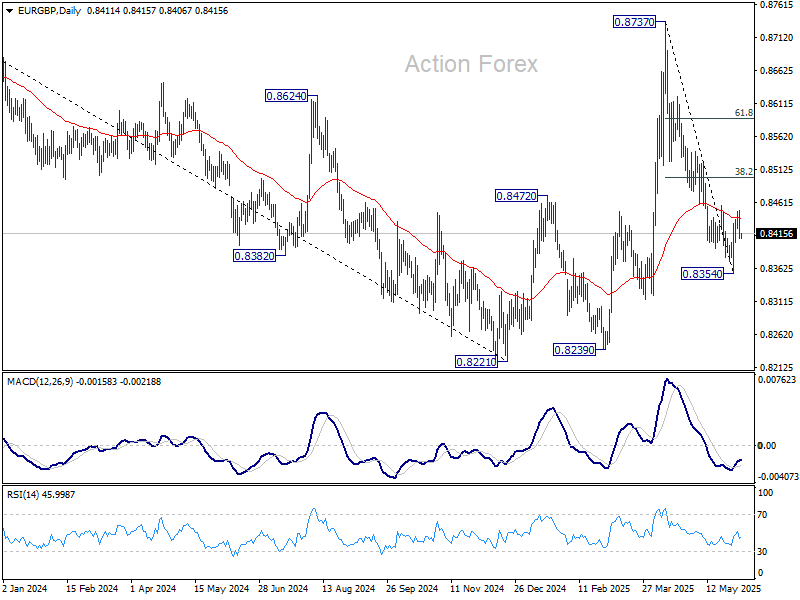
In the bigger picture, price actions from 0.8221 medium term bottom are merely forming a corrective pattern. There is no clear momentum to break through 0.8201 key support (2022 low) yet. Hence, range trading is expected between 0.8221/8737 for now.
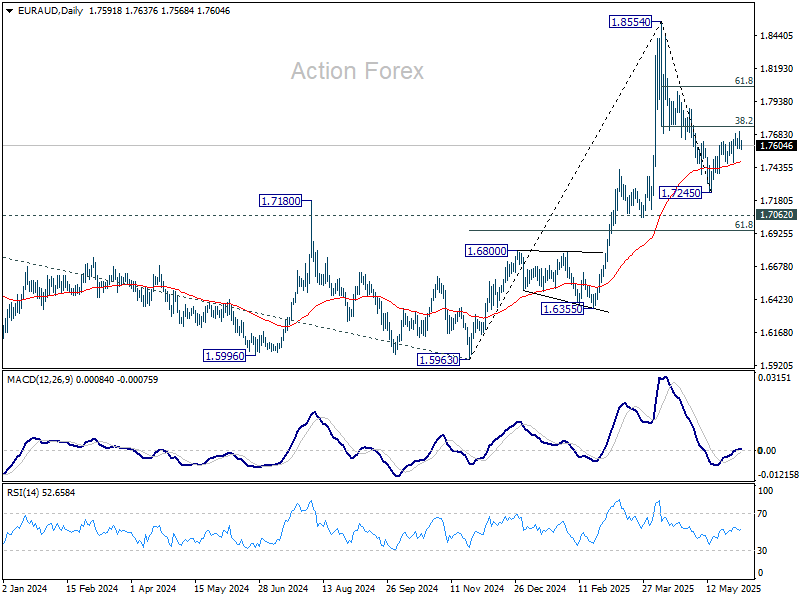
EUR/AUD Daily Outlook
Daily Pivots: (S1) 1.7551; (P) 1.7629; (R1) 1.7674; More...
EUR/AUD's rebound from 1.7245 lost momentum as seen in 4H MACD, and intraday bias is turned neutral. On the upside, firm break of 38.2% retracement of 1.8554 to 1.7245 at 1.7745 will solidify the case that fall from 1.8554 has completed as a correction. Next target is 61.8% retracement at 1.8054. On the downside, however, break of 1.7460 support will bring retest of 1.7245 instead.
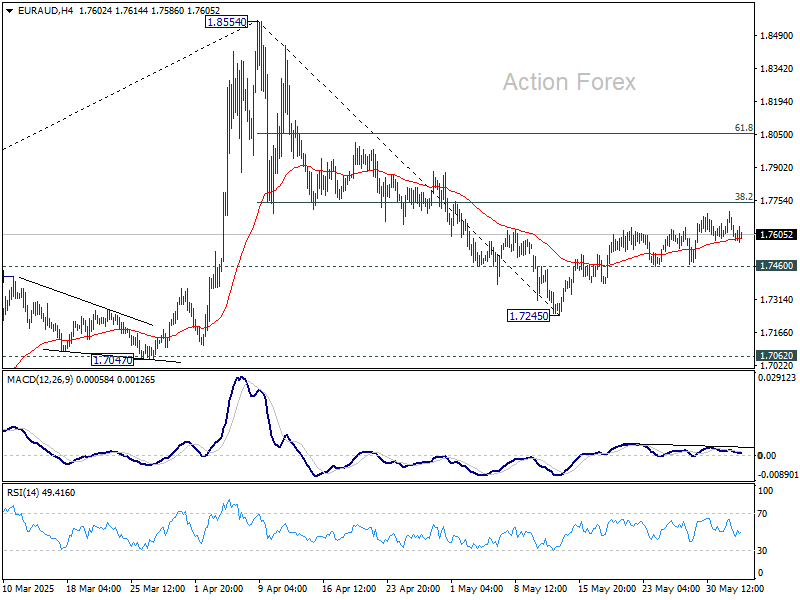
In the bigger picture, as long as 1.7062 resistance turned support (2023 high) holds, up trend from 1.4281 (2022 low) should still be in progress. Break of 1.8554 is expected after the whole corrective pattern from there completes. However, sustained break of 1.7062 will bring deeper fall back to 1.5963 support.
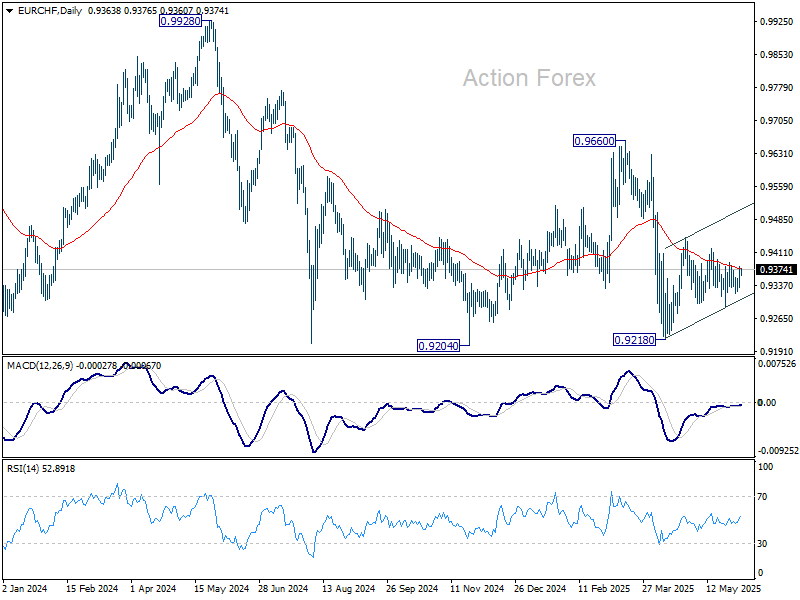
EUR/CHF Daily Outlook
Daily Pivots: (S1) 0.9343; (P) 0.9362; (R1) 0.9392; More....
Intraday bias in EUR/CHF remains neutral as range trading continues. Rise from 0.9218 might continue, either as a correction to fall from 0.9660, or the third leg of the pattern from 0.9204. On the upside, above 0.9419 will target 0.9445 resistance and above. Nevertheless, on the downside, firm break of 0.9291 will bring retest of 0.9218 low.
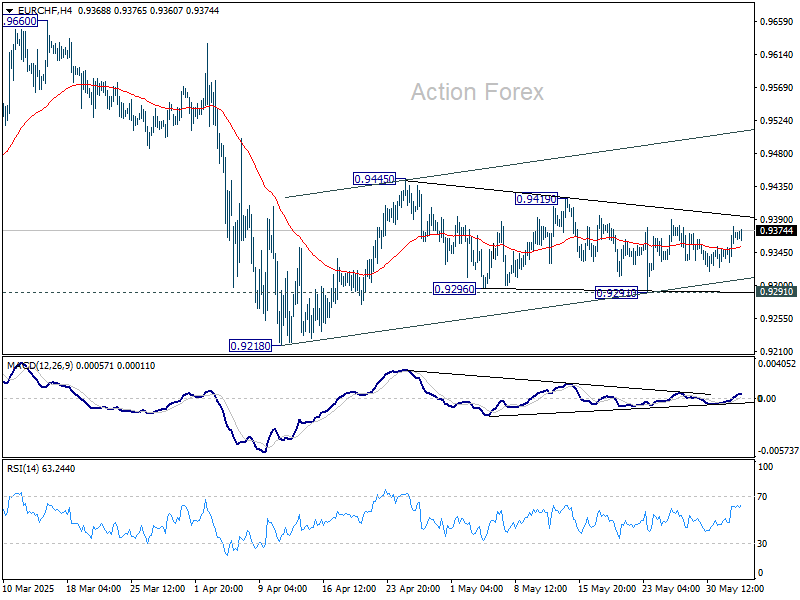
In the bigger picture, prior rejection by long-term falling channel resistance (now at 0.9527) retains medium term bearishness. That is, down trend from 1.2004 (2018 high) is still in progress. Firm break of 0.9204 (2024 low) will confirm resumption. This will remain the favored case as long as 0.9660 resistance holds.
EUR/USD Daily Outlook
Daily Pivots: (S1) 1.1338; (P) 1.1397; (R1) 1.1429; More...
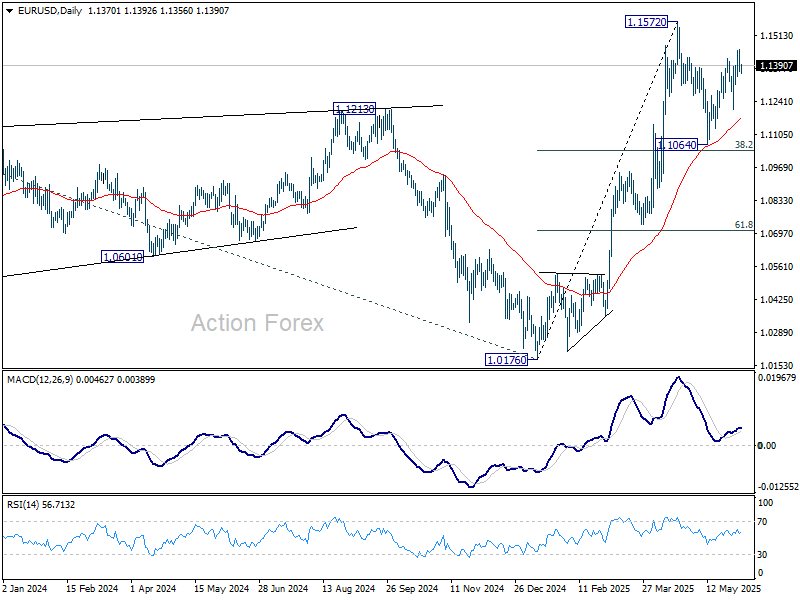
Intraday bias in EUR/USD remains neutral for the moment. Rebound from 1.1064 could extend higher, but strong resistance should be seen from 1.1572 to limit upside, at least on first attempt. On the downside, break of 1.1209 support will indicate that the corrective pattern from 1.1572 has started the third leg, and target 1.1064 support.
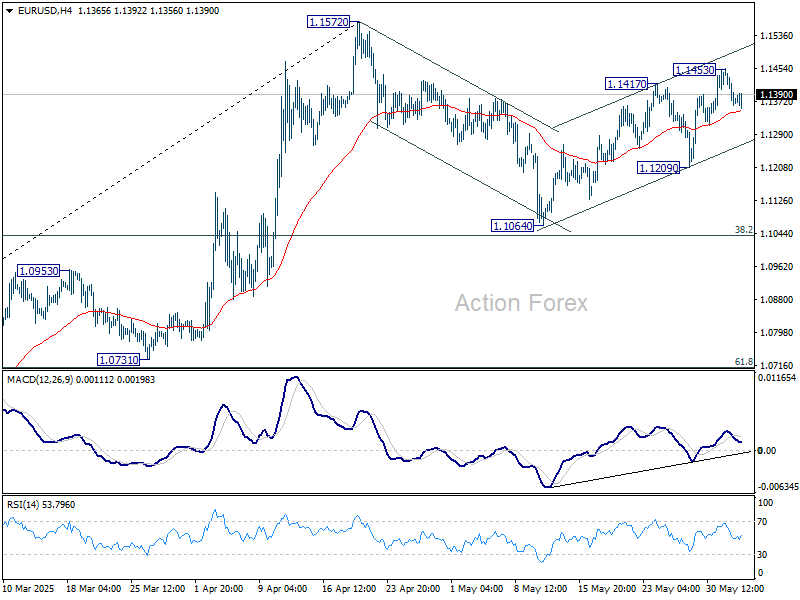
In the bigger picture, rise from 0.9534 long term bottom could be correcting the multi-decade downtrend or the start of a long term up trend. In either case, further rise should be seen to 100% projection of 0.9534 to 1.1274 from 1.0176 at 1.1916. This will now remain the favored case as long as 55 W EMA (now at 1.0856) holds.
GBP/USD Daily Outlook
Daily Pivots: (S1) 1.3488; (P) 1.3523; (R1) 1.3555; More...
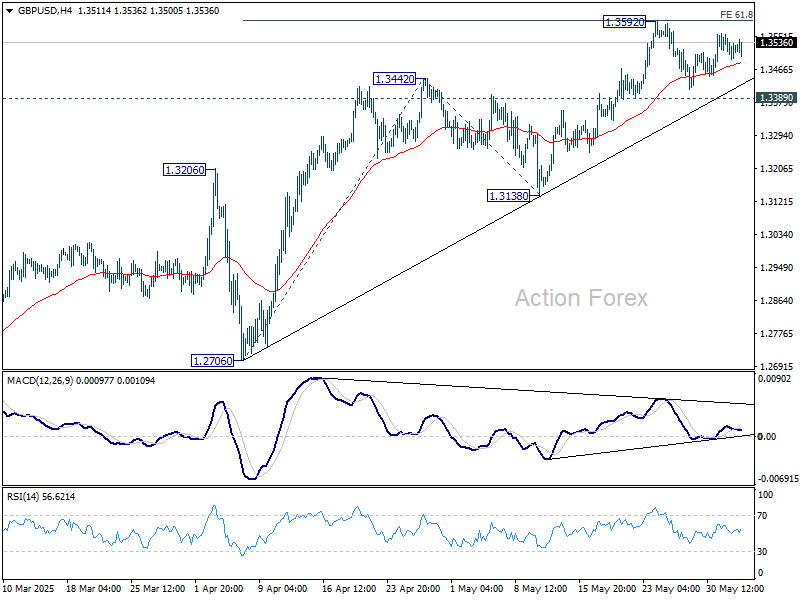
Intraday bias in GBP/USD remains neutral at this point. With 1.3389 support intact, further rise is expected. On the upside, firm break of 1.3592 will resume larger up trend to 100% projection of 1.2706 to 1.3442 from 1.3138 at 1.3874. However, decisive break of 1.3389 will confirm short term topping, and turn bias back to the downside for 1.3138 support instead.
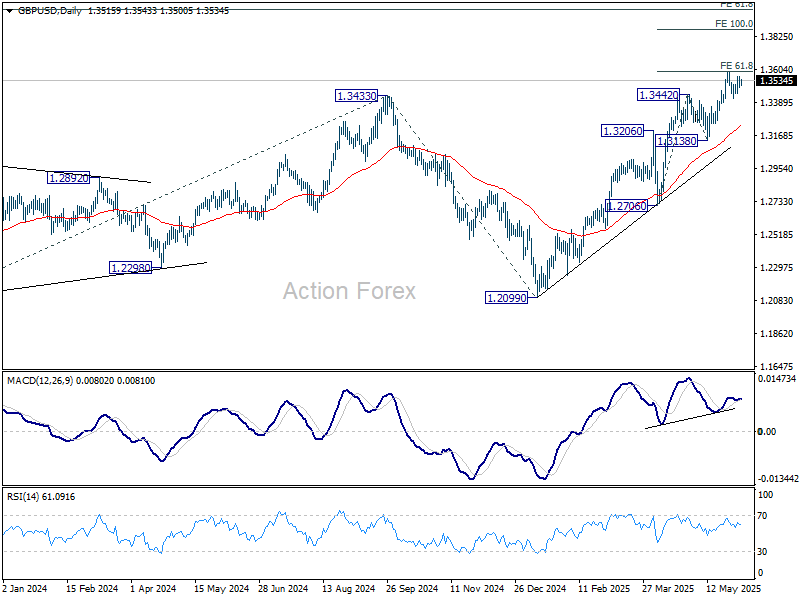
In the bigger picture, up trend from 1.3051 (2022 low) is in progress. Next medium term target is 61.8% projection of 1.0351 to 1.3433 from 1.2099 at 1.4004. Outlook will now stay bullish as long as 55 W EMA (now at 1.2866) holds, even in case of deep pullback.
USD/JPY Daily Outlook
Daily Pivots: (S1) 142.89; (P) 143.50; (R1) 144.62; More...
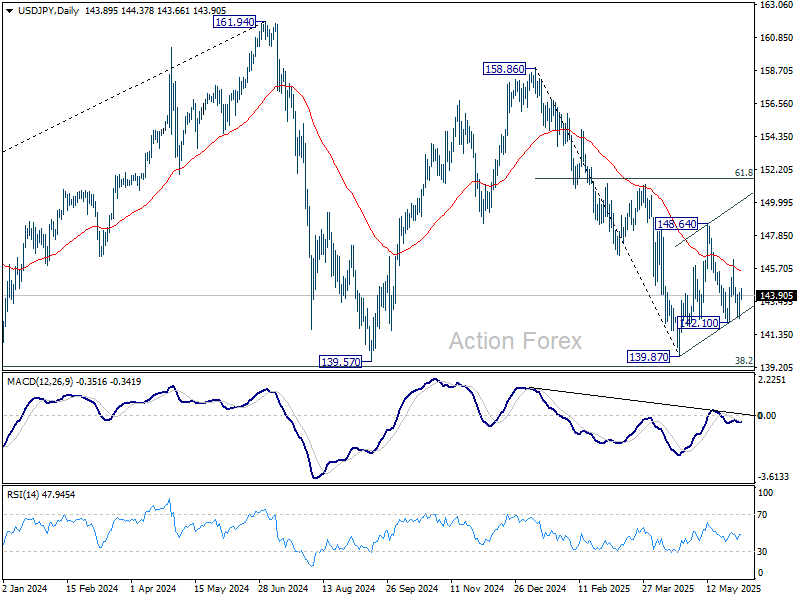
Intraday bias in USD/JPY stays neutral at this point. On the upside, above 146.27 will target 148.64 resistance first. Firm break there will resume the rebound from 139.87. Nevertheless, break of 142.10 will bring deeper fall back to 139.87 low.
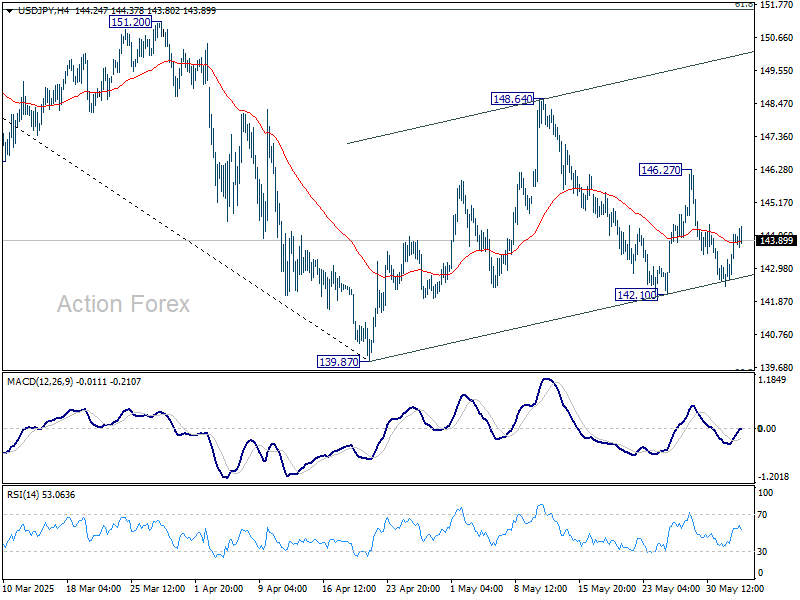
In the bigger picture, price actions from 161.94 are seen as a corrective pattern to rise from 102.58 (2021 low), with fall from 158.86 as the third leg. Strong support should be seen from 38.2% retracement of 102.58 to 161.94 at 139.26 to bring rebound. However, sustained break of 139.26 would open up deeper medium term decline to 61.8% retracement at 125.25.
USD/CHF Daily Outlook
Daily Pivots: (S1) 0.8184; (P) 0.8216; (R1) 0.8273; More….
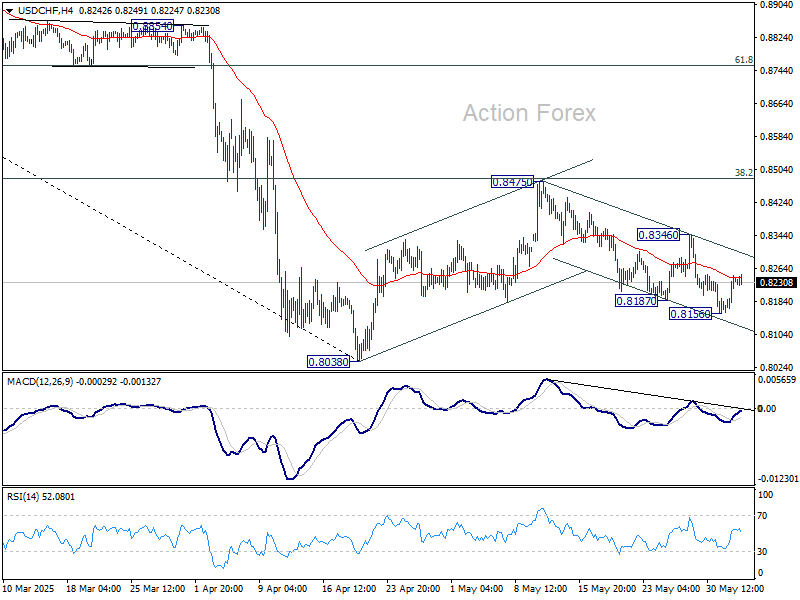
Intraday bias in USD/CHF remains neutral for the moment. . Fall from 0.8475 could still extend lower, and break of 0.8156 will target 0.8038 low. But strong support should be seen from there to bring rebound, at least on first attempt. On the upside, break of 0.8346 resistance will extend the corrective pattern from 0.8038 with another rising leg.
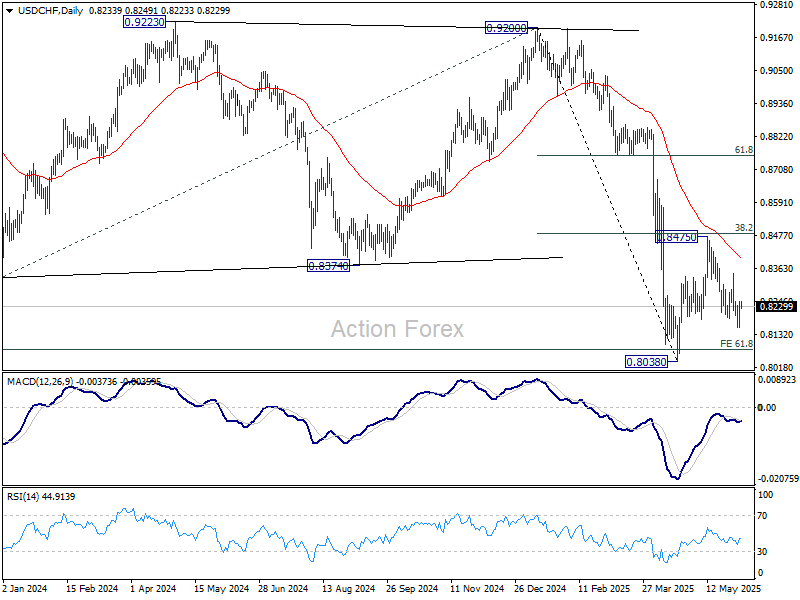
In the bigger picture, long term down trend from 1.0342 (2017 high) is still in progress and met 61.8% projection of 1.0146 (2022 high) to 0.8332 from 0.9200 at 0.8079 already. In any case, outlook will stay bearish as long as 55 W EMA (now at 0.8732) holds. Sustained break of 0.8079 will target 100% projection at 0.7382.
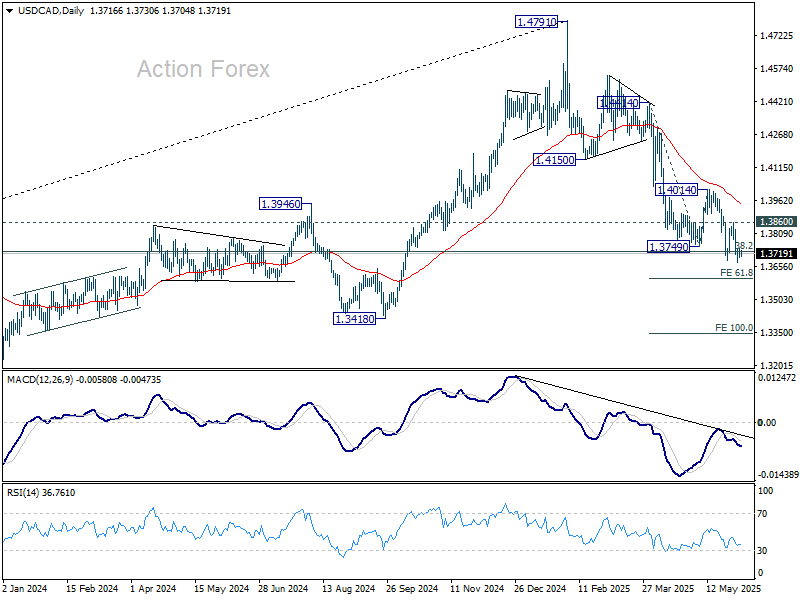
USD/CAD Daily Outlook
Daily Pivots: (S1) 1.3677; (P) 1.3710; (R1) 1.3745; More...
Intraday bias in USD/CAD remains on the downside this point. Current fall from 1.4791 should target 61.8% projection of 1.4414 to 1.3749 from 1.4014 at 1.3603. For now, outlook will stay bearish as long as 1.3860 resistance holds, in case of recovery.
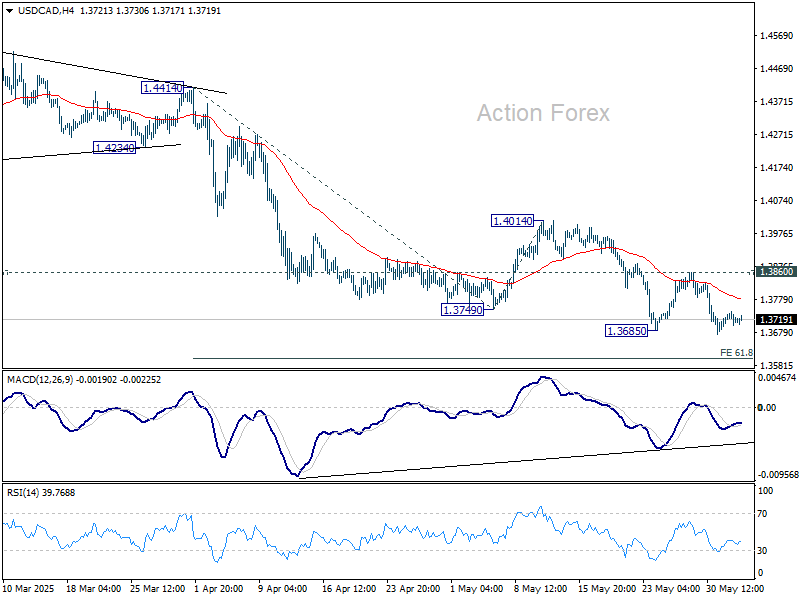
In the bigger picture, price actions from 1.4791 medium term top could either be a correction to rise from 1.2005 (2021 low), or trend reversal. In either case, further decline is expected as long as 1.4014 resistance holds. Firm break of 38.2% retracement of 1.2005 (2021 low) to 1.4791 at 1.3727 will pave the way back to 61.8% retracement at 1.3069.