
Sample Category Title
EUR/JPY Daily Outlook
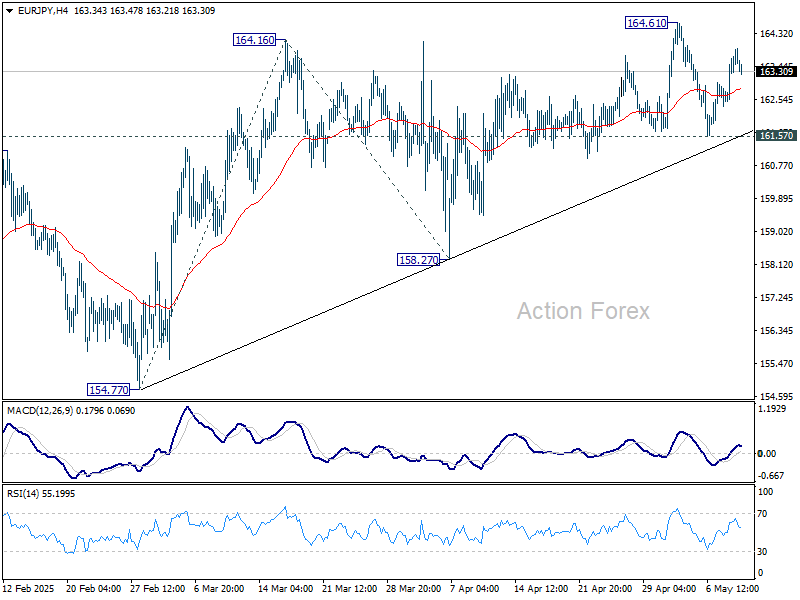
Daily Pivots: (S1) 162.92; (P) 163.41; (R1) 164.33; More...
Intraday bias in EUR/JPY remains neutral for the moment, and further rise is mildly in favor. On the upside, above 164.61 will resume the rise from 154.77 to 100% projection of 154.77 to 164.16 from 158.27 at 167.66. However, sustained break of 161.57 support will turn bias back to the downside for 158.27 instead.
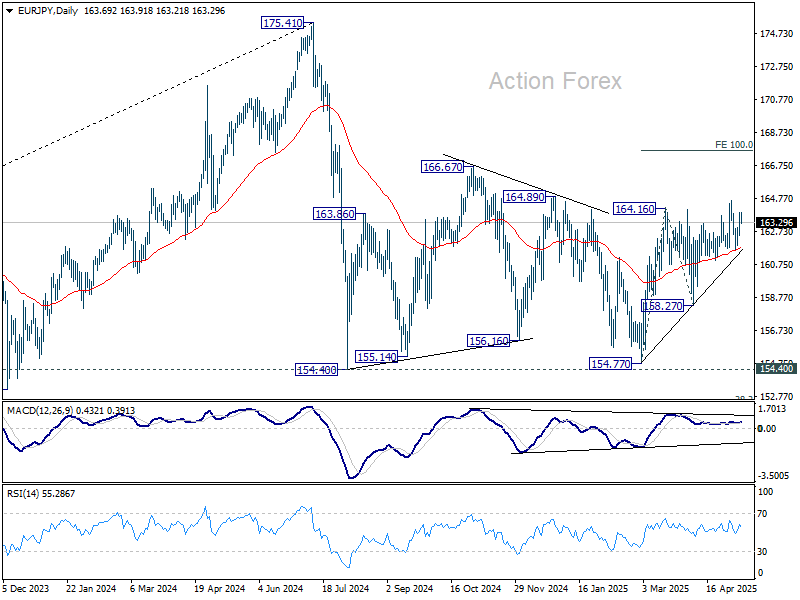
In the bigger picture, price actions from 175.41 are seen as correction to rally from 114.42 (2020 low). Strong support should be seen from 38.2% retracement of 114.42 to 175.41 at 152.11 to contain downside. However, sustained break of 152.11 will bring deeper fall even still as a correction.
EUR/GBP Daily Outlook
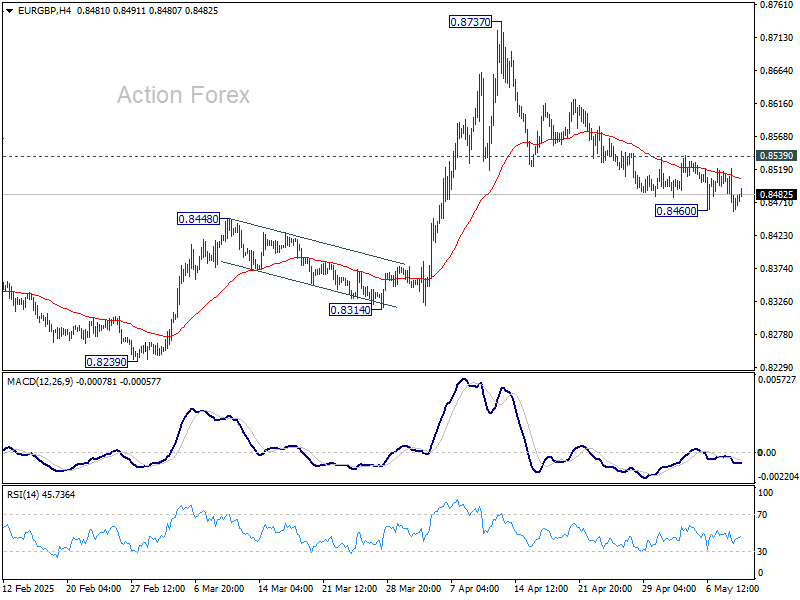
Daily Pivots: (S1) 0.8450; (P) 0.8486; (R1) 0.8512; More...
Intraday bias in EUR/GBP remains neutral first. On the upside, firm break of 0.8539 resistance will indicate that fall from 0.8737 has completed as a correction, after defending 55 D EMA (now at 0.8462). Intraday bias will be turned back to the upside for retest 0.8737 resistance. However, sustained trading below 55 D EMA will suggest that whole rise from 0.8221 has already complete and turn outlook bearish.
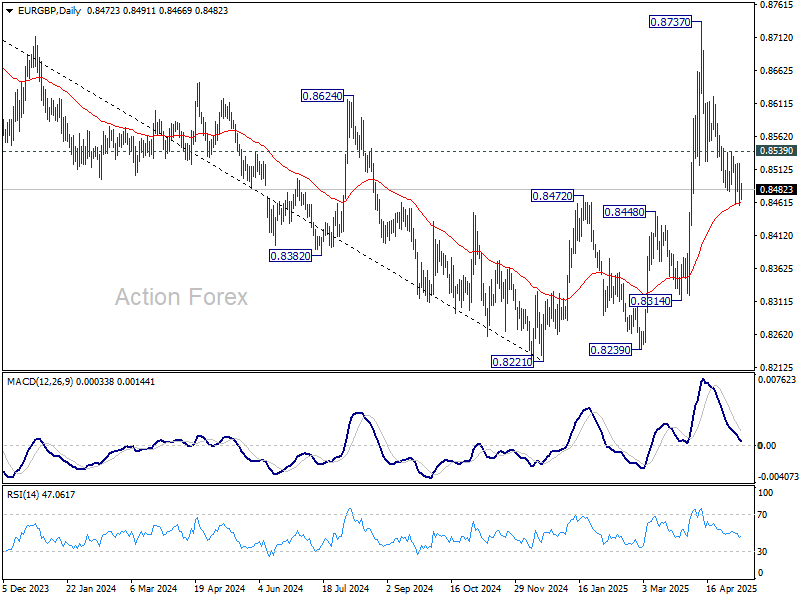
In the bigger picture, down trend from 0.9267 (2022 high) should have completed at 0.8221, just ahead of 0.9201 key support (2024 low). Rise from 0.8221 is likely reversing the whole fall. Further rise should be seen to 61.8% retracement of 0.9267 to 0.8221 at 0.8867 next. This will remain the favored case as long as 0.8472 resistance turned support holds. However, firm break of 0.8472 will argue that the down trend hasn't completed yet.
EUR/AUD Daily Outlook
Daily Pivots: (S1) 1.7490; (P) 1.7560; (R1) 1.7616; More...
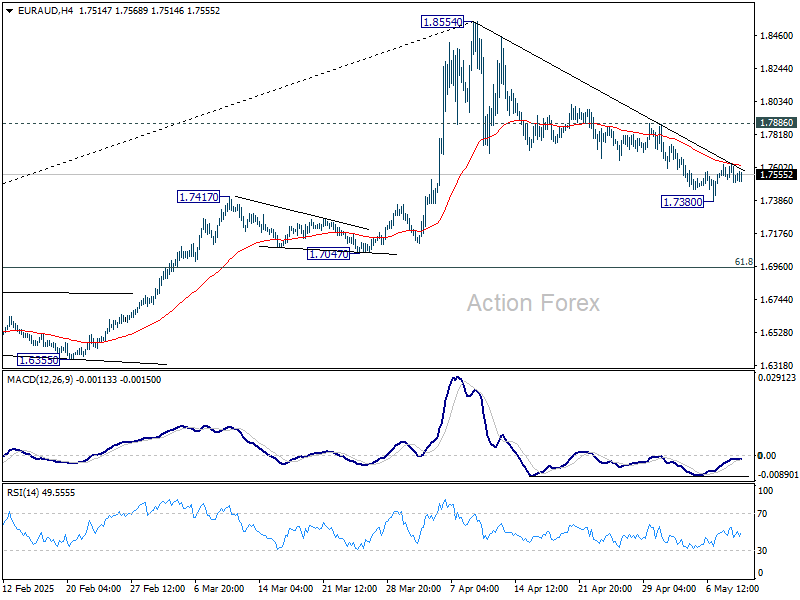
Intraday bias in EUR/AUD remains neutral for the moment. On the upside, firm break of 1.7886 resistance will argue that fall from 1.8553 has completed as a correction at 1.7380. Intraday bias will be turned back to the upside for retesting 1.8554. However, sustained trading below 55 D EMA (now at 1.7431) will target 61.8% retracement at 1.6953.
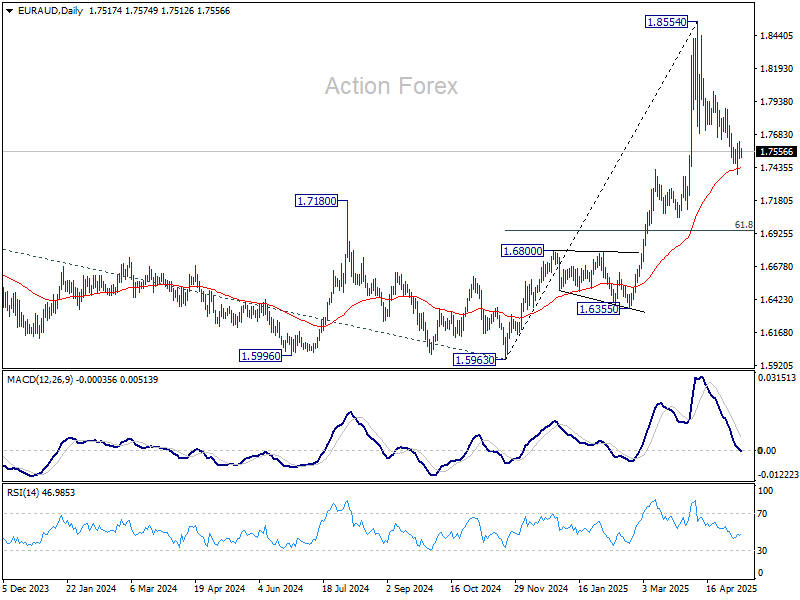
In the bigger picture, up trend from 1.4281 (2022 low) is in progress for 100% projection of 1.4281 to 1.7062 from 1.5963 at 1.8744. Firm break there will pave the way to 138.2% projection at 1.9806, which is close to 1.9799 (2020 high). Outlook will remain bullish as long as 1.7062 resistance turned support (2023 high) holds even in case of deep pullback.
EUR/CHF Daily Outlook
Daily Pivots: (S1) 0.9303; (P) 0.9326; (R1) 0.9362; More....
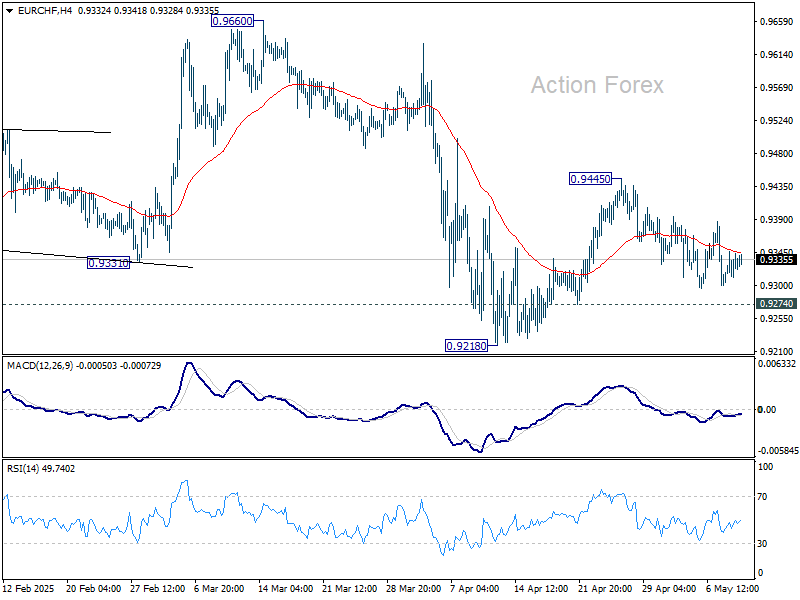
Range trading continues in EUR/CHF and intraday bias stays neutral. On the upside, above 0.9445 will resume the rebound from 0.9218, either as a corrective move or the third leg of the pattern from 0.9204. However, break of 0.9274 will suggest that that recovery has completed, and bring retest of 0.9204/18 support zone.
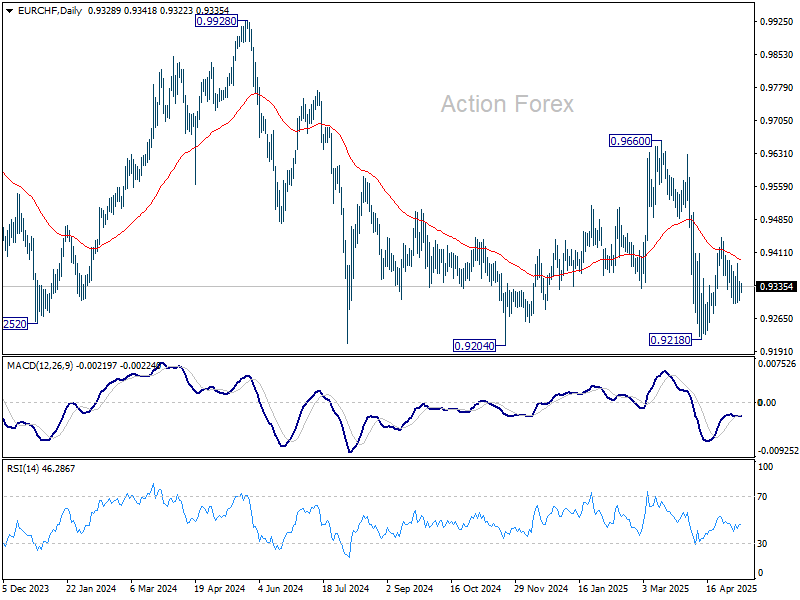
In the bigger picture, prior rejection by long-term falling channel resistance (now at 0.9555) retains medium term bearishness. That is, down trend from 1.2004 (2018 high) is still in progress. Firm break of 0.9204 (2024 low) will confirm resumption. This will remain the favored case as long as 0.9660 resistance holds.
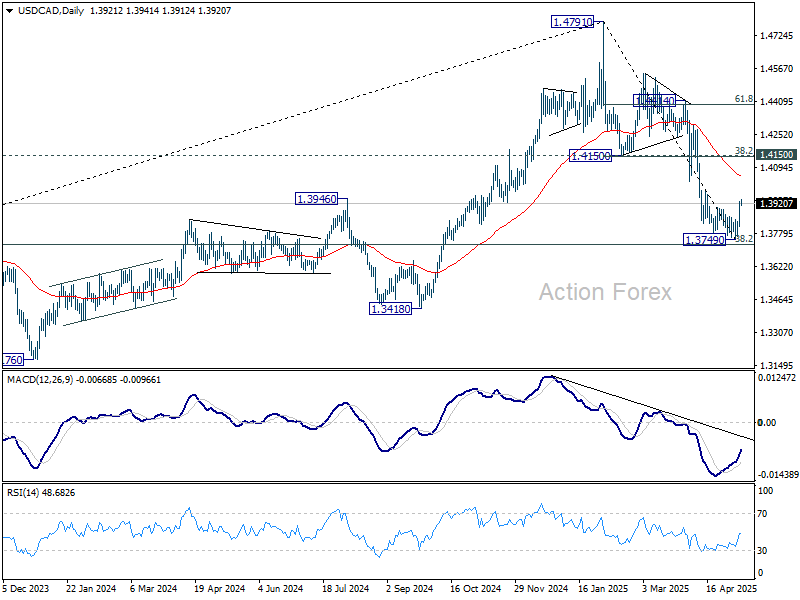
USD/CAD Daily Outlook
Daily Pivots: (S1) 1.3847; (P) 1.3890; (R1) 1.3966; More...
USD/CAD's break of 1.3903 resistance indicates short term bottoming at 1.3749, on bullish convergence condition in 4H MACD, ahead of 1.3727 fibonacci level. Intraday bias is back on the upside for 1.4150 cluster resistance (38.2% retracement of 1.4791 to 1.3749 at 1.4147). For now, risk will remain on the upside as long as 1.3749 holds, in case of retreat.
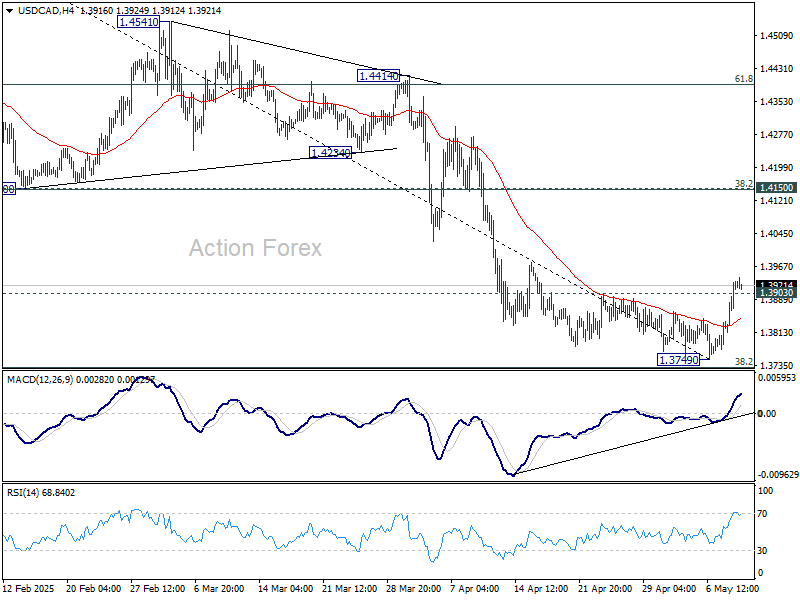
In the bigger picture, price actions from 1.4791 medium term top could either be a correction to rise from 1.2005 (2021 low), or trend reversal. In either case, further decline is expected as long as 1.4150 resistance turned support holds. Firm break of 38.2% retracement of 1.2005 (2021 low) to 1.4791 at 1.3727 will pave the way back to 61.8% retracement at 1.3069.
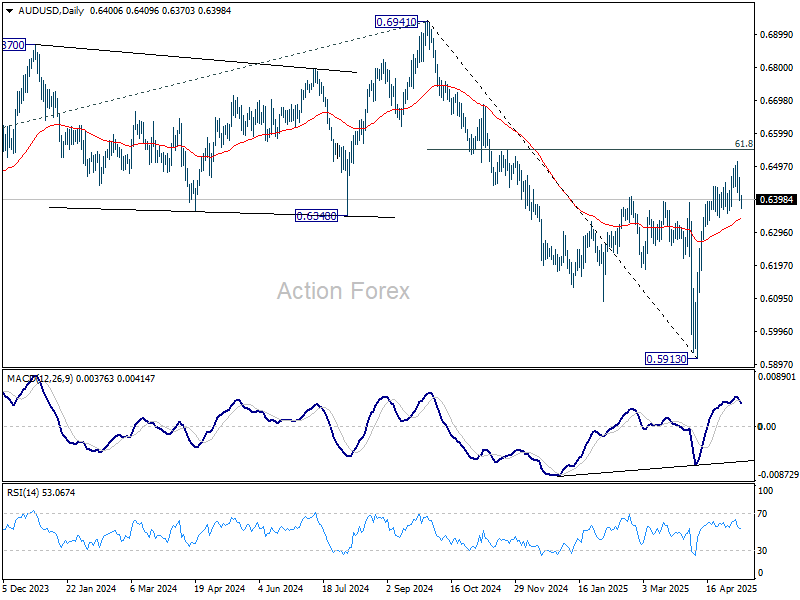
AUD/USD Daily Report
Daily Pivots: (S1) 0.6375; (P) 0.6420; (R1) 0.6445; More...
Intraday bias in AUD/USD remains neutral for the moment. On the upside, above 0.6511 will resume the rise from 0.5913 to 61.8% retracement of 0.6941 to 0.5913 at 0.6548. However, considering bearish divergence condition in 4H MACD, break of 0.6364 support should confirm short term topping. Intraday bias will be turned back to the downside for 38.2% retracement of 0.5913 to 0.6511 at 0.6283.
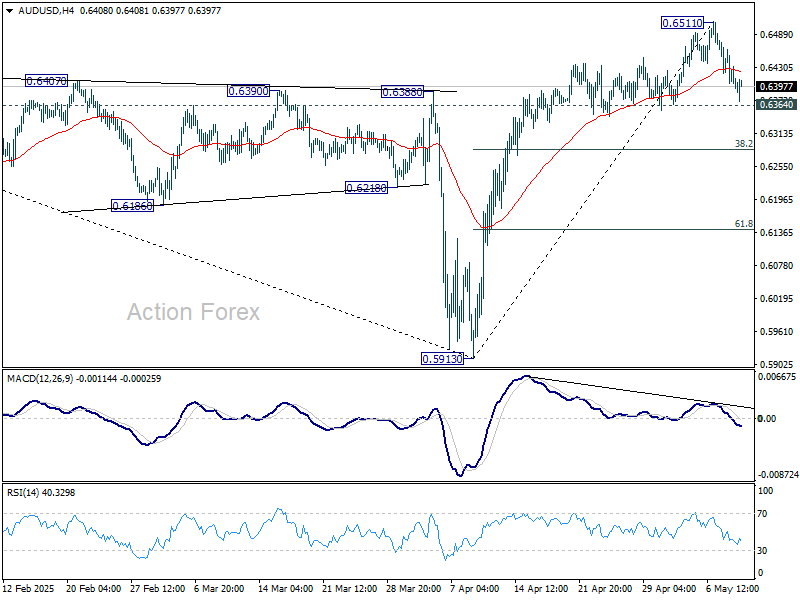
In the bigger picture, as long as 55 W EMA (now at 0.6443) holds, the down trend from 0.8006 (2021 high) should resume later to 61.8% projection of 0.8006 to 0.6169 from 0.6941 at 0.5806. However, sustained trading above 55 W EMA will argue that a medium term bottom was already formed, and set up further rebound to 0.6941 resistance instead.
USD/JPY Daily Outlook
Daily Pivots: (S1) 144.18; (P) 145.18; (R1) 146.91; More...
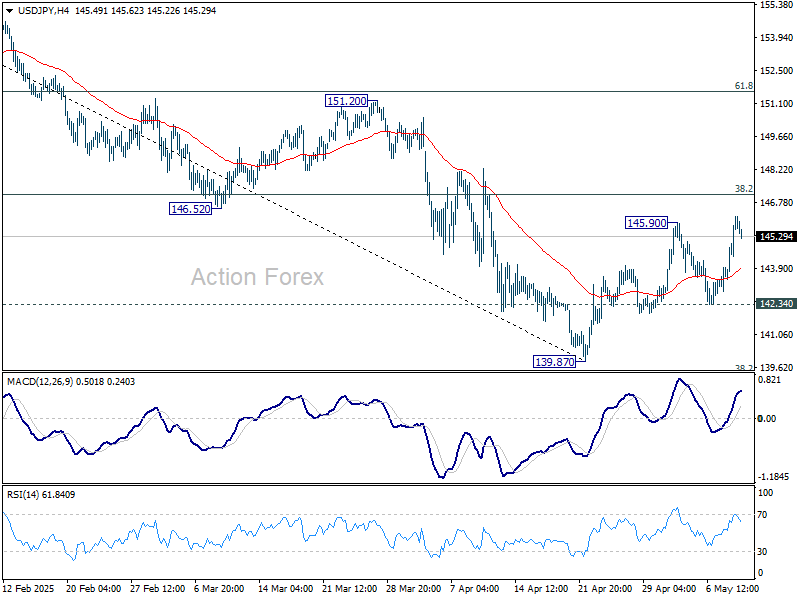
Intraday bias in USD/JPY is back on the upside with breach of 145.90 resistance. Rise from 139.87 is resuming for 38.2% retracement of 158.86 to 139.87 at 147.12. Rejection by 147.12 will retain near term bearishness. Break of 142.34 support will bring retest of 139.87. However, sustained break of 147.12 will indicate near term reversal, and target 61.8% retracement at 151.60.
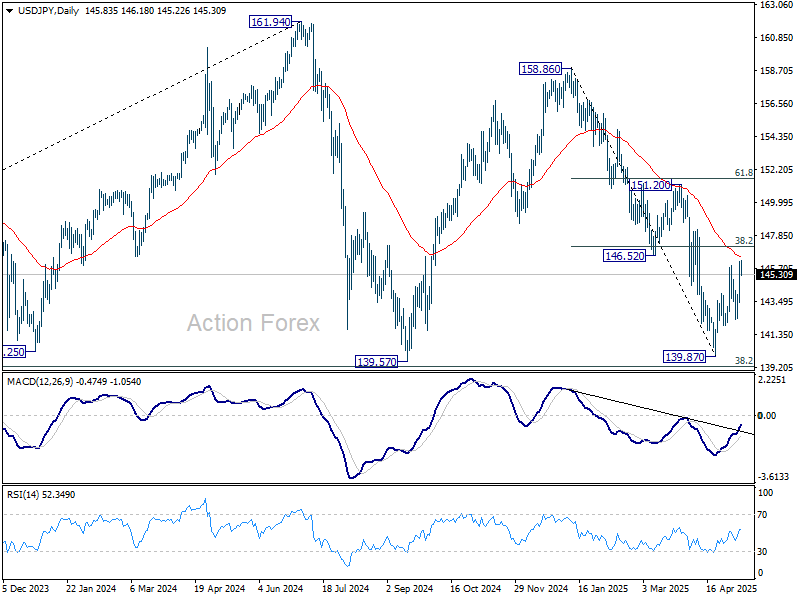
In the bigger picture, price actions from 161.94 are seen as a corrective pattern to rise from 102.58 (2021 low), with fall from 158.86 as the third leg. Strong support should be seen from 38.2% retracement of 102.58 to 161.94 at 139.26 to bring rebound. However, sustained break of 139.26 would open up deeper medium term decline to 61.8% retracement at 125.25.
USD/CHF Daily Outlook
Daily Pivots: (S1) 0.8250; (P) 0.8292; (R1) 0.8359; More….
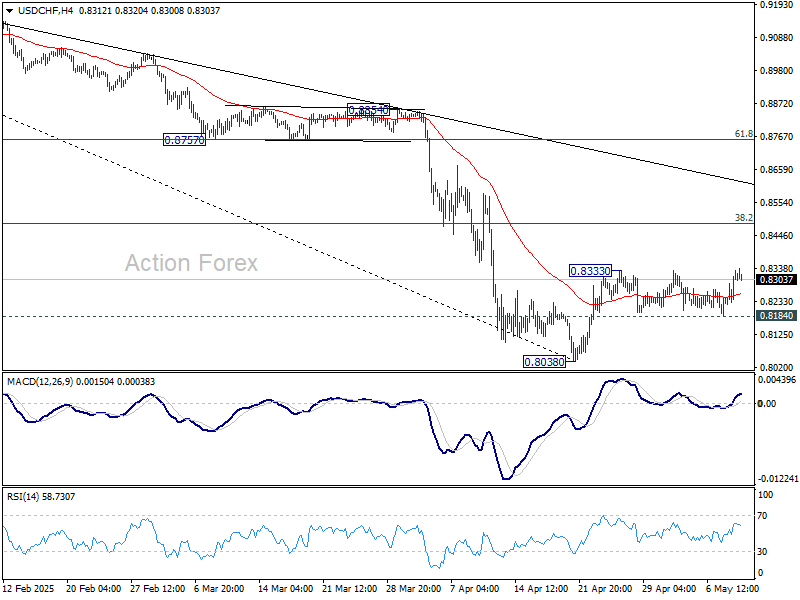
Intraday bias in USD/CHF remains neutral first. One the upside, firm break of 0.8333 will resume the rebound from 0.8038 to 38.2% retracement of 0.9200 to 0.8038 at 0.8482. But strong resistance should be seen there to limit upside. On the downside, sustained break of 0.8184 will bring retest of 0.8038.
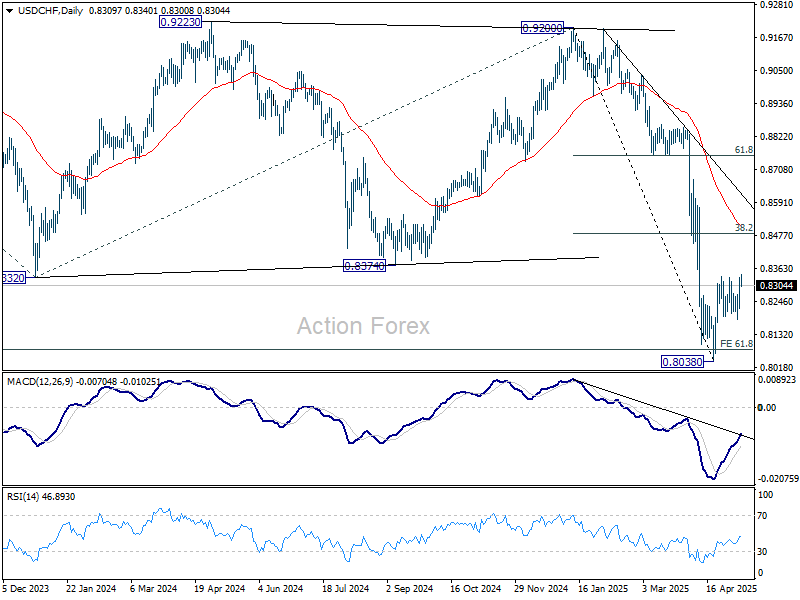
In the bigger picture, long term down trend from 1.0342 (2017 high) is still in progress and met 61.8% projection of 1.0146 (2022 high) to 0.8332 from 0.9200 at 0.8079 already. In any case, outlook will stay bearish as long as 55 W EMA (now at 0.8763) holds. Sustained break of 0.8079 will target 100% projection at 0.7382.
GBP/USD Daily Outlook
Daily Pivots: (S1) 1.3204; (P) 1.3280; (R1) 1.3324; More...
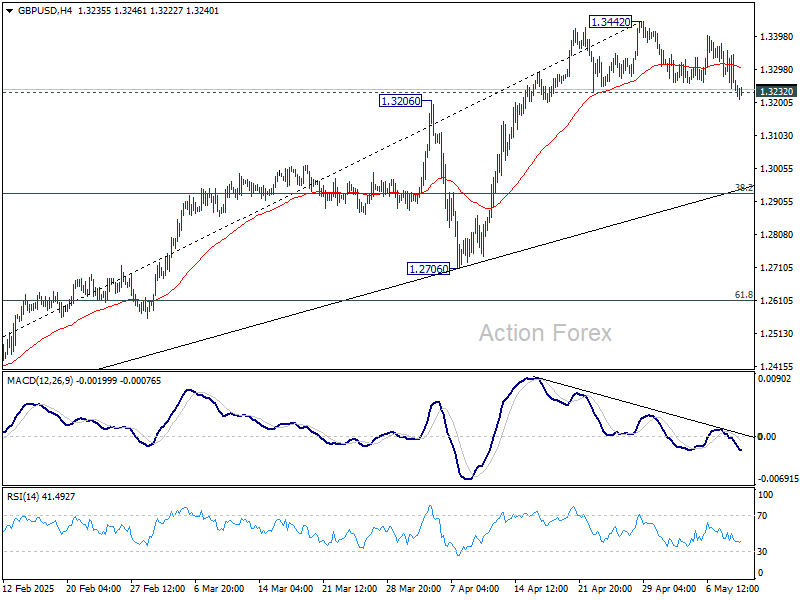
GBP/USD's breach of 1.3232 support indicates short term topping at 1.3442, after rejection by 1.3433 key resistance. Intraday bias is back on the downside for 55 D EMA (now at 1.3056). Firm break there will target 38.2% retracement of 1.2099 to 1.3442 at 1.2929. For now, risk will stay on the downside as long as 1.3442 resistance holds, in case of recovery.
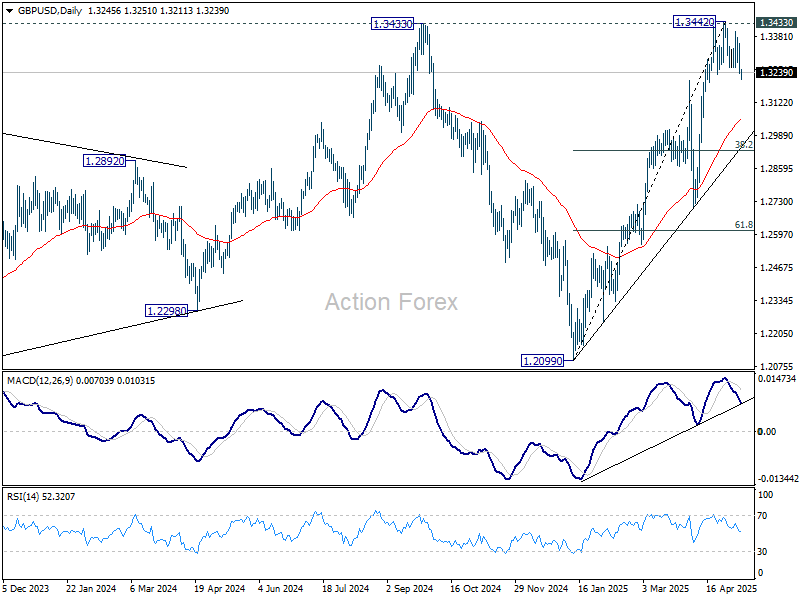
In the bigger picture, price actions from 1.3433 are seen as a corrective pattern to the up trend from 1.3051 (2022 low). Rise from 1.2099 could either be resuming the up trend, or the second leg of a consolidation pattern. Overall, GBP/USD should target 1.4248 key resistance (2021 high) on decisive break of 1.3433 at a later stage.
EUR/USD Lost First Support at 1.1274/76
Markets
Today’s thin eco calendar gives the opportunity to reflect on the past week’s events. First and foremost, the Fed extended its policy rate pause and indicated that the needle in the compass remains pointed at (upside) inflation (risks). The message kicked in yesterday with US yields rising by 7.5 bps (30-yr) to 12.1 bps (5-yr), the belly underperforming the wings. A weak $25bn 30-yr Bond auction contrasted with solid sales of 3-yr and 10-yr Treasuries earlier this week, but didn’t trigger any additional “panic” sales. The likes of Fed Barr, Kugler, Williams, Barkin, Goolsbee and Waller might elaborate on the decision and the Fed’s reaction function in scheduled speeches later today. The sell-off in US T’s also contrasted with the better performance of US equities and the dollar. Both profited from positive trade vibes, coming from the UK-US trade deal (“not a template”), but especially from US President Trump comments suggesting that tariffs against China could be lowered if talks go well. US Treasury Secretary Bessent and trade negotiator Greer meet with Chinese meet with Chinese vice premier He Lifeng in Geneva this weekend in first high-level talks since the trade escalation. The fentanyl issue serves as the icebreaker. Main US equity gauges rallied by up to 1% for Nasdaq. EUR/USD lost first support at 1.1274/76, providing room for a temporary return towards the 1.10-area. Medium-term, we stick to our view that the pair is in a technical buy-the-dip pattern. Monetary policy decisions in Sweden & Norway (status quo) and the Czech Republic & the UK (hawkish 25 bps rate cuts) are another reflection point. Central banks clearly stated that the huge amount of uncertainty actually numbs the short term decision making process. They align with the Powell view that it takes more data to see which risks to the growth and inflation outlook effectively materialize. In the case of the UK and the BoE, the MPC clearly downplayed the doom and gloom scenarios that some investors currently take into account. The UK Gilt curve bear flattened yesterday with yield rising by 6.5 bps (30-yr) to 12.4 bps (2-yr) as the BoE remains on a gradual (quarterly) rate cutting pace. EUR/GBP tested first support at 0.8474 and closed just above that handle. BoE governor Bailey and BoE chief economist Pill will today elaborate on the decision making process. Yesterday’s central bank outcomes put aggressive market pricing on future ECB policy, both from a timing and from a structural perspective, into doubt but didn’t trigger a real momentum change. Daily changes on the German curve varied between +5 and +6 bps yesterday.
News & Views
Chinese exports (USD terms) in April rose 8.1% y/y, way more than the 2% expected. April was the first month capturing the effects of the disruptive import tariffs announced on Liberation Day (April 2). That explains the low consensus bar. Chinese exports to the US indeed slumped around 20% but were compensated by a similar-sized increase to other Asian nations and by an 8% uptick to the EU. It’s expected that this rerouting will pick up in the coming months as well. Chinese imports from the US dropped by 14%, a consequence of the retaliatory Chinese import tariffs. Total imports fell 0.2% y/y compared to the -6% expected. China’s yuan weakens today in a move that already took place ahead of the data. USD/CNY rises for a third day straight to the 7.25 area, erasing a large part of the losses in the wake of the PBOC’s significantly lower fixing on Tuesday.
The Polish zloty yesterday appreciated towards EUR/PLN 4.25 from 4.27 after National Bank of Poland governor Glapinski explained Wednesday’s 50 bps rate cut in more detail. He said inflation has peaked and an improved CPI outlook allowed for some easing. But Glapinski warned the fight isn’t won yet and said the first rate cut since end 2023 doesn’t mean the start of a cycle. The central bank is now back at wait-and-see, he said, adding that future policy moves hinge on the July projection. Were the NBP to cut further, the governor suggested it would be by 25 bps rather than the 50 bps they did earlier this week. MPC member Kotecki in some comments this morning favours a total of 100 bps this year with a follow-up move preferably in September. Wnorowski weighed in as well, with July seen as the earliest possible occasion for another, normal-sized cut.