Sample Category Title
USD/CAD Daily Outlook
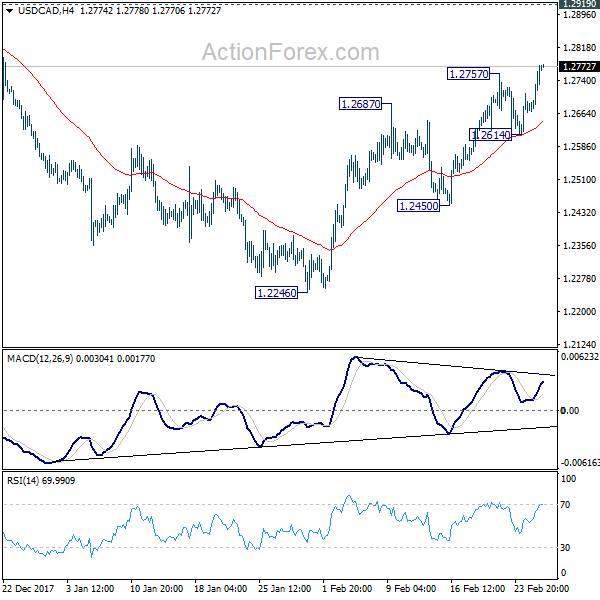
Daily Pivots: (S1) 1.2702; (P) 1.2739; (R1) 1.2811; More....
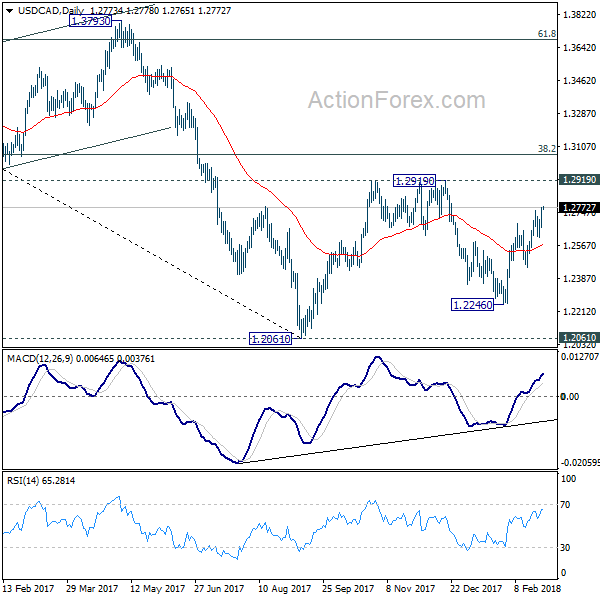
USD/CAD's rebound from 1.2246 resumed after brief consolidation. Intraday bias is back on the upside for 1.2919 key resistance. We'd be cautious on strong resistance from there to limit upside. But a firm there will carry larger bullish implication. On the downside, below 1.2614 minor support will turn bias to the downside for 1.2450 and below.
In the bigger picture, the rebound from 1.2246 is mixing up the medium term outlook. Nonetheless, USD/CAD is staying below falling 55 week EMA (now at 1.2771), hence, the bearish case is in favor. That is, fall from 1.4689 is not completed yet. Sustained break of 1.2061 key support will carry larger bearish implication and target 61.8% retracement of 0.9406 to 1.4689 at 1.1424. However, firm break of 1.2919 will revive the case of medium term reversal and turn outlook bullish.
AUD/USD Daily Outlook
Daily Pivots: (S1) 0.7758; (P) 0.7813; (R1) 0.7844; More...
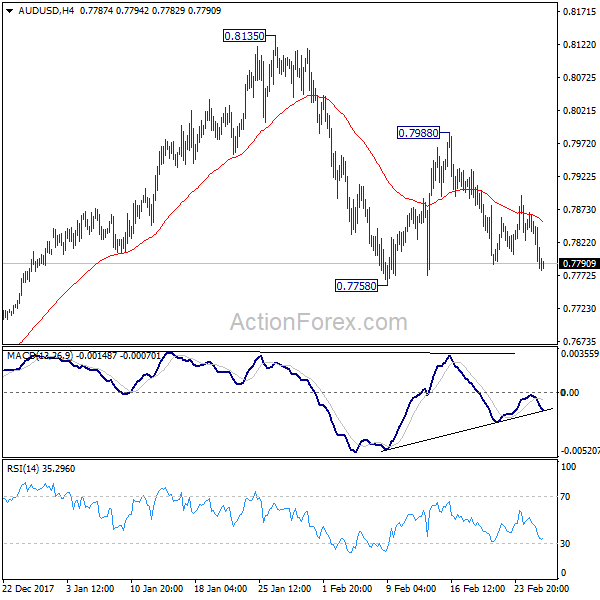
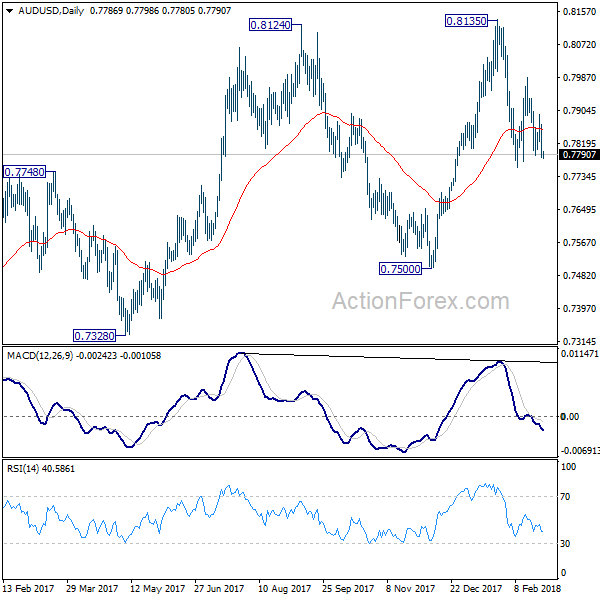
At this point, AUD/USD is still staying above 0.7758 support and intraday bias remains neutral. On the downside, below 0.7758 will resume the fall from 0.8135 and target 0.7500 key near term support. On the upside, above 0.7988 will extend the rebound to retest 0.8135. So far, there is no sign of range breakout yet and 0.7500/8135 could hold for a while.
In the bigger picture, medium term rebound from 0.6826 is seen as a corrective move. It might still extend higher but we'd expect strong resistance from 38.2% retracement of 1.1079 to 0.6826 at 0.8451 to limit upside to bring long term down trend resumption. On the downside, break of 0.7500 support will now be an important signal that such corrective rebound is completed.
USD/JPY Daily Outlook
Daily Pivots: (S1) 106.84; (P) 107.25; (R1) 107.74; More...
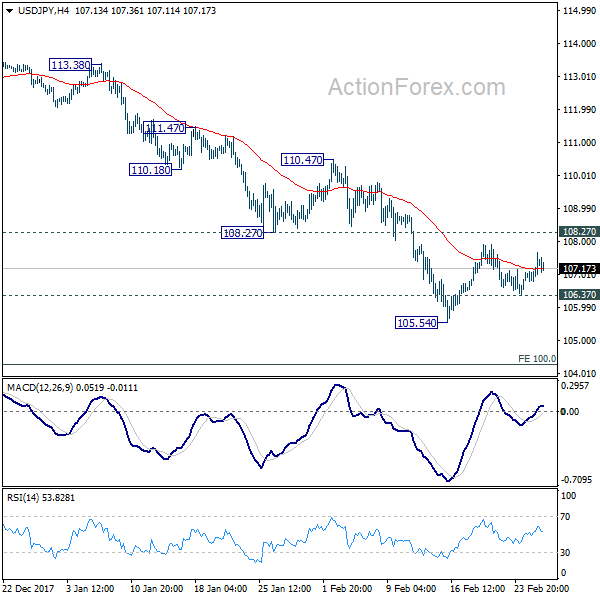
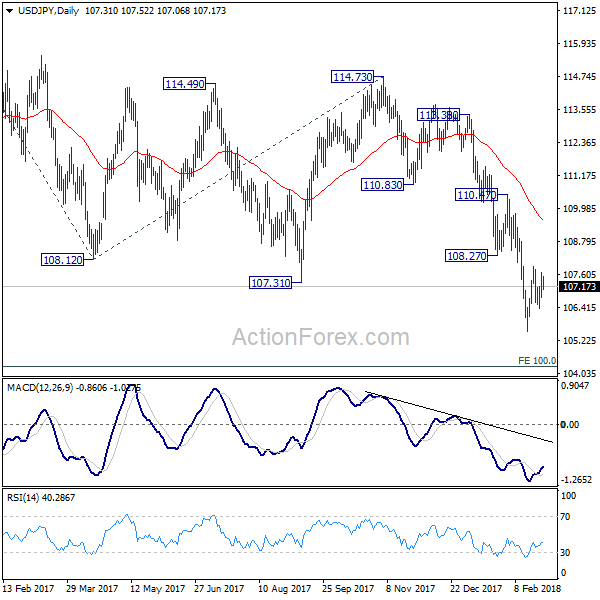
Intraday bias in USD/JPY remains neutral as range trading continues. On the upside, break of 108.27 will be the first sign of near term reversal and will target 110.47 resistance for confirmation. On the downside, below 106.37 minor support will bring retest of 105.54 low. Break of 105.54 will extend the larger decline from 118.65 and target 100% projection of 118.65 to 108.12 from 114.73 at 104.20 next.
In the bigger picture, current development argues that the corrective pattern from 118.65 is extending. The solid break of 61.8% retracement of 98.97 to 118.65 at 106.48 now suggests that the pattern from 125.85 high is possibly extending. Deeper fall could be seen through 98.97 key support (2016 low). This bearish case will now be favored as long as 110.47 resistance holds.
USD/CHF Daily Outlook
Daily Pivots: (S1) 0.9359; (P) 0.9388; (R1) 0.9417; More...
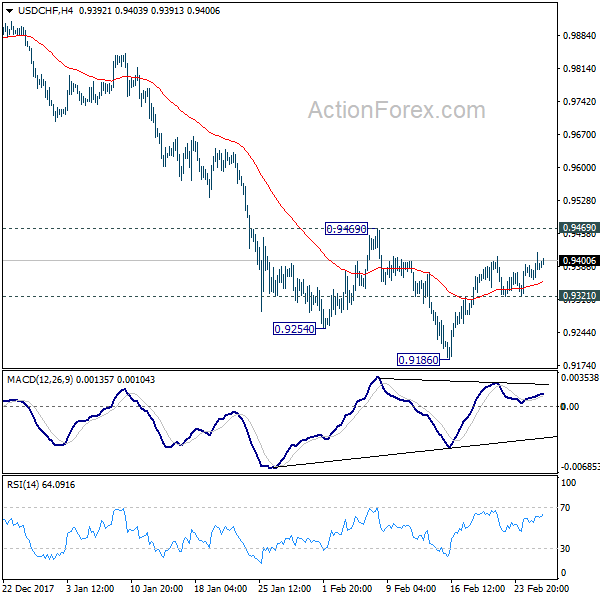
USD/CHF's rebound form 0.9186 extends higher but it's still limited below 0.9469 resistance. Intraday bias remains neutral at this point. On the upside, considering bullish convergence condition in 4 hour MACD, break of 0.9469 will indicate near term reversal and turn outlook bullish for 55 day EMA (now at 0.9513) and above. On the downside, below 0.9321 minor support will bring retest of 0.9186. Break there will extend the larger down trend to 0.9115 medium term projection level next.
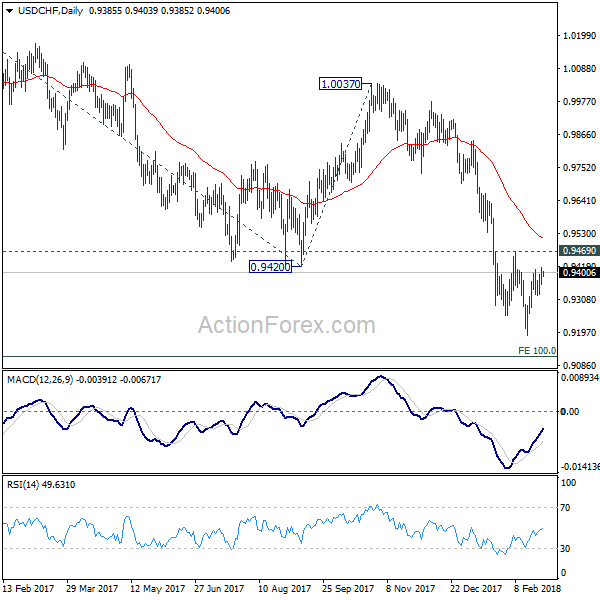
In the bigger picture, fall from 1.0342 is seen as a medium term down trend. Deeper decline should be seen to 100% projection of 1.0342 to 0.9420 from 1.0037 at 0.9115. Break will target 161.8% projection at 0.8545. In any case, sustained trading above 55 day EMA is needed to be the first sign of medium term reversal. Otherwise, outlook will stay bearish even in case of strong rebound.
GBP/USD Daily Outlook
Daily Pivots: (S1) 1.3845; (P) 1.3921; (R1) 1.3984; More....
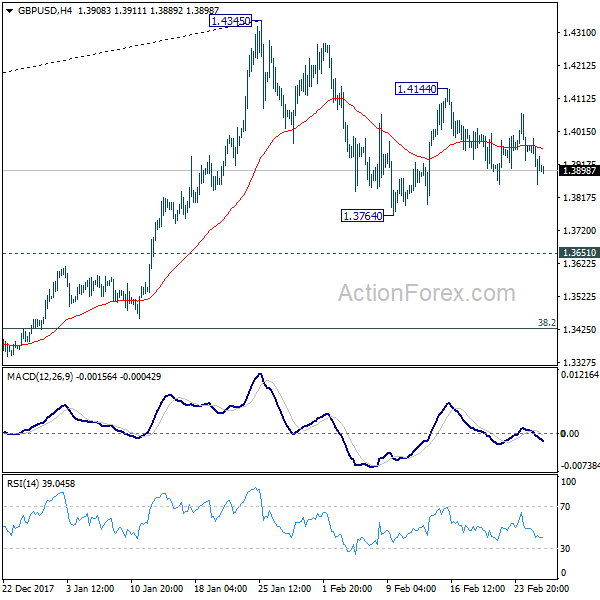
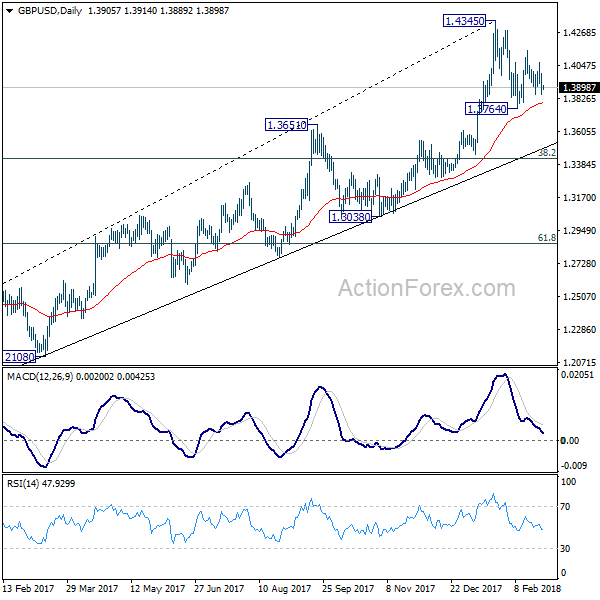
Intraday bias in GBP/USD remains neutral as it's bounded in range of 1.3764/4144. On the upside, break of 1.4144 will extend the rise from 1.3764 and target a test on 1.4345 resistance. Break there will resume larger up trend and target long term trend line resistance (now at 1.5056). On the downside, below 1.3764 will extend the correction from 1.4345 to 1.3651 resistance turned support instead.
In the bigger picture, as long as 1.3038 support holds, medium term outlook in GBP/USD will remains bullish. Rise from 1.1946 is at least correcting the long term down from 2007 high at 2.1161. Further rally would be seen back to 38.2% retracement of 2.1161 (2007 high) to 1.1946 (2016 low) at 1.5466. However, GBP/USD fails to sustain above 55 month EMA (now at 1.4279) so far. Break of 1.3038 support, will suggests that rise from 1.1946 has completed and will turn outlook bearish for retesting this low.
EUR/USD Daily Outlook
Daily Pivots: (S1) 1.2187; (P) 1.2266 (R1) 1.2312; More....
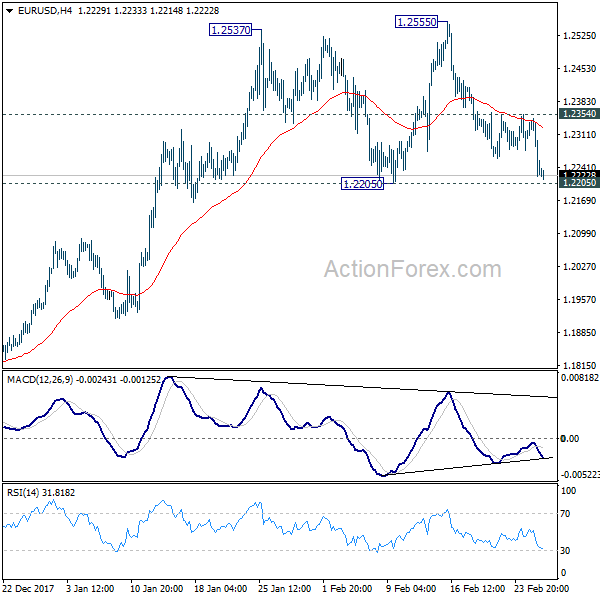
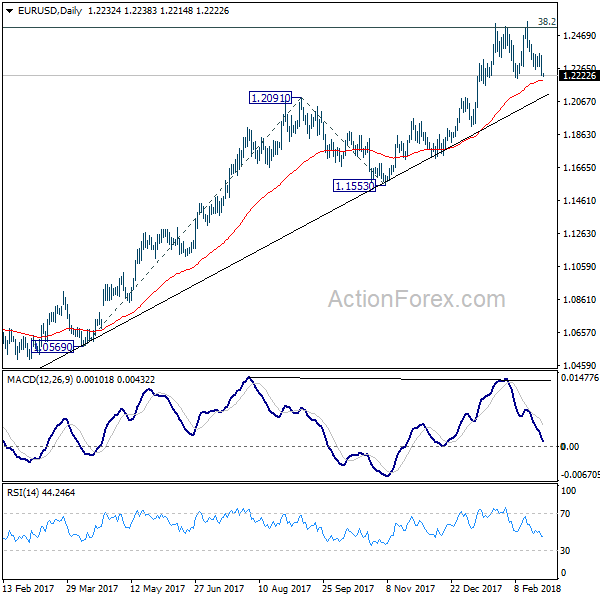
EUR/USD drops to as low as 1.2214 so far but it's still staying above 1.2205 key near term support. Intraday bias remains neutral at this point. As noted before, break of this important 1.2205 support will confirm rejection by 1.2516 key fibonacci level and trend reversal. IN that case, further decline should be seen back to 1.1553 support next. On the upside, above 1.2354 minor resistance will bring retest of 1.2555 high. Break of 1.2555 will revive the bullish case of up trend resumption and target 100% projection of 1.0569 to 1.2091 from 1.1553 at 1.3075.
In the bigger picture, key fibonacci level at 38.2% retracement of 1.6039 (2008 high) to 1.0339 (2017 low) at 1.2516 remains intact despite attempts to break. Hence, rise from 1.0339 medium term bottom is still seen as a corrective move for the moment. Rejection from 1.2516 will maintain long term bearish outlook and keep the case for retesting 1.0039 alive. However, sustained break of 1.2516 will carry larger bullish implication and target 61.8% retracement of 1.6039 to 1.0339 at 1.3862.
Dollar Jumped, Yields Surged, Stocks Tumbled after Fed Powell’s Upbeat Q&A
The initial response to Jerome Powell's first Congressional Testimony as Fed Chair was muted as his prepared speech provided nothing new. Nonetheless, stocks tumbled while Dollar surged as Powell offered an upbeat outlook in his Q&A. There are notable increase in chance of continuous rate hikes towards the end of the year as indicated by fed fund futures. DOW ended down -299.24 pts or -1.16% at 25410.03. S&P 500 dropped -35.32 pts or -1.27% to close at 2744.28. 10 year yield regained 2.9 handle by rising 0.049 to 2.908. Dollar index jumped to as high as 90.49 and is heading back towards 91.01 key structural resistance.
In the currency markets, Dollar is now trading as the strongest major currency for the week, followed by Yen and then Swiss Franc. Commodity currencies are the weakest ones. Nonetheless, we'd like to point out that Dollar is still holding below recent resistance against other currencies. The key levels are 1.2205 support in EUR/USD, 1.3764 in GBP/USD, 0.7758 in AUD/USD, 0.9469 resistance in USD/CHF and 108.27 in USD/JPY.
Fed Powell: Economy has strengthened since December
Described by some analysts as direct and forthcoming, Powell offered his optimistic view on the economic outlook. He told the House Financial services Committee that "my personal outlook for the economy has strengthened since December." And, "we've seen some data that will in my case add some confidence to my view that inflation is moving up to target. We've also seen continued strength around the globe, and we've seen fiscal policy become more stimulative."
Powell acknowledged that "fiscal policy changes can have an effect, changes of this size can have an effect, and that can be seen in the path of policy." But he added that "it's very hard to say in advance what that would be."
The key take away from his prepared speech is regarding recent financial market volatility. He said "we do not see these developments as weighing heavily on the outlook for economic activity, the labor market and inflation." This suggested the path is unlikely to be altered by the market volatility.
Let's take a look at fed fund futures pricing. They're now indicating 33.7% chance of a total of four hikes by December to raise the federal funds rate from 1.25-1.50% to 2.25-2.50%. That's notably higher than 26.9% a day ago and 22.6% a month ago.
UK Gfk consumer confidence stayed negative
UK Gfk consumer confidence dropped to -10 in February, down from -9. The series has not be positive since February 2016. Gfk noted that "ongoing concerns about sluggish household income, rising prices paid by consumers in the shops and the prospect of inflation-busting council tax and interest rate hikes has dented confidence after last month's surprising rally". And, "the two-year trend of negative sentiment proves consumers feel pessimistic about the state of household finances and the wider UK economy." "Consumers have good reason to feel jittery and depressed." BRC shop price index dropped -0.8% yoy in February.
NAB forecasts one RBA hike in 2018, instead of two
In Australia, the National Australia Bank lowered its RBA interest rate forecast for the year. NAB now expects only one RBA hike this year, instead of two. The bank said in its report that "weak wages growth and slow progress reducing unemployment means it is now less likely that the RBA will raise rates twice in 2018." It explained that "while total wages did increase a touch 0.55%, there was no acceleration in private wages growth." Nonetheless, "wage increases are overdue" and " tightness in employers' ability to find suitable labour, may finally see private sector wages start to moderately edge up." And, "we now see the RBA raising rates only once in late 2018 with November 2018 as the most likely start date for a gradual RBA rate hiking cycle." However, there is still a change for RBA to stand pat depending on data flow.
New Zealand business confidence stayed pessimistic
New Zealand ANZ business confidence improved to -19.0 in February, up from -37.8. That is, a net 19% of business were pessimistic about the year ahead. ANZ noted in the release that "a slower housing market, a small dip in net migration, difficulty finding credit and already-stretched construction and tourism sectors are making acceleration hard work from here." Meanwhile, "strong terms of trade and a positive outlook for wage growth are providing a push." And, "the rebound in business confidence is consistent with our belief that while no longer at top speed, this business cycle has legs yet. In particular, incomes are set to be supported by the strong terms of trade and higher wage growth."
Elsewhere
Japan retail sales rose 1.6% yoy in January versus expectation of 2.5% yoy. Japan industrial production dropped -6.6% mom in January versus expectation of -4.2% mom. China manufacturing PMI dropped to 50.3 in February, down from 51.3, missed expectation of 51.2. China non-manufacturing PMI dropped to 54.4, down from 55.3, missed expectation of 55.0.
Looking ahead
Eurozone CPI flash will be a major focus in European session. Germany will release unemployment and Gfk consumer sentiment. Swiss will release KOF leading indicator. Laster in the day, US will release GDP revision, Chicago PMI, pending home sales. Canada will release IPPI and RMPI.
EUR/USD Daily Outlook
Daily Pivots: (S1) 1.2187; (P) 1.2266 (R1) 1.2312; More....
EUR/USD drops to as low as 1.2214 so far but it's still staying above 1.2205 key near term support. Intraday bias remains neutral at this point. As noted before, break of this important 1.2205 support will confirm rejection by 1.2516 key fibonacci level and trend reversal. IN that case, further decline should be seen back to 1.1553 support next. On the upside, above 1.2354 minor resistance will bring retest of 1.2555 high. Break of 1.2555 will revive the bullish case of up trend resumption and target 100% projection of 1.0569 to 1.2091 from 1.1553 at 1.3075.
In the bigger picture, key fibonacci level at 38.2% retracement of 1.6039 (2008 high) to 1.0339 (2017 low) at 1.2516 remains intact despite attempts to break. Hence, rise from 1.0339 medium term bottom is still seen as a corrective move for the moment. Rejection from 1.2516 will maintain long term bearish outlook and keep the case for retesting 1.0039 alive. However, sustained break of 1.2516 will carry larger bullish implication and target 61.8% retracement of 1.6039 to 1.0339 at 1.3862.
Economic Indicators Update
| GMT | Ccy | Events | Actual | Forecast | Previous | Revised |
|---|---|---|---|---|---|---|
| 23:50 | JPY | Retail Trade Y/Y Jan | 1.60% | 2.50% | 3.60% | |
| 23:50 | JPY | Industrial Production M/M Jan P | -6.60% | -4.20% | 2.90% | |
| 0:00 | NZD | ANZ Business Confidence Feb | -19.0 | -37.8 | ||
| 0:01 | GBP | GfK Consumer Confidence Feb | -10 | -10 | -9 | |
| 0:01 | GBP | BRC Shop Price Index Y/Y Feb | -0.80% | -0.60% | -0.50% | |
| 1:00 | CNY | Manufacturing PMI Feb | 50.3 | 51.2 | 51.3 | |
| 1:00 | CNY | Non-manufacturing PMI Feb | 54.4 | 55 | 55.3 | |
| 5:00 | JPY | Housing Starts Y/Y Jan | -4.70% | -2.10% | ||
| 7:00 | EUR | German GfK Consumer Confidence Mar | 10.9 | 11 | ||
| 7:45 | EUR | French GDP Q/Q Q4 P | 0.60% | 0.60% | ||
| 7:45 | EUR | French GDP Y/Y Q4 P | 2.40% | 2.40% | ||
| 8:00 | CHF | KOF Leading Indicator Feb | 106 | 106.9 | ||
| 8:55 | EUR | German Unemployment Change Feb | -17K | -25K | ||
| 8:55 | EUR | German Unemployment Rate Feb | 5.40% | 5.40% | ||
| 10:00 | EUR | Eurozone CPI Estimate Y/Y Feb | 1.20% | 1.30% | ||
| 10:00 | EUR | Eurozone CPI Core Y/Y Feb A | 1.00% | 1.00% | ||
| 13:30 | CAD | Industrial Product Price M/M Jan | -0.10% | |||
| 13:30 | CAD | Raw Materials Price Index M/M Jan | -0.90% | |||
| 13:30 | USD | GDP Annualized Q/Q Q4 S | 2.50% | 2.60% | ||
| 13:30 | USD | GDP Price Index Q4 S | 2.40% | 2.40% | ||
| 14:45 | USD | Chicago PMI Feb | 64.6 | 65.7 | ||
| 15:00 | USD | Pending Home Sales M/M Jan | 0.50% | 0.50% | ||
| 15:30 | USD | Crude Oil Inventories | -1.6M |
GBP/USD At Continued Risk Of Weakness
Key Highlights
- The British Pound failed to move above the 1.4065 resistance and declined versus the US Dollar.
- There is a significant bearish trend line forming with resistance at 1.4030 on the 4-hours chart of GBP/USD.
- The US Durable Goods Orders in Jan 2018 declined 3.7%, more than the -2.0% forecast.
- Today, the US Gross Domestic Product Q4 2017 (Preliminary) will be released (Forecast 2.5% versus previous 2.6%).
GBPUSD Technical Analysis
The British Pound failed to move above a breakout resistance level near 1.4060-70 against the US Dollar. The GBP/USD pair is currently under pressure and it could trade further lower.
On the upside, there is a major resistance forming near 1.4030, and on the downside, there is a key support at 1.3900. A break on the either side could trigger the next move in GBP/USD.
Looking at the 4-hours chart, the pair was recently rejected from a significant bearish trend line with current resistance at 1.4030. The pair traded lower and broke the 50% Fib retracement level of the last wave from the 1.3856 low to 1.4069 high.
It is a negative sign and it seems like the pair may continue to decline towards the 1.3900 support. Should there be a break below the 1.3900 support, the pair may retest the last low of 1.3856. Any further declines could increase bearish pressures for a move towards 1.3750.
On the upside, the pair must break the trend line resistance near 1.4030 to recover. Above 1.4030, the pair may rise towards the 1.4100 level.
Recently in the US, the Durable Goods Orders figure for Jan 2018 was released by the US Census Bureau. The market was looking for a decline of 2% in orders.
The actual result was disappointing as there was a decline of 3.7% in orders in Jan 2018. Moreover, the Durable Goods Orders ex transportation posted a decline of 0.3%, whereas the market forecast was +0.4%.
The market sentiment still favored the US Dollar, and pairs such as EUR/USD and AUD/USD were under pressure. More importantly, the USD/JPY pair was seen trading higher with a positive tone.
Economic Releases to Watch Today
- Germany's Unemployment Change for Feb 2018 – Forecast -15K, versus -25K previous.
- Germany's Unemployment Rate for Feb 2018 – Forecast 5.4%, versus 5.4% previous.
- Euro Zone CPI for Feb 2018 (YoY) – Forecast +1.2%, versus +1.3% previous.
- US Gross Domestic Product Q4 2017 (Preliminary) – Forecast 2.5% versus previous 2.6%.
Market Morning Briefing: Pound Has Dipped Below Support Near 1.39
STOCKS
Dow (25410.03, -1.16%) and Dax (12490.73, -0.29%) have both dipped yesterday contrary to our expectation of further rise. Dax could test 12400 while below 12600 as mentioned yesterday while Dow could re-test 25000 in the near term.
Nikkei (22309.05, -0.36%) has come off from levels below 22600 and while that holds some dip towards 22200 or lower is possible in the coming sessions before it again attempts to move up. Near term looks bearish just now.
Shanghai (3252.80, -1.19%) also dipped as the resistance on the 3-day seemed to have held well. The index could come off towards 3250 in the near term. View is bearish for the coming sessions.
Nifty (10554.30, -0.27%) and Sensex (34346.39, -0.29%) are almost stable while a slight dip was seen yesterday. A sideways consolidation is possible in the coming sessions within 10620-10380 on Nifty and 34500-33750 on the Sensex.
COMMODITIES
Brent (66.32) has dipped, contrary to our expectation of a rise towards 68-69. This raises chances of a break below 66, which can then target 65 in the near term. Immediate rise towards 68-69 may be negated while below 67.
WTI (62.67) fell from levels near 64 instead of rising towards our mentioned 65 levels. It may possibly come down to test 62.
Brent-WTI Spread (3.65) may test interim resistance near 3.70/75 levels from where another dip looks likely in the next few sessions.
Gold (1317.43) also moved down contrary to our bullish expectation towards 1360/70 levels. Note immediate support near 1310 which if holds may gain push the index back towards 1340-1350 in the near term.
Copper (3.1785) is also down against our expectation to test 3.30. Near term dip is possible towards 3.15 before trying to move up again.
FOREX
The new US Fed Chairman (Jerome Powell) yesterday re affirmed the Fed’s plans of gradual rate hikes in 2018 due to strong confidence in rising US growth and inflation. These words from him have injected some temporary strength for the Dollar.
The Dollar Index (90.412) is close to resistance on the weekly candles (near 90.5) and we expect the same to hold in the near term. If it breaches 90.5, there are 2 strong resistances at 91 (3 day line chart and weekly line chart) and at 91.5 (weekly candle chart), which should produce a dip for the index.
Euro (1.2217) is holding above Support at 1.22 on the 3 day line chart. But, earlier bullishness is dented and will have to be re-examined. It has a good long-term Support at 1.2150 as seen on daily line chart, which can still produce a sharp rise, perhaps even up to 1.26 before the ECB meeting on 8th March.
Dollar-Yen (107.24) rose to a high near 107.70 last night, well above the intra-day bullish target of 107.25 we mentioned yesterday morning. Importantly, though, it has remained below the crucial long-term Resistance at 107.90-108.00, suggesting chances of long-term bearishness.
The Euro-Yen (131.02), is again testing support on daily candles near 131 and in case, the Euro strengthens towards 1.25-1.26 in the coming week while the Dollar Yen stays in the 106-108 zone, Euro Yen could rise towards 132.
Pound (1.3895) has dipped below support near 1.39, and could now test lower support near 1.38 on daily and 3 day candles before seeing a bounce.
Dollar-Rupee (65.12): The Dollar Rupee NDF rose to 65.15 yesterday night after Powell’s comments. We retain yesterday’s projection for now: Medium-term bullish towards 65.40.
INTEREST RATES
US 10 Year Yield (2.9081), US 30 year Yield (3.1654), US 5 year yield (2.6788), US 2 year yield (2.2741) : As per our expectation yesterday, the 10 Yr, 30 Yr and 5 Yr did indeed move up. The 2 year yield is at a record high level (above the 2.25-2.26 levels seen last week after the auctions).
Powell’s comments might just prove to be the market mover for the 10 Yr yield to move towards 3%. In case the US GDP data later today matches upto Powell’s bullish outlook on the US economy, we might well see yields rise in this week itself. If it falls short of expectations, we might see the yields hover around current levels for few more days.
(Long term resistance levels for the 4 yields have been as follows: 2.85-2.90, 3.20, 2.7 and 2.2 respectively – a decisive breach of these levels could happen sometime in March.)
Powell Says ‘Personal Outlook Has Strengthened’
Our interpretation of Fed Chair Powell's testimony before the House of Representatives' Financial Services Committee is that he was being slightly hawkish, especially during the following Q&A session (no big changes in the prepared speech). Being asked about what would cause the Fed to hike more than three times, he said that 'his own personal outlook has strengthened' since December, as economic data have been strong.
In his prepared speech, we want to highlight two things. Firstly Powell said that headwinds have turned into tailwinds due to a combination of stronger global growth and expansionary fiscal policy. Secondly, Powell used the words 'overheated economy' trying to describe the Fed's dilemma, as the unemployment rate and inflation are low at the same time (see our tweet). Also noteworthy was that Powell said that he 'personally' likes to look at different policy rules going into FOMC meetings. In its Monetary Policy Report – February 2018 (released Friday 23 February) the Fed describes a few rules – see our tweet. In the Q&A session, Powell said that 'all else being equal' looser fiscal policy should be offset by tighter monetary policy but did not directly answered whether it would be one-to-one.
Markets also interpreted Powell hawkishly, especially during the Q&A session. US 2yr Treasury yield rose 4bp to 2.26% while EUR/USD fell from 1.2320 to 1.2236 at the time of writing. S&P500 also fell 0.7% from its intraday peak during the Q&A.
We believe the Fed will stick to its '3 hikes' signal for 2018 at the upcoming meeting in March but that some of the six members currently indicating two or fewer hikes will lift their dots thus showing more confidence in the outlook. It will also be interesting to see what happens in relation to 2019 where the Fed currently indicates two hikes (taking the Fed funds rate to the longer-run dot of 2.75%, which is the level where monetary policy is neither expansionary nor contractionary). We think the signal for 2019 will be raised to three hikes (it was already borderline last time) hence signalling they want to start hitting the brakes by moving rates above the natural rate of interest due to expansionary fiscal policy. This should not change our view that fiscal policy is not offset one-to-one meaning inflation is still set to move gradually higher