Sample Category Title
USD/CHF Weekly Outlook
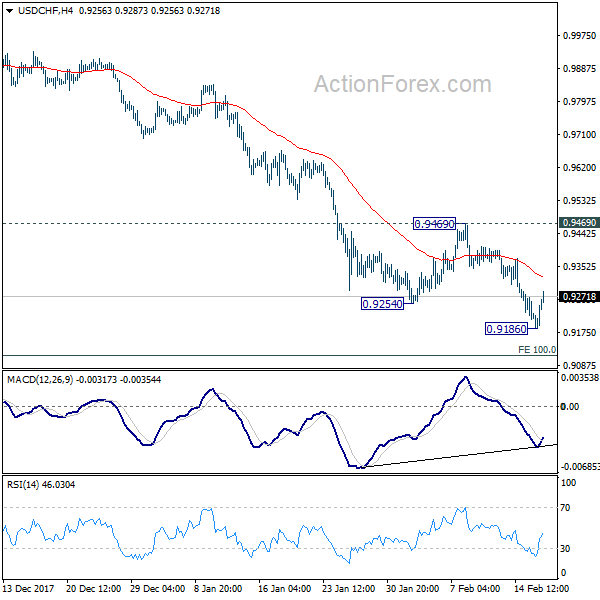
USD/CHF's down trend resumed last week and reached as low as 0.9186. As a temporary low was formed, initial bias is neutral this week first. Upside of recovery should be limited by 0.9469 resistance to bring fall resumption. Below 0.9186 will target 0.9115 medium term projection level next. However, considering bullish convergence condition in 4 hour MACD, break of 0.9469 will indicate near term reversal and turn outlook bullish for 55 day EMA (now at 0.9564).
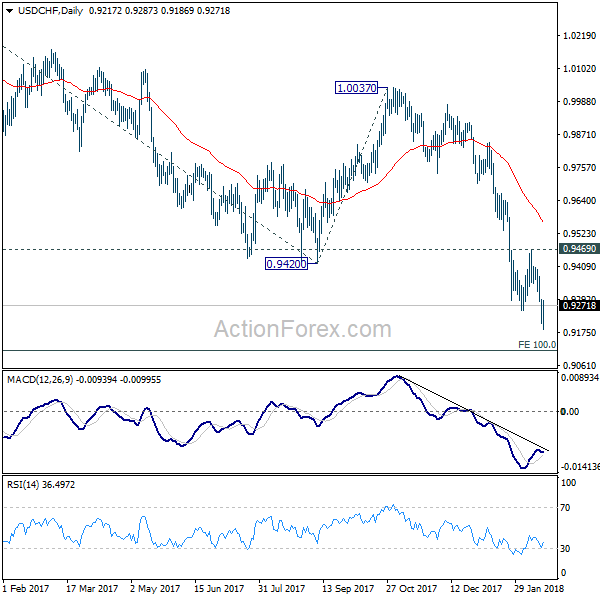
In the bigger picture, fall from 1.0342 is developing into a medium term down trend. Deeper decline should be seen to 100% projection of 1.0342 to 0.9420 from 1.0037 at 0.9115. Break will target 161.8% projection at 0.8545. In any case, sustained trading above 55 day EMA is needed to be the first sign of medium term reversal. Otherwise, outlook will stay bearish even in case of strong rebound.
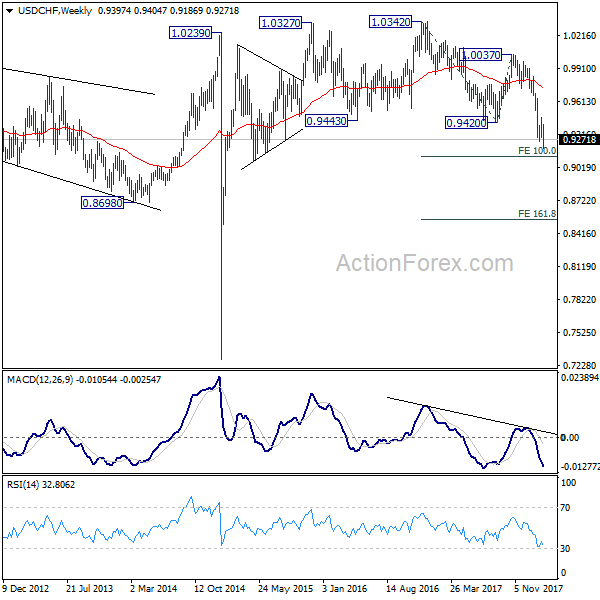
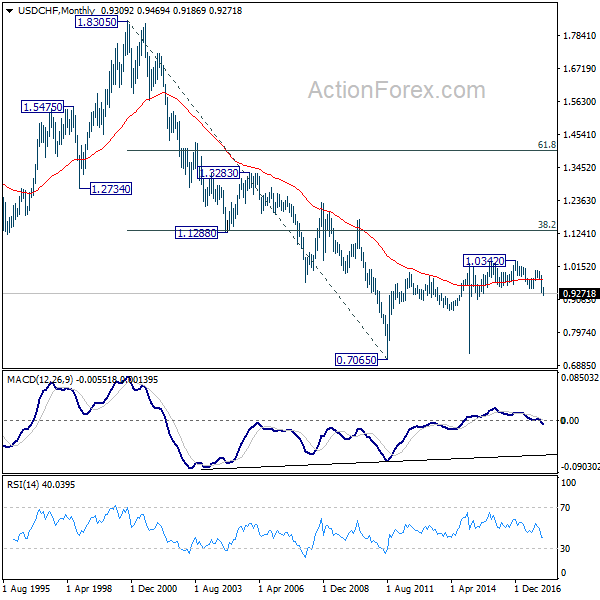
In the long term picture, the strong break of 0.9420 support and downside acceleration turns the long term outlook rather bearish. Corrective rebound from 0.7065 (2011 low) could have already completed at 1.0342. 0.8698 support will be a key level to watch. Sustained break there could bring retest of 0.7065.
AUD/USD Weekly Outlook
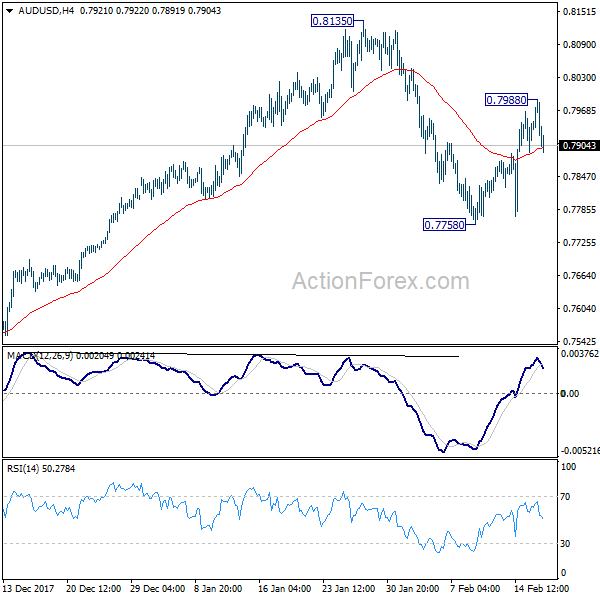
AUD/USD rebounded strongly to 0.7988 last week but lost momentum since then. Initial bias is neutral this week first. On the upside, above 0.7988 will extend the rebound to retest 0.8135. On the downside, below 0.7758 will resume the fall from 0.8135 and target 0.7500 key near term support. At this point, there is no strong case for a range breakout yet and 0.7500/8135 could hold for a while.
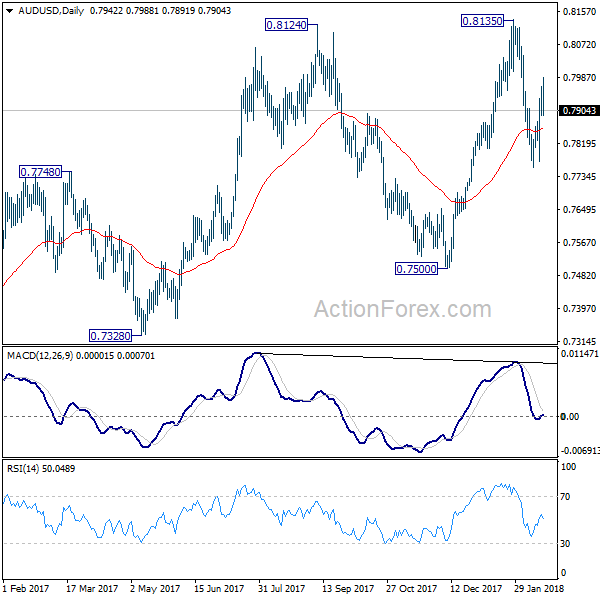
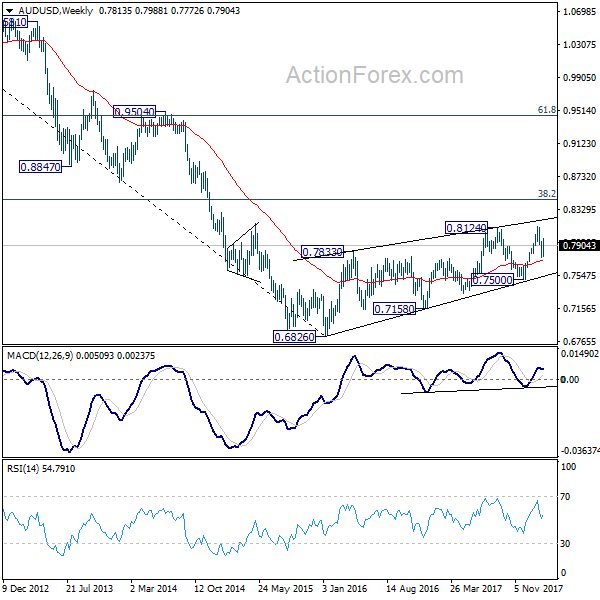
In the bigger picture, medium term rebound from 0.6826 is seen as a corrective move. It might still extend higher but we'd expect strong resistance from 38.2% retracement of 1.1079 to 0.6826 at 0.8451 to limit upside to bring long term down trend resumption. On the downside, break of 0.7500 support will now be an important signal that such corrective rebound is completed.
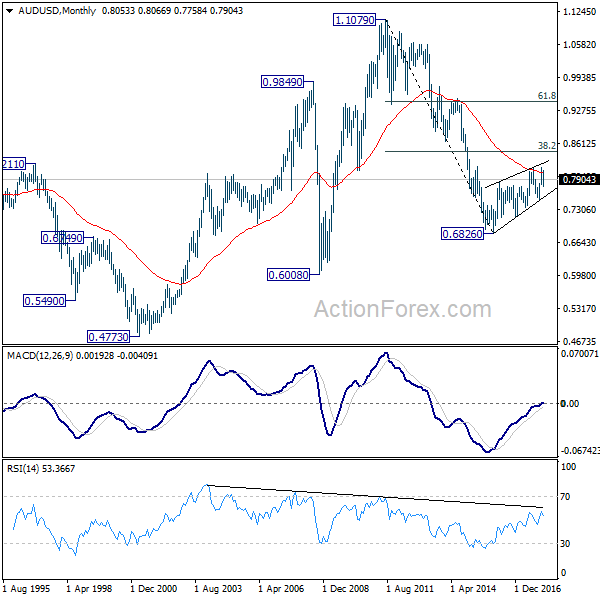
In the longer term picture, 0.6826 is seen as a long term bottom. Rise from there could either reverse the down trend from 1.1079, or just develop into a corrective pattern. At this point, we're favoring the latter. And, as long as 38.2% retracement of 1.1079 to 0.6826 at 0.8451 holds, we'd anticipate another decline through 0.6826 at a later stage. But strong support should be seen between 0.4773 (2001 low) and 0.6008 (2008 low).
USD/CAD Weekly Outlook
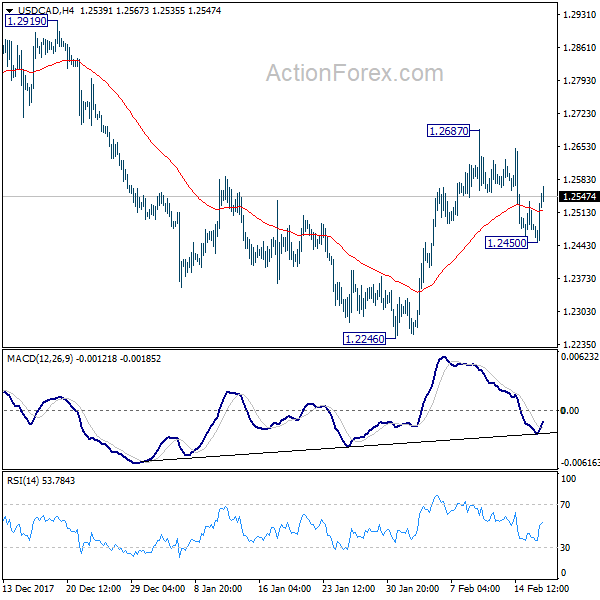
USD/CAD dipped to 1.2450 last week but quickly recovered. Initial bias is neutral this week first. On the upside, above 1.2687 will extend the rebound from 1.2246 to retest 1.2919 key near term resistance. On the downside, below 1.2450 will target 1.2246 first. Break there will extend the fall from 1.2919 and target 1.2061 keys support level.
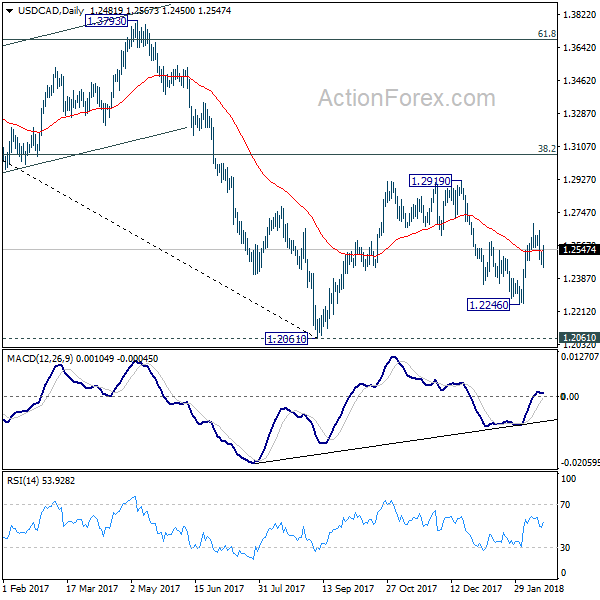
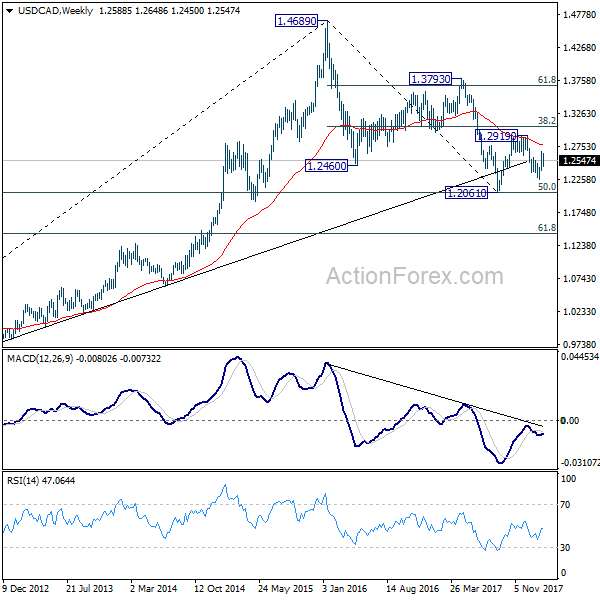
In the bigger picture, the rebound from 1.2246 is mixing up the medium term outlook. Nonetheless, USD/CAD is staying below falling 55 week EMA, hence, the bearish case is in favor. That is, fall from 1.4689 is not completed yet. Sustained break of 1.2061 key support will carry larger bearish implication and target 61.8% retracement of 0.9406 to 1.4689 at 1.1424. However, firm break of 1.2919 will revive the case of medium term reversal and turn outlook bullish.
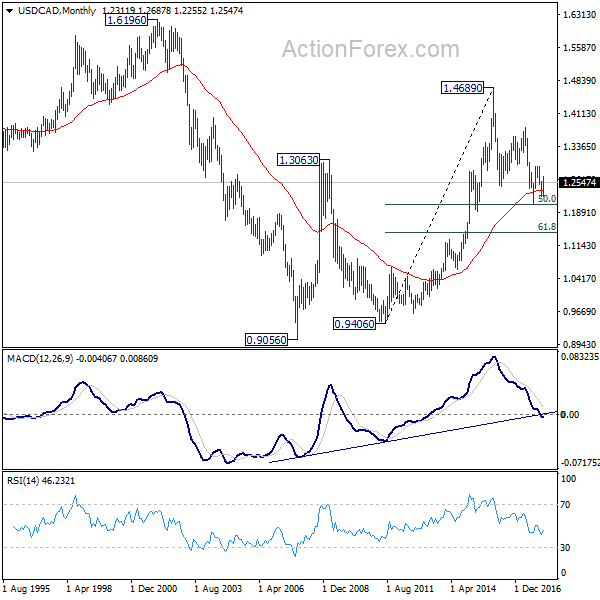
In the longer term picture, 50% retracement of 0.9406 (2011 low) to 1.4689 (2015 high) at 1.2048 remains a key support level to watch. As long as this level holds, we'll treat fall from 1.4689 as a correction and expect another rally through this level. However, sustained break of 1.2048 will turn favors to the case that rise from 0.9056 (2007 low) is a three wave corrective move that's completed at 1.4689. And retest of 0.9056/9406 support zone could be seen in medium to long term.
GBP/JPY Weekly Outlook
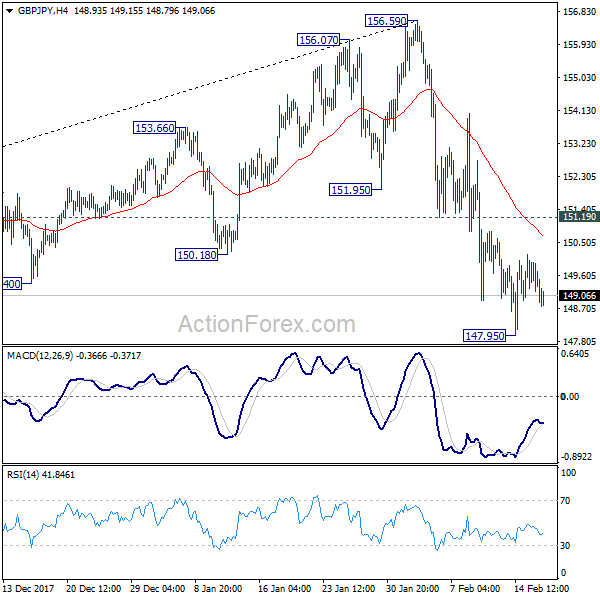
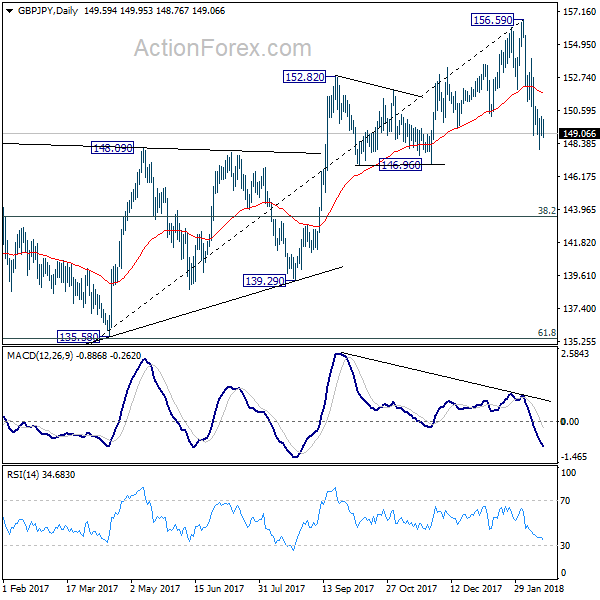
GBP/JPY's fall from 156.59 extended to 147.95 last week but formed a temporary low there and recovered. Initial bias is neutral this week first. Upside of recovery should be limited by 151.19 resistance to bring another fall. Below 147.95 will target 146.96 support next. Considering bearish divergence condition in daily MACD, firm break of 146.96 will be another sign of medium term trend reversal. On the upside, break of 151.19 will indicate short term bottoming and turn bias back to the upside for rebound.
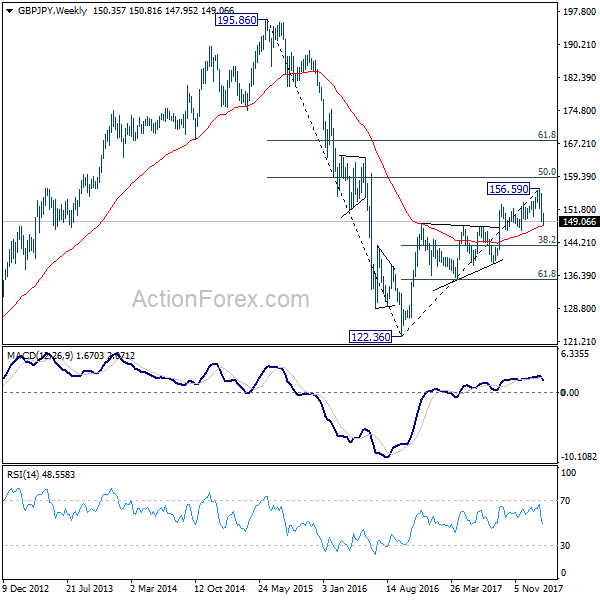
In the bigger picture, the case for medium term reversal continues to build up on loss of medium term momentum as seen in 4 hour MACD. Also, firm break of 146.96 will indicate rejection by 55 month EMA and add to that case of reversal. In that case, deeper fall would be seen to 38.2% retracement of 122.36 to 156.59 at 143.51 and then 61.8% retracement at 135.43. Meanwhile, break of 156.59 will extend the rise from 122.36 to 61.8% retracement of 195.86 to 122.36 at 167.78.
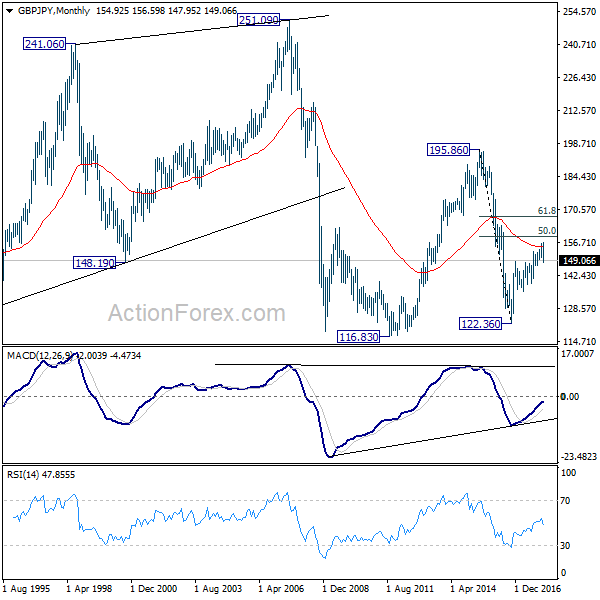
In the longer term picture, down trend from 195.86 (2015 high) has already completed at 122.36. Focus is now on 55 month EMA (now at 154.60). Firm break there will suggest that rise from 122.36 is developing into a long term move that target 195.86 again. And, price actions from 116.83 (2011 low) is indeed a sideway pattern that could last more than a decade. However, rejection from the 55 month EMA will turn focus back to 122.36 low.
EUR/JPY Weekly Outlook
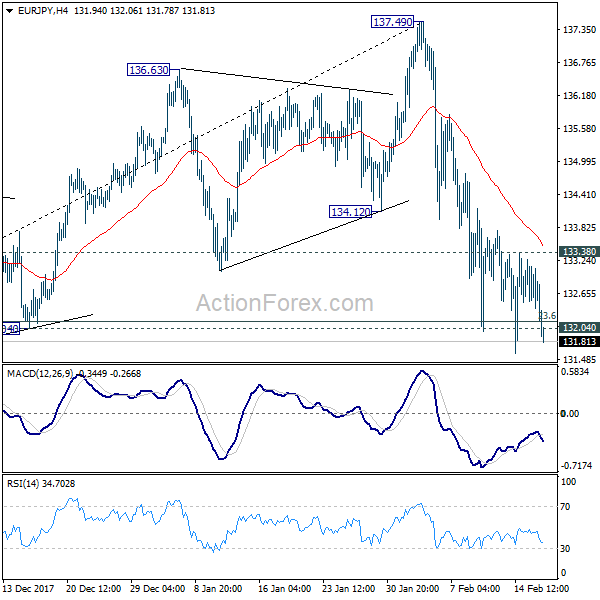
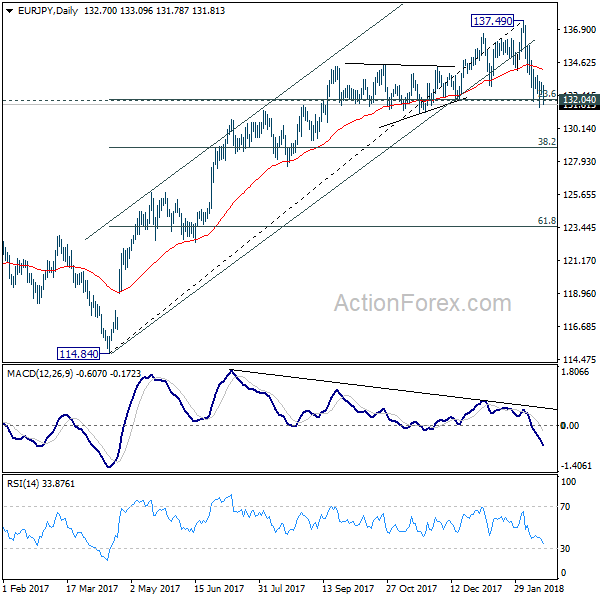
EUR/JPY's fall from 137.49 tried to extend last week but struggled to sustain below 132.04 cluster support (23.6% retracement of 114.84 to 137.49 at 132.14). Nonetheless, outlook will remain bearish this week as long as 133.38 resistance holds. As noted before sustained trading below 132.04/14 will indicate larger trend reversal on bearish divergence condition in daily MACD. In such case, deeper decline would be seen for 38.2% retracement at 128.38 first. However, rebound from 132.04 will retain near term bullishness. Break of 133.38 minor resistance will turn bias back to the upside for 137.49 again.
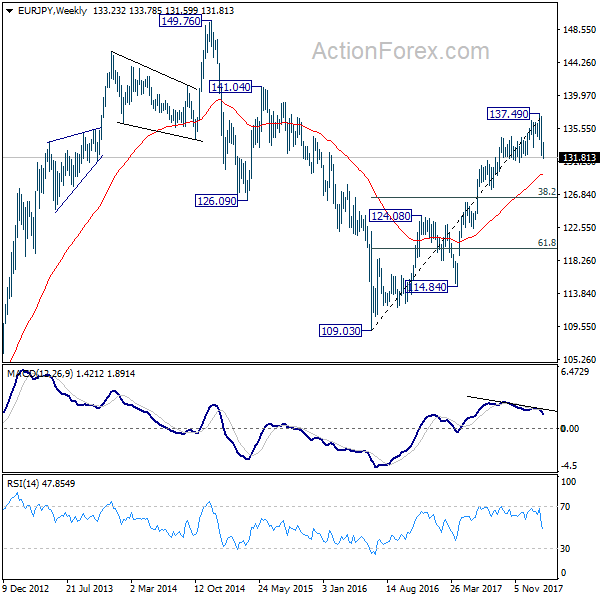
In the bigger picture, bearish divergence condition in weekly MACD indicates loss of medium term upside momentum. Sustained break of 132.04 will be the early sign of long term reversal and should bring deeper fall back to retest 124.08 key support level. Meanwhile, break of 137.49 will resume the up trend from 109.03 to 141.04/149.76 resistance zone.
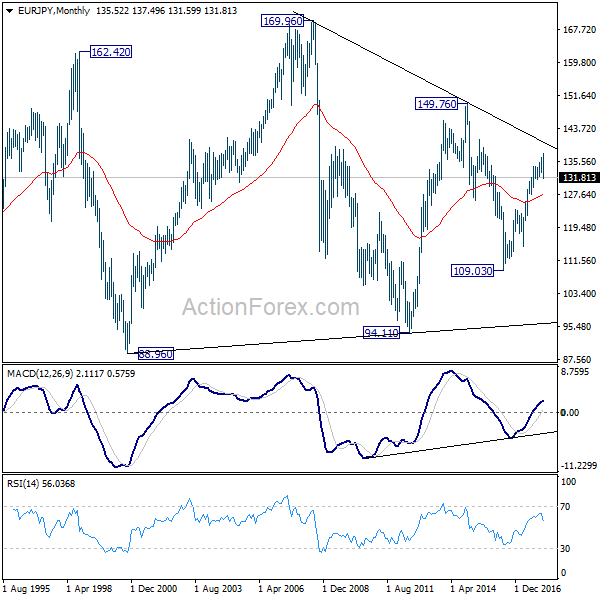
In the long term picture, at this point, EUR/JPY is staying in long term sideway pattern. established since 2000. Rise from 109.03 is seen as a leg inside the pattern. As long as 124.08 support holds, further rally is in favor in medium to long term through 149.76 high. However, break of 124.08 could extend the fall through 109.03 low instead.
EUR/GBP Weekly Outlook
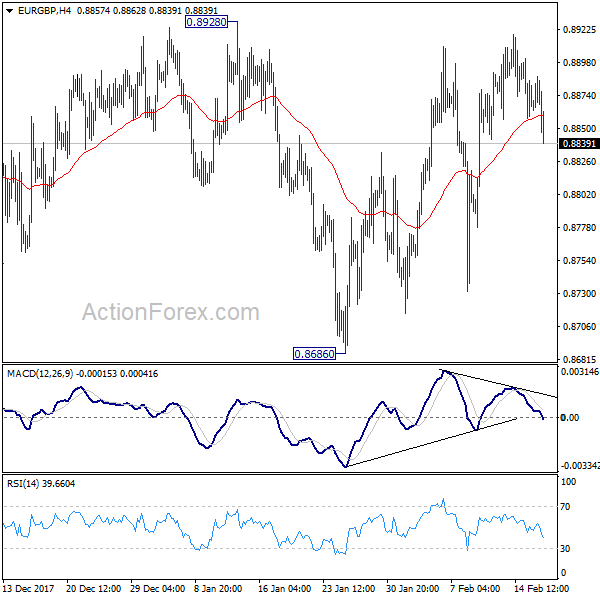
EUR/GBP edged higher last week but failed to take out 0.8928 resistance and reversed. As it's staying in range of 0.8686/8928, outlook is unchanged. Initial bias stays neutral this week first. Near term outlook will remain mildly bearish as long as 0.8928 resistance holds. On the downside, firm break of 0.8686 will resume whole decline from 0.9305. As 61.8% retracement of 0.8312 to 0.9305 should then be taken out too, deeper decline would be seen to retest 0.8303/8312 support zone. Nonetheless, on the upside, break of 0.8928 will indicate near term reversal and turn outlook bullish for 0.9304 resistance.
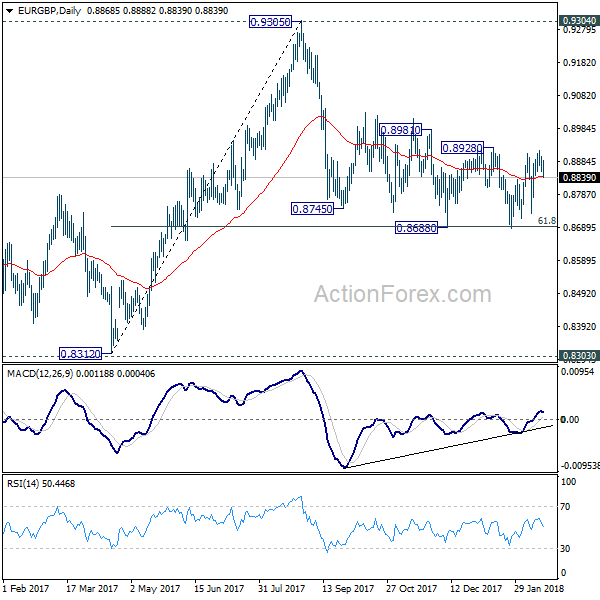
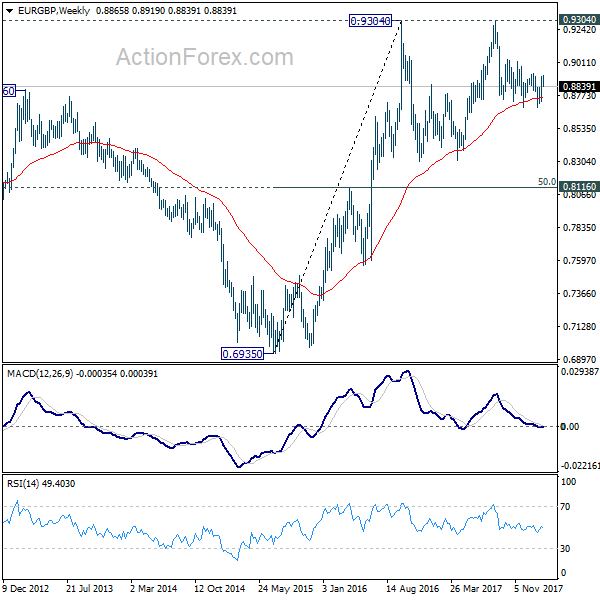
In the bigger picture, there are various ways to interpret price actions from 0.9304 high. But after all, firm break of 0.9304/5 is needed to confirm up trend resumption. Otherwise, range trading will continue with risk of deeper fall. And in that case, EUR/GBP could have a retest on 0.8303. But we'd expect strong support from 0.8116 cluster support (50% retracement of 0.6935 to 0.9304 at 0.8120) to contain downside.
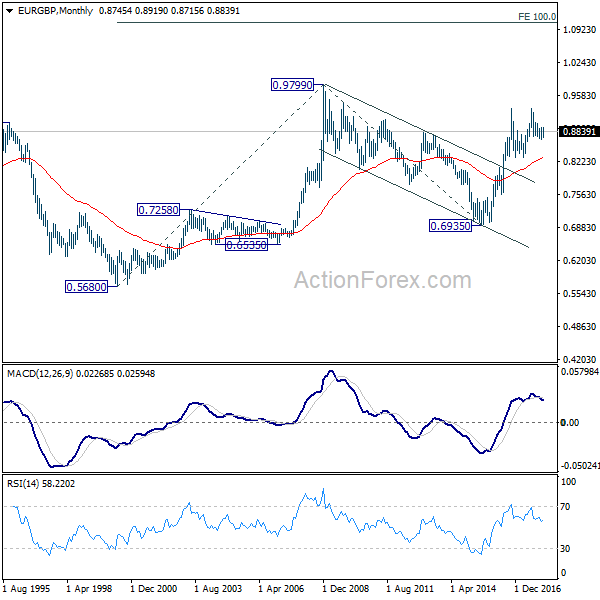
In the long term picture, we're holding on to the view that rise from 0.6935 (2015 low) is resuming the up trend from 0.5680 (2000 low). Hence, after the consolidation from 0.9304 completes, we'd expect another medium term up trend through 0.9799 to 100% projection of 0.5680 to 0.9799 from 0.6935 at 1.1054.
EUR/AUD Weekly Outlook
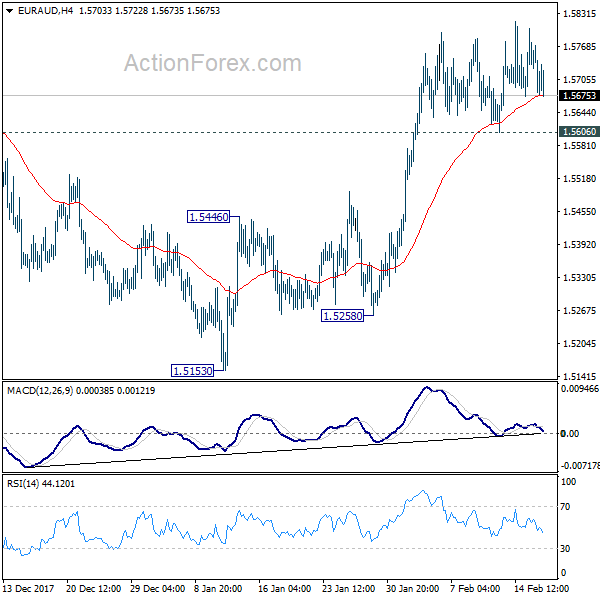
EUR/AUD edged higher last week but failed to sustained gain and retreated quickly. Nonetheless, with 1.5606 support intact, near term outlook stays bullish. Sustained trading above 1.5770 key resistance Sustained trading above 1.5770 will confirm resumption of medium term rise from 1.3264. In that case, EUR/AUD should target 1.6587 key long term resistance. However, below 1.5606 minor support minor support will dampen this bullish case and turn bias to the downside for 55 day EMA (now at 1.5463).
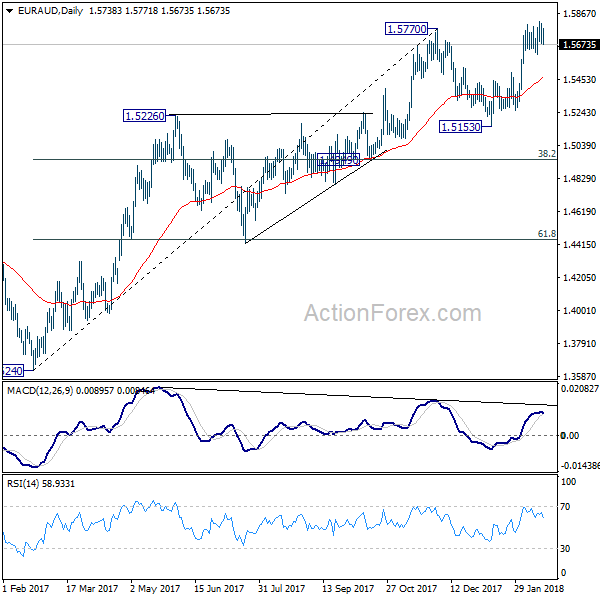
In the bigger picture, medium term rise from 1.3624 is not completed yet. Sustained break of 1.5770 will extend the rise to retest 1.6587 (2015 high). However, considering bearish divergence condition in daily MACD, break of 1.4949 cluster support (38.2% retracement of 1.3624 to 1.5770 at 1.4950) will indicate medium term reversal. And there is prospect of retesting 1.3624 low in that bearish case.
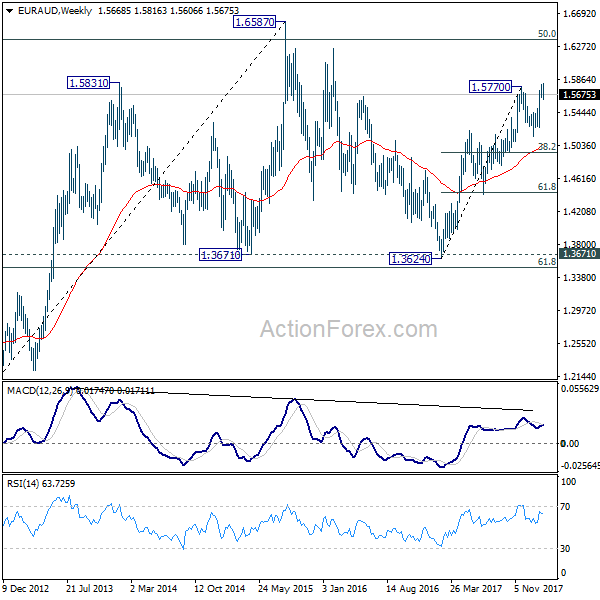
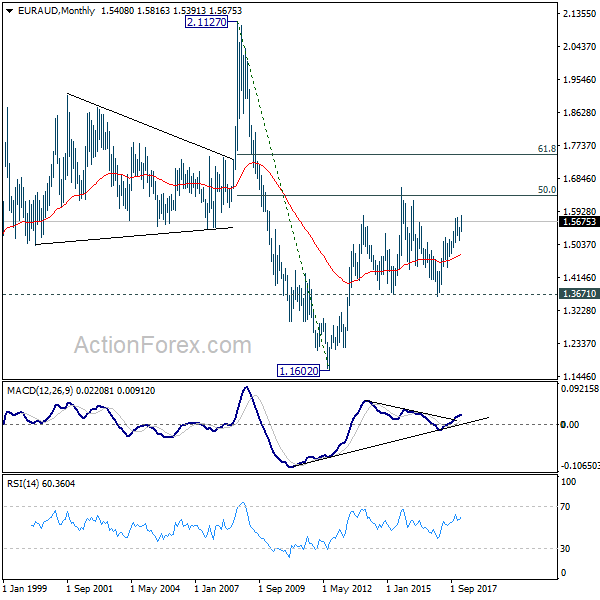
In the longer term picture, the rise from 1.1602 long term bottom (2012 low) isn't over yet. We'll keep monitoring the development but there is prospect of extending the rise to 61.8% retracement of 2.1127 to 1.1602 at 1.7488 and above. However, sustained trading below 1.3671 should indicate long term reversal and target 1.1602 long term bottom again.
EUR/CHF Weekly Outlook
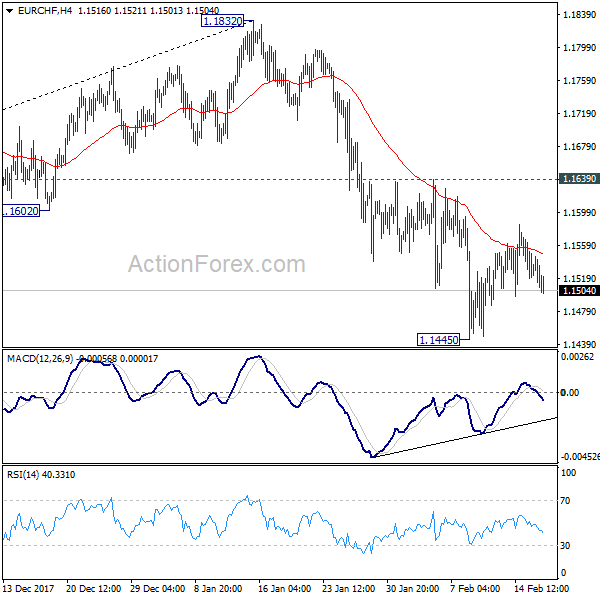
EUR/CHF turned into consolidation last week as it recovered. But upside was limited well below 1.1639 resistance. Initial bias stays neutral this week with bearish near term outlook. Break of 1.1445 will resume the corrective fall from 1.1832 and target 1.1355 cluster support (38.2% retracement of 1.0629 to 1.1832 at 1.1372.) At this point, we'd expect strong support from there to contain downside and bring rebound.
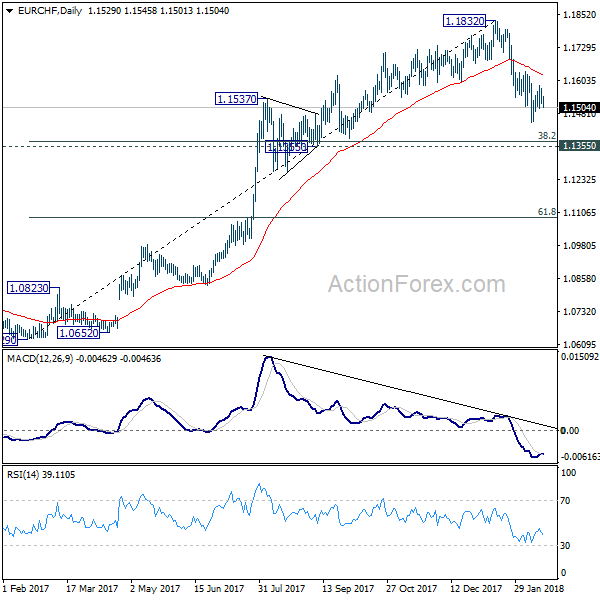
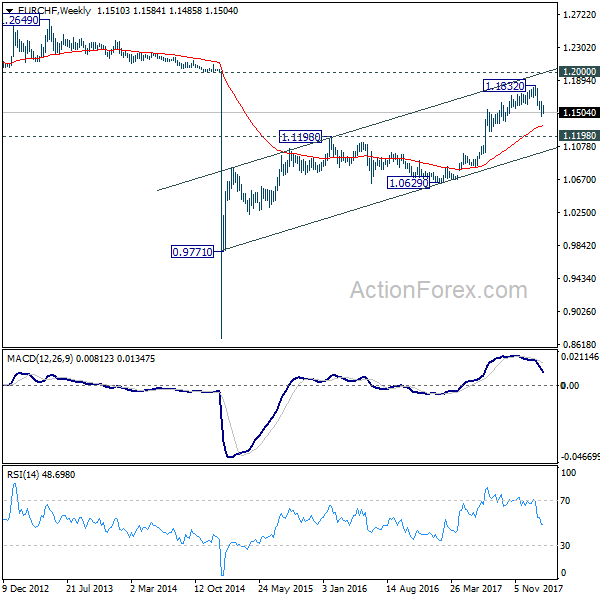
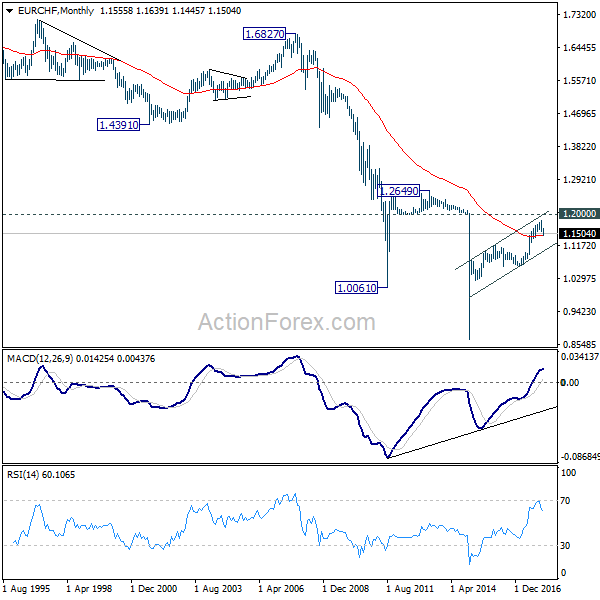
In the bigger picture, a medium term top should be in place at 1.1832 on bearish divergence condition in daily MACD. But there is no indication of long term reversal yet. As long as 1.1198 resistance turned support holds, we'd still expect another rise through prior SNB imposed floor at 1.2000.
Dollar Hit Three Year Low as Down Trend Resumed, No Clear Sign of Reversal Yet
Dollar's broad based weakness continued last week and ended as the worst performing major currency. Stronger than expected consumer inflation reading listed treasury yield and raised the chance of a March Fed hike. Fed fund futures are now pricing in 83% chance of a March hike. But that provided just very brief support to the greenback. Dollar index extended the long term down trend to new three year low, suffering the worst weekly decline since September. Some pointed to Friday's rebound as a sign of reverse in fortune in Dollar. But we'll, for now, take a more cautious stance on it first. Elsewhere, Canadian Dollar and Australian Dollar ended as the second and third weakest ones. Yen, Kiwi and Pound were the strongest.
The correlation between dollar and treasury yield continued to break down last week. Initial reaction to CPI release was as expected as both Dollar and yields surged. But then, while yields retreated, they stayed resilient. Dollar, on the other hand, suffered steep selloff and resumed recent down trend. There are various explanations to the break down in correlation. But we'd like to point out one fundamental question first. That is, does higher yield make dollar assets more attractive? Or does it reflect the relative unattractiveness of dollar assets?
Many, including us, got it wrong until recently. It worked before, in particular seen in USD/JPY in most of the low interest rate era, that higher US yields will lift the Dollar. But now, as we're existing this era, it's just reflection that Dollar assets are getting less attractive. In the background, Fed's shrinking of the balance sheet this year is going to flood the markets with extra supply in bonds. And then, investors, domestic and overseas, are getting more willing to take risks than parking them in bonds. The US markets, continuously making record runs, is a good place for investments. But some find other markets, like EU and Asia, at least as attractive. Also, the money flow could be seen as a vote of "no confidence" in US President Donald Trump in his deficit booming fiscal policies (with the tax cut), as well as protectionist trade policies. We're not expecting the positive correction to return, until we seen solid evidence.
10 year yield (TNX) edged higher to 2.888 before closing at 2.877. It's the second week that TNX closed lower than weekly open. And it's starting to look tired ahead of 3.036 key resistance. Nonetheless, as long as 2.736 near term support holds, outlook will stays bullish. Region between 3.036 and 3.318 (100% projection of 1.336 to 2.621 from 2.034) is the real long term trend defining junction for TNX. On the downside break of 2.7.36 will at least bring deeper correction towards 55 day EMA (now at 2.618) first.
Dollar index resumed last long term down trend from 103.82 and edged lower to 88.25 last week. Notable buying was seen last Friday to bring a recovery in the greenback. DXY closed back inside recently established rate at 89.10. 50% retracement of 72.69 to 103.82 at 88.25 could still be providing strong support to DXY. But it's far too early to talk about reversal. Near term resistance zone between 90.56 and 91.01 must be overcome first before having any chance of a trend reversal. That would be equivalent to a break of 1.2205 support in EUR/USD. Otherwise, the down trend from 103.82 is more likely than not to extend to next key cluster support at 84.75, 61.8% retracement of 72.69 to 103.82 at 84.58, before completion.
DOW was initially sold off after strongest than expected US CPI release but quickly reversed. It indeed extended the rebound from 22360.29 to close solidly to 25219.38. As we pointed out during the week, the reactions could be interpreted as "the worst in stocks was over". The steep selloff from 26616.71 to 23360.29 was based on worries over tightening by Fed. As seen in fed fund futures, chance of a March hike continued to rise to 83% after the CPI release. But stocks were resilient. So, that selloff was probably an over-reaction. The coming days will be important as sustained trading above 61.8% retracement of 26616.71 to 23360.29 at 25372.75 will establish DOW in, at worst, a sideway consolidation pattern, rather than a downward correction pattern.
Position trading strategy
We're holding on to our GBP/CHF short (sold at 1.3105). We're still bearish in the cross for 38.2% retracement of 1.1638 to 1.3491 at 1.2783 as the first target, and 61.8% retracement at 1.2346 as second. But the lack of downside momentum is disappointing. And as mentioned above, there is a risk that the worst in risk markets was over. Hence, we'll lower the stop to break even at 1.3105. For those who'd like to move on, exiting on a dip this week is ok too. Though, we'll give it a little bit more time.
USD/JPY Weekly Outlook
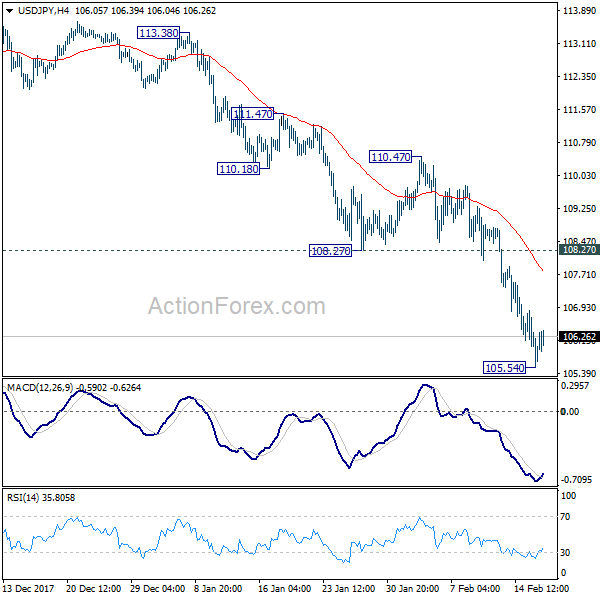
USD/JPY's down trend continued last week and reached as low as 105.54. A temporary low was formed with 4 hour MACD crossed above signal line. Initial bias is neutral this week for consolidation first. But recovery should be limited below 108.72 support turned resistance and bring fall resumption. Below 105.54 will target 100% projection of 118.65 to 108.12 from 114.73 at 104.20 next.
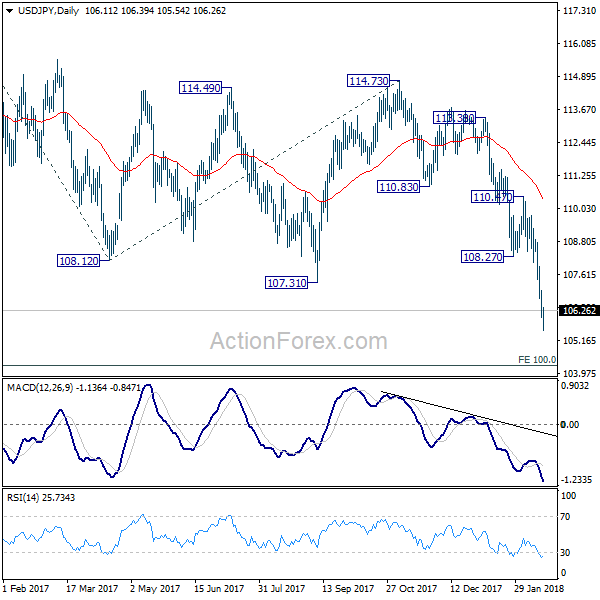
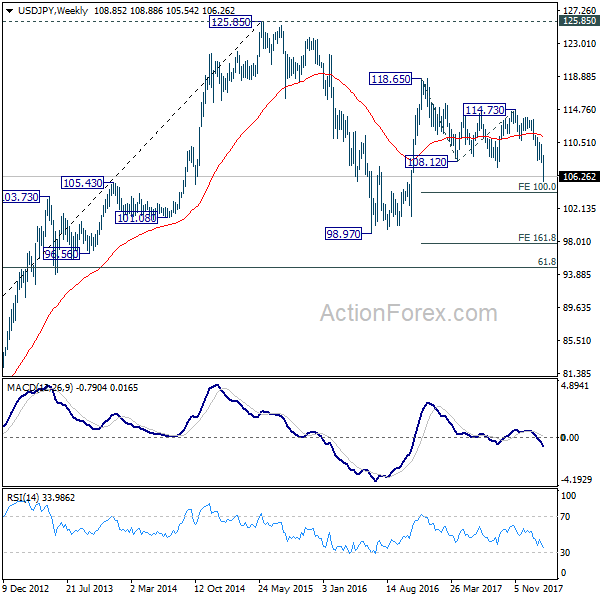
In the bigger picture, current development argues that the corrective pattern from 118.65 is extending. The solid break of 61.8% retracement of 98.97 to 118.65 at 106.48. now suggests that the pattern from 125.85 high is possibly extending. Deeper fall could be seen through 98.97 key support (2016 low). This bearish case will now be favored as long as 110.47 resistance holds.
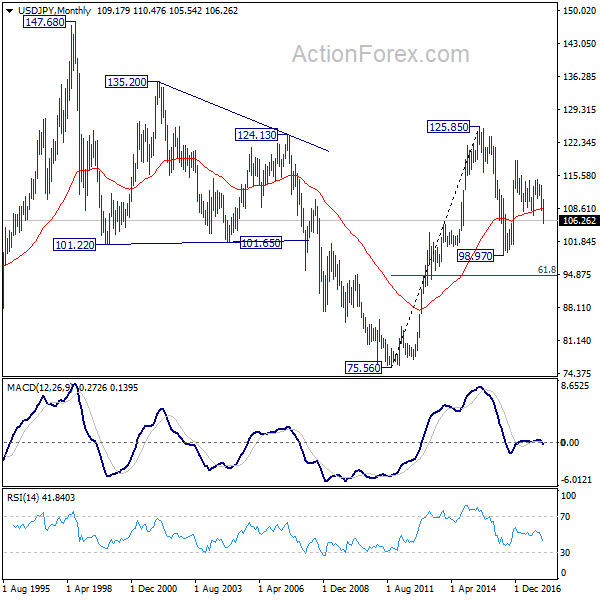
In the long term picture, the rise from 75.56 (2011 low) long term bottom to 125.85 top is viewed as an impulsive move, no change in this view. Price actions from 125.85 are seen as a corrective move which could still extend. In case of deeper fall, downside should be contained by 61.8% retracement of 75.56 to 125.85 at 94.77. Up trend from 75.56 is expected to resume at a later stage for above 135.20/147.68 resistance zone.