Sample Category Title
AUD/USD Weekly Outlook
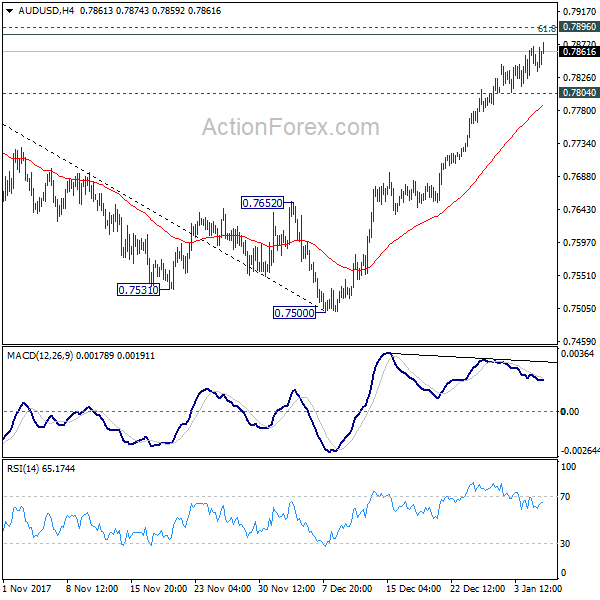
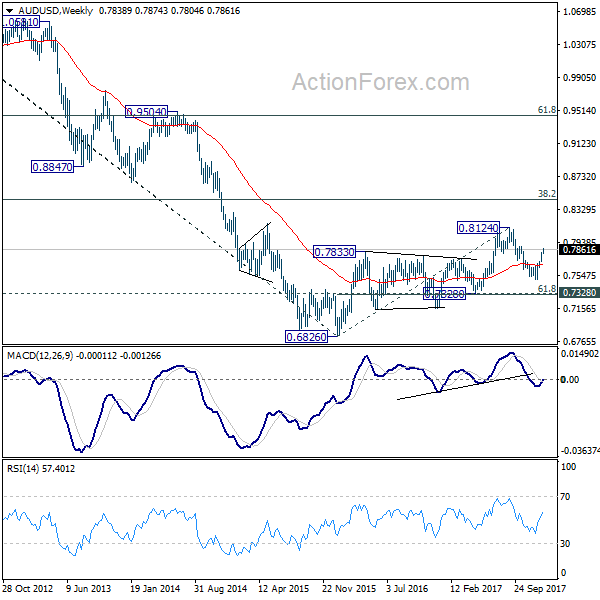
AUD/USD's rally continued last week and further rise could be seen initially this week. However, considering bearish divergence condition in 4 hour MACD, upside should be limited by 0.7896 cluster resistance (61.8% retracement of 0.8124 to 0.7500 at 0.7886) resistance zone to bring short term topping. Break of 0.7804 minor support will turn bias to the downside for 55 day EMA (now at 0.7701).
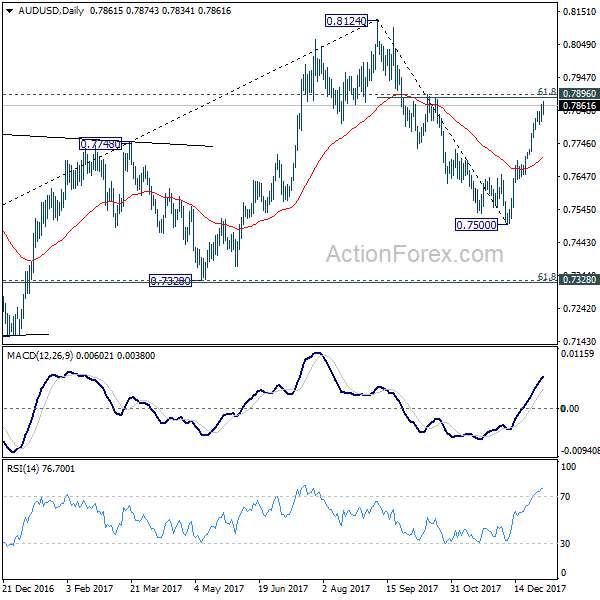
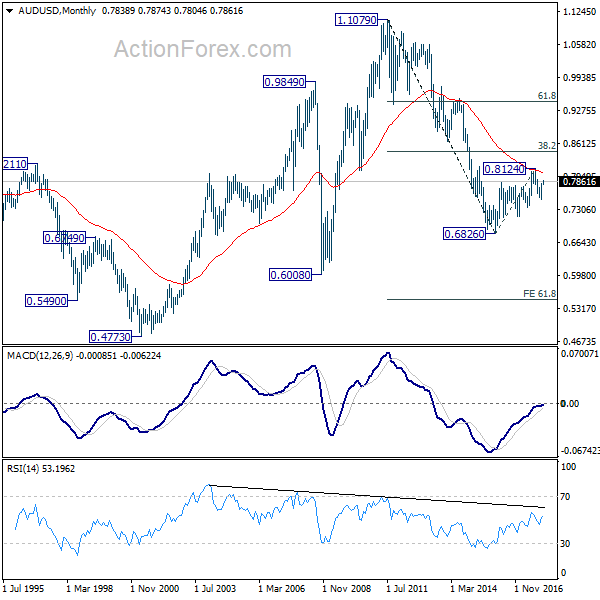
In the bigger picture, we're still slightly favoring the case that corrective rise from 0.6826 medium term bottom is completed at 0.8124, after hitting 55 month EMA (now at 0.8032). But stronger than expected rebound from 0.7500 is dampening this bearish view. On the downside, break of 0.7500 will target 0.7328 key cluster support (61.8% retracement 0.6826 to 0.8124 at 0.7322) to confirm this bearish case. But break of 0.8124 will extend the rise from 0.6826 to 38.2% retracement of 1.1079 (2011 high) to 0.6826 (2016 low) at 0.8451 before completion.
In the longer term picture, 0.6826 is seen as a long term bottom. Rise from there could either reverse the down trend from 1.1079, or just develop into a corrective pattern. At this point, we're favoring the latter. And, as long as 38.2% retracement of 1.1079 to 0.6826 at 0.8451 holds, we'd anticipate another decline through 0.6826 at a later stage. But strong support should be seen between 0.4773 (2001 low) and 0.6008 (2008 low).
USD/CAD Weekly Outlook
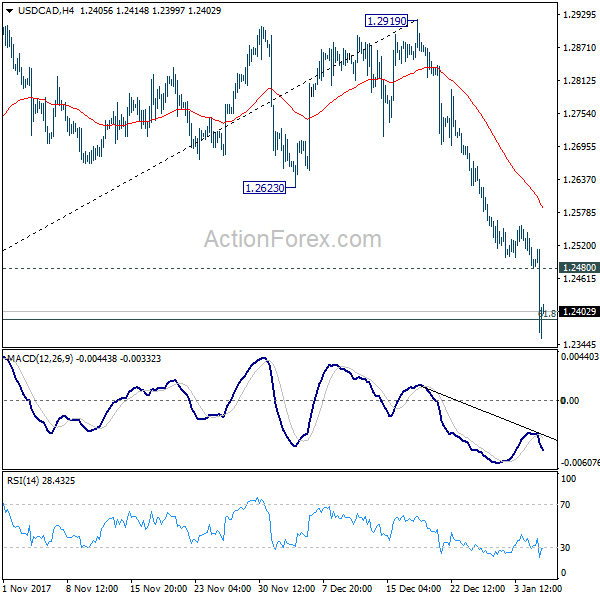
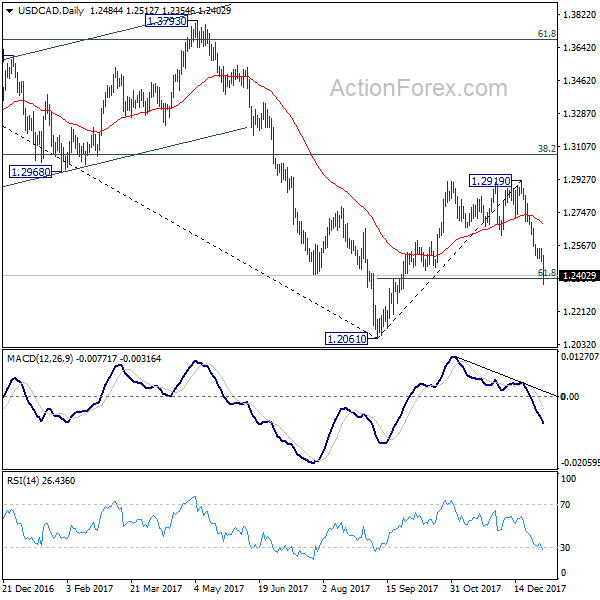
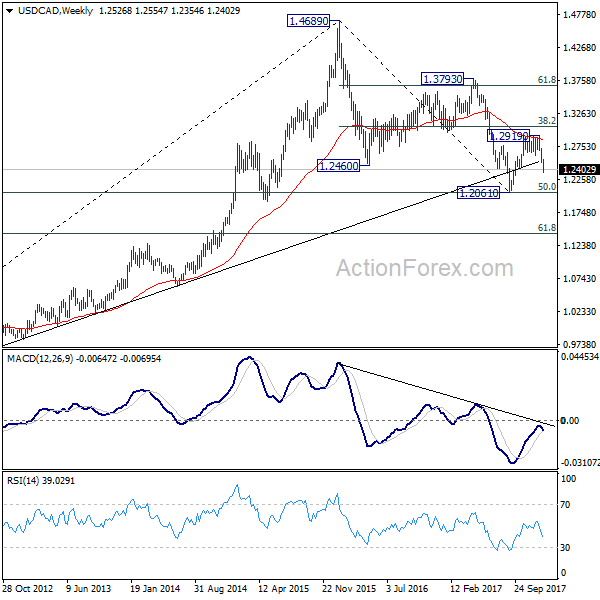
USD/CAD's decline accelerated last week and breached 61.8% retracement of 1.2061 to 1.2919 at 1.2389. Based on the momentum, the pair is likely resuming larger down trend from 1.4689. Initial bias stays on the downside this week for retesting 1.2061 low. On the upside, above 1.2480 minor resistance will turn bias neutral and bring consolidation before staging another fall.
In the bigger picture, current development argues that rebound from 1.2061 has completed at 1.2919, rejected by 55 week EMA (now at 1.2850) and kept below 38.2% retracement of 1.4689 to 1.2061 at 1.3065. The development also suggests that long term fall from 1.4689 is not completed yet. Decisive break of 1.2061 low will target 61.8% retracement of 0.9406 to 1.4689 at 1.1424. This will now be the favored case as long as 1.2929 resistance holds.
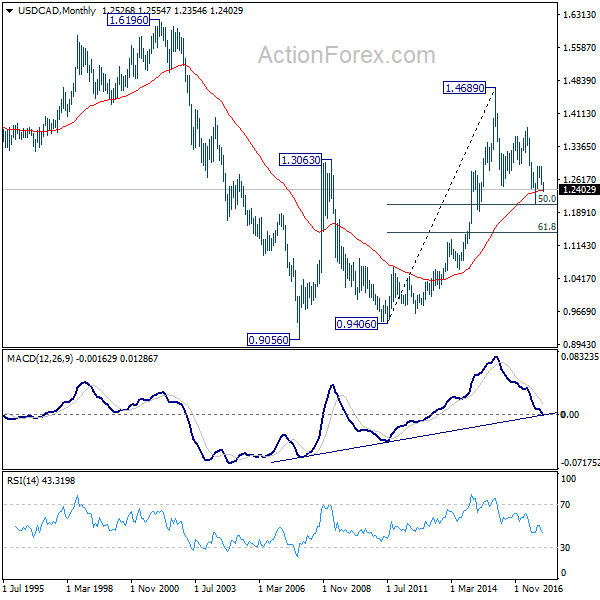
In the longer term picture, 50% retracement of 0.9406 (2011 low) to 1.4689 (2015 high) at 1.2048 remains a key support level to watch. As long as this level holds, we'll treat fall from 1.4689 as a correction and expect another rally through this level. However, sustained break of 1.2048 will turn favors to the case that rise from 0.9056 (2007 low) is a three wave corrective move that's completed at 1.4689. And retest of 0.9056/9406 support zone could be seen in medium to long term.
GBP/JPY Weekly Outlook
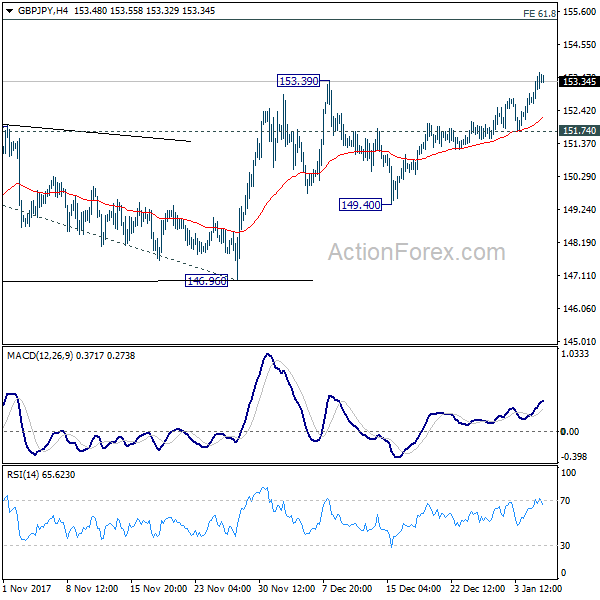
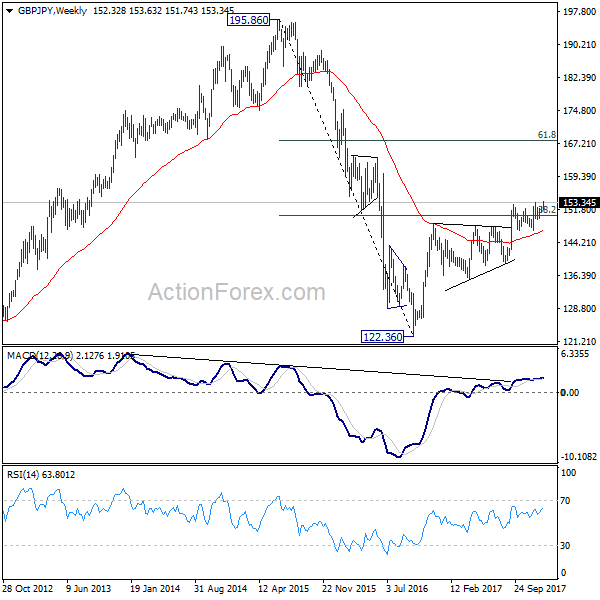
GBP/JPY's rise from 149.40 extended last week. Breach of 153.39 resistance suggests resumption of medium term rally. Initial bias remains on the upside this week for 61.8% projection of 139.29 to 152.82 from 146.96 at 155.32 first. Break will target 100% projection at 160.49. On the downside, break of 151.74 is needed to indicate short term topping. Otherwise, outlook will remain bullish in case of retreat.
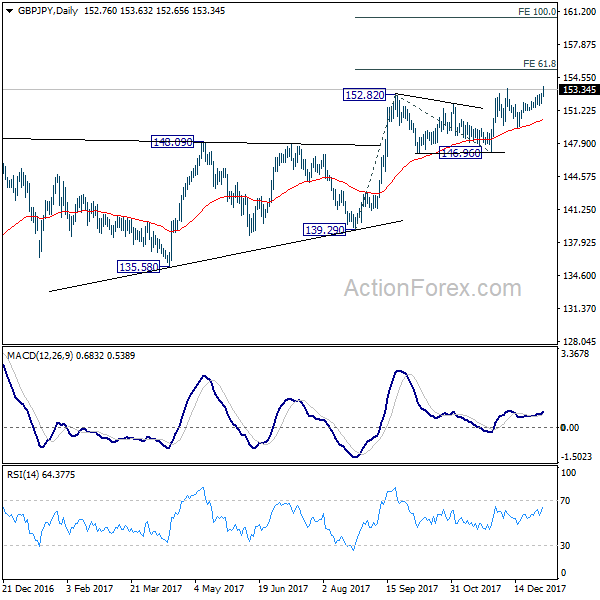
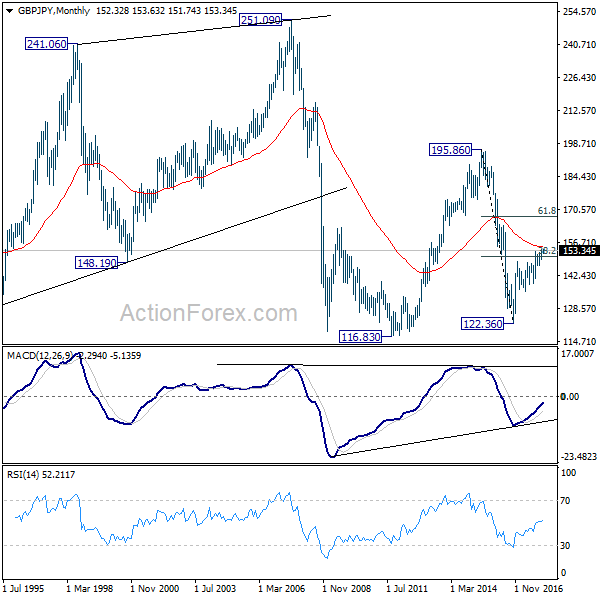
In the bigger picture, it now looks like GBP/JPY has finally taken out 38.2% retracement of 195.86 to 122.36 at 150.43. Medium term rise from 122.36 should be targeting 61.8% retracement at 167.78. This will now be the favored case as long as 146.96 support remains intact.
In the longer term picture, current rebound argues that the down trend from 195.86 (2015 high) has already completed at 122.36. Focus is now on 55 month EMA (now at 154.74). Firm break there will suggest that rise from 122.36 is developing into a long term move that target 195.86 again. And, price actions from 116.83 (2011 low) is indeed a sideway pattern that could last more than a decade.
EUR/JPY Weekly Outlook
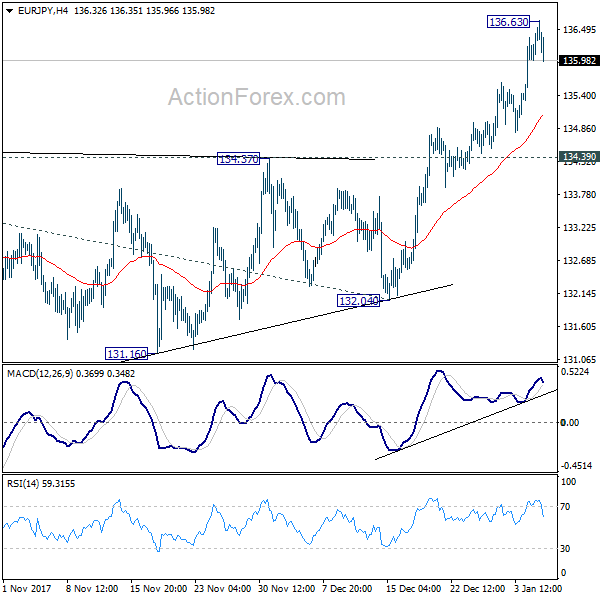
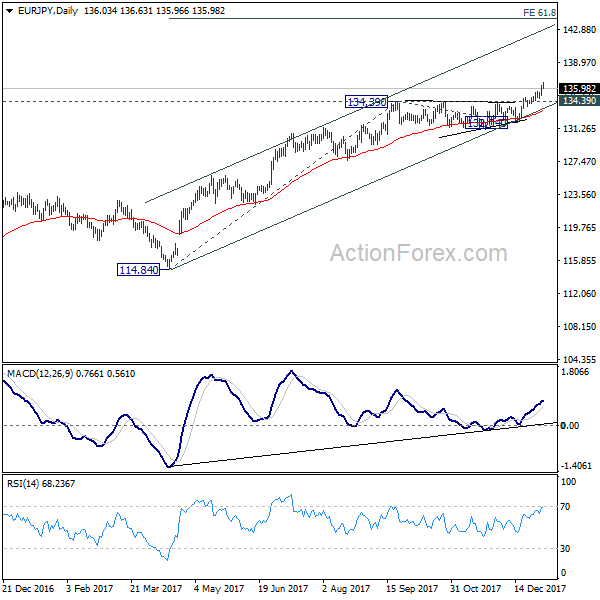
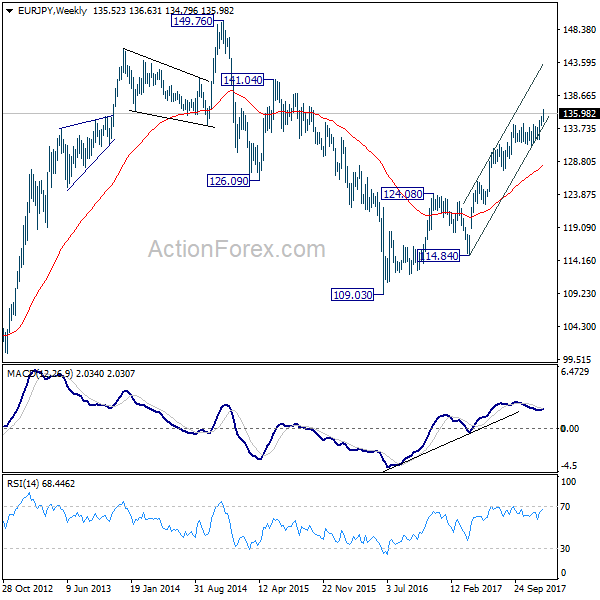
EUR/JPY surges to as high as 136.63 last week last week as medium term up trend resumes. As a temporary top is likely formed, initial bias is neutral this week first. But downside of retreat should be contained by 134.39 resistance turned support to bring another ally. Above 136.63 will extend the up trend towards 61.8% projection of 114.84 to 134.39 from 132.04 at 144.12.
In the bigger picture, medium term rise from 109.03 (2016 low) is seen as at the same degree as the down trend from 149.76 (2014 high) to 109.03 (2016 low). It should now be targeting 141.04/149.76 resistance zone. On the downside, break of 132.04 support is needed to be the first sign of medium term reversal. Otherwise, outlook will stay bullish in case of pull back.
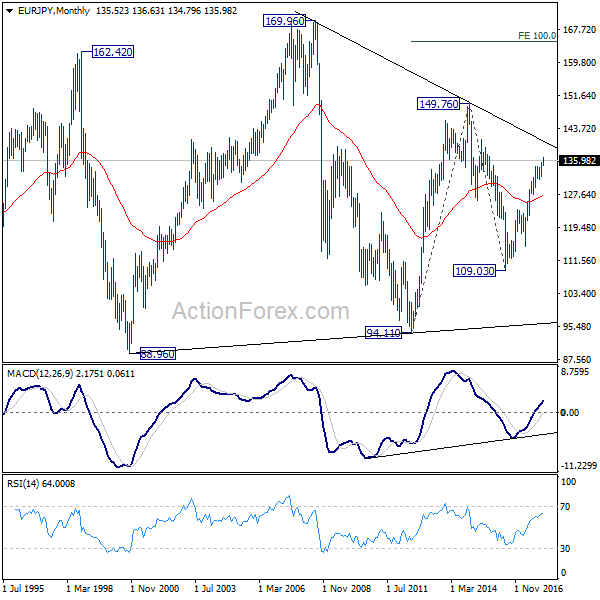
In the long term picture, at this point, there is no clear indication that rise from 109.03 is resuming that from 94.11 (2012 low). Hence, we'd be cautious on topping below 149.76 to extend range trading. Nonetheless, firm break of 149.76 will indicates strong underlying buying. In such case, EUR/JPY will target 100% projection of 94.11 to 149.76 from 109.03 at 164.68.
EUR/GBP Weekly Outlook
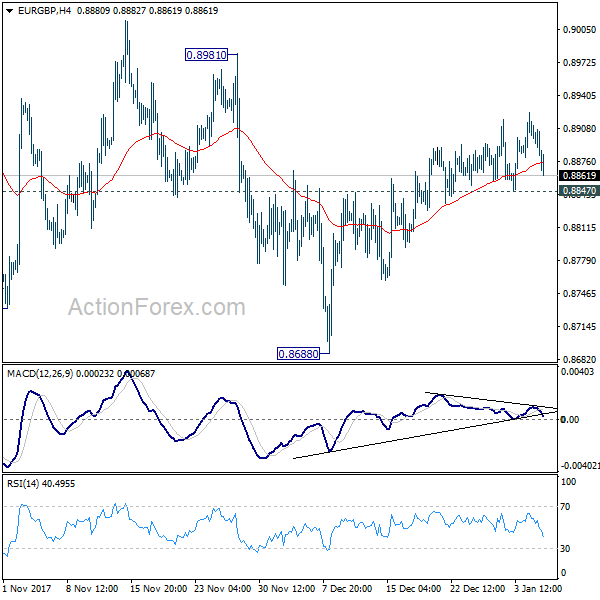
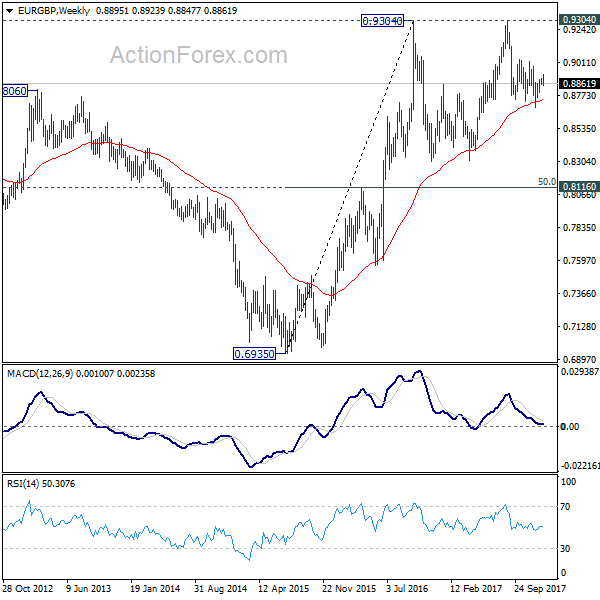
EUR/GBP edged higher to 0.8923 last week but continued to lose upside momentum, as seen in 4 hour MACD. Initial bias remains neutral this week first. On the downside, break of 0.8847 minor support will argue that the rebound form 0.8688 has completed. In such case, intraday bias will be turned back to the downside for 0.8688 support. Break will resume whole fall from 0.9305. On the upside, break of 0.8981 resistance is needed to confirm upside momentum. And in that case, near term outlook will be turned bullish for retesting 0.9305.
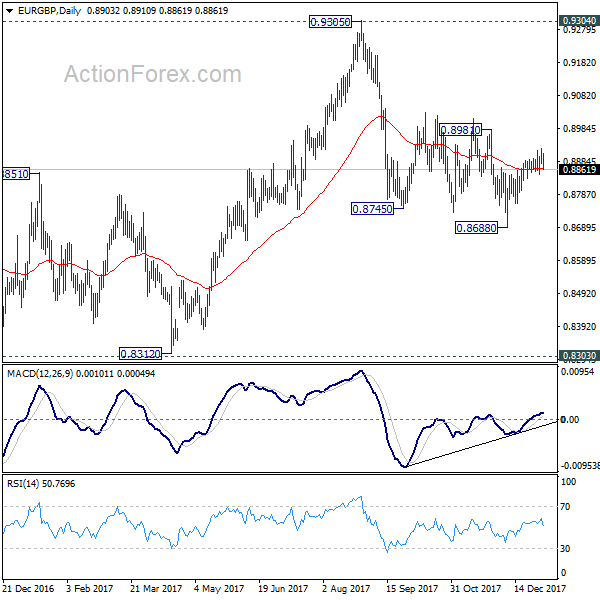
In the bigger picture, there are various ways to interpret price actions from 0.9304 high. But after all, firm break of 0.9304/5 is needed to confirm up trend resumption. Otherwise, range trading will continue with risk of deeper fall. And in that case, EUR/GBP could have a retest on 0.8303. But we'd expect strong support from 0.8116 cluster support (50% retracement of 0.6935 to 0.9304 at 0.8120) to contain downside.
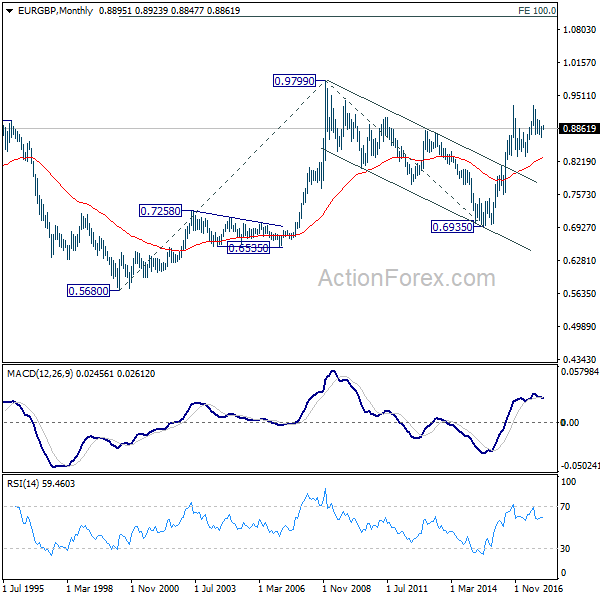
In the long term picture, we're holding on to the view that rise from 0.6935 (2015 low) is resuming the up trend from 0.5680 (2000 low). Hence, after the consolidation from 0.9304 completes, we'd expect another medium term up trend through 0.9799 to 100% projection of 0.5680 to 0.9799 from 0.6935 at 1.1054.
EUR/AUD Weekly Outlook
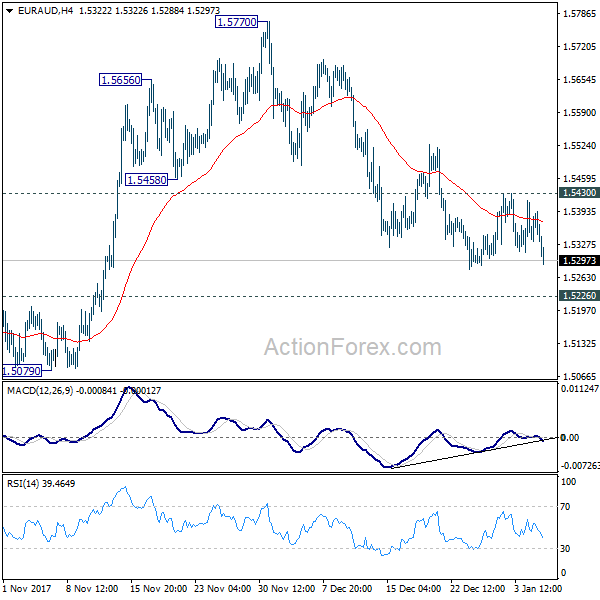
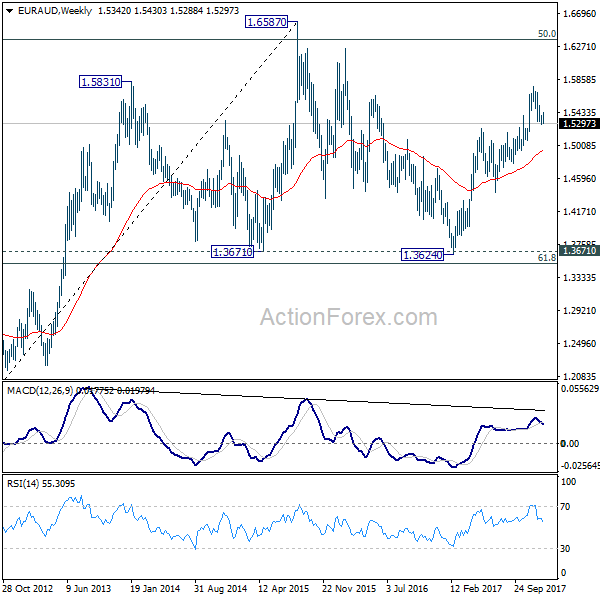
EUR/AUD's correction from 1.5770 continued last week and outlook is unchanged. Further decline could be seen initially this week. But still, near term outlook stays bullish as long as 1.5226 resistance turned support holds. Break of 1.5430 minor resistance will now indicate completion of the correction and turn bias back to the upside for retesting 1.5770. However, sustained break of 1.5226 will indicate larger reversal and target 1.4949 support next.
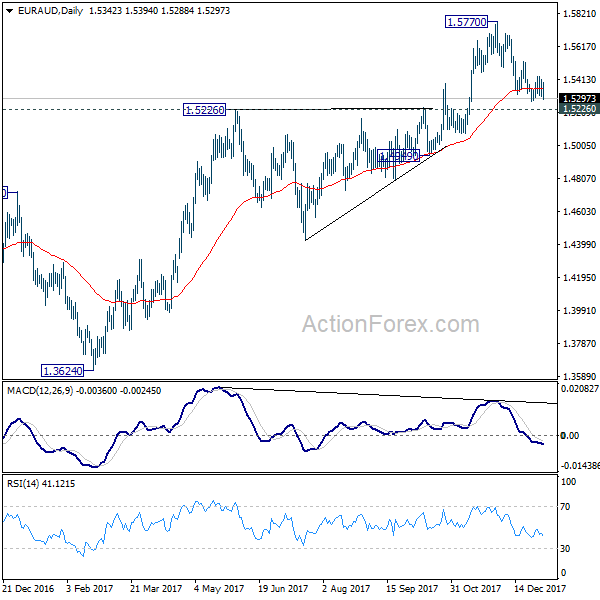
In the bigger picture, we're holding on to the view that corrective decline from 1.6587 medium term top (2015 high) has completed at 1.3624. Rise from 1.3624 is expected to extend to retest 1.6587. We'll hold on to this bullish view as long as 1.5226 resistance turned support holds. Firm break of 1.6587 will resume long term rise from 1.1602 (2012 low). However, sustained break of 1.5226 will indicate trend reversal and target 1.3624 again.
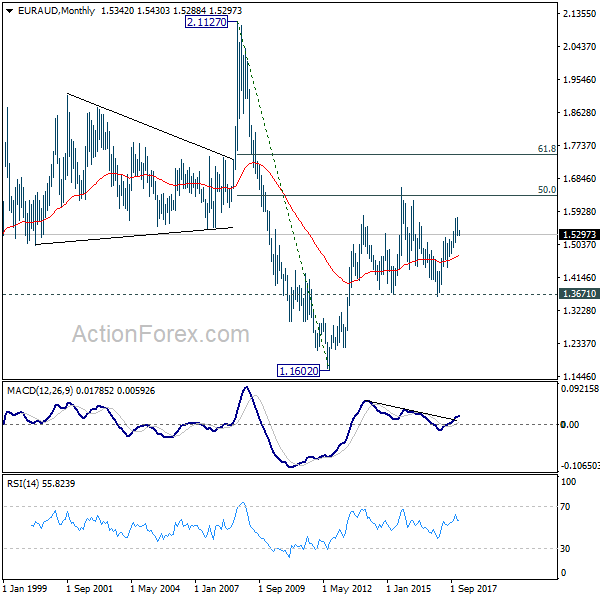
In the longer term picture, the rise from 1.1602 long term bottom isn't over yet. We'll keep monitoring the development but there is prospect of extending the rise to 61.8% retracement of 2.1127 to 1.1602 at 1.7488 and above. However, sustained trading below 1.3671 should long term reversal and target 1.1602 long term bottom again.
EUR/CHF Weekly Outlook
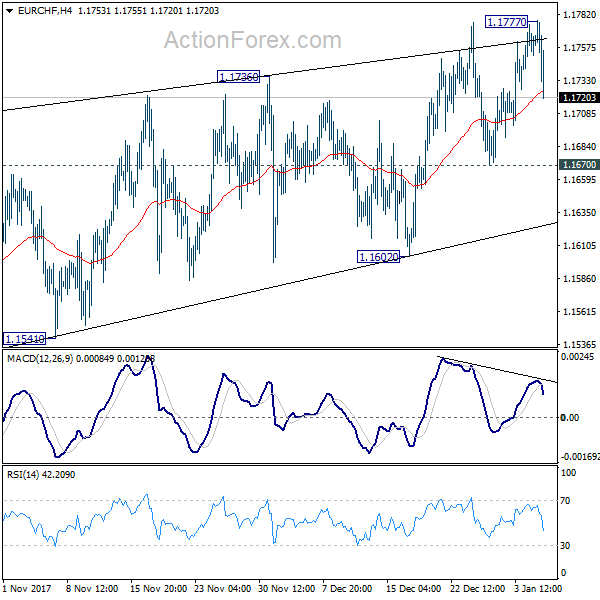
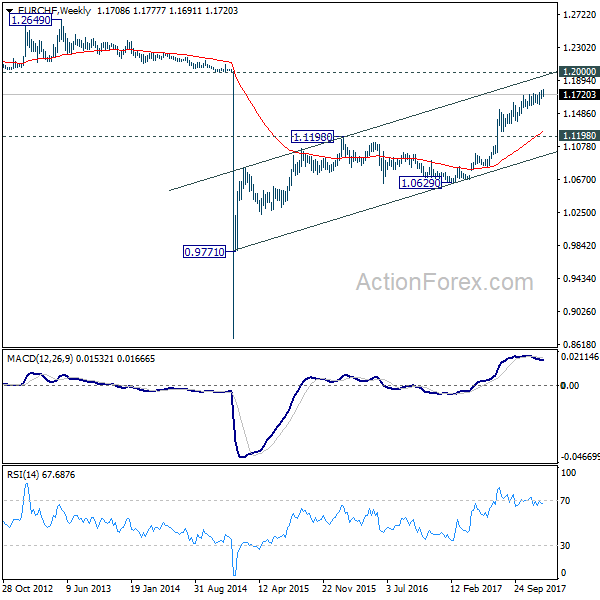
Despite edging higher to 1.1777 last week, EUR/CHF quickly reversed and closed at 1.1720. We're holding on to the view that it's close to topping, if not formed. And even in case of another rise, strong resistance should be seen well below 1.2 handle to bring medium term reversal. On the downside, below 1.1670 minor support will turn bias to the downside for 1.1602 support first. Further break of 1.1602 will indicate reversal and turn outlook bearish for 1.1387 and below.
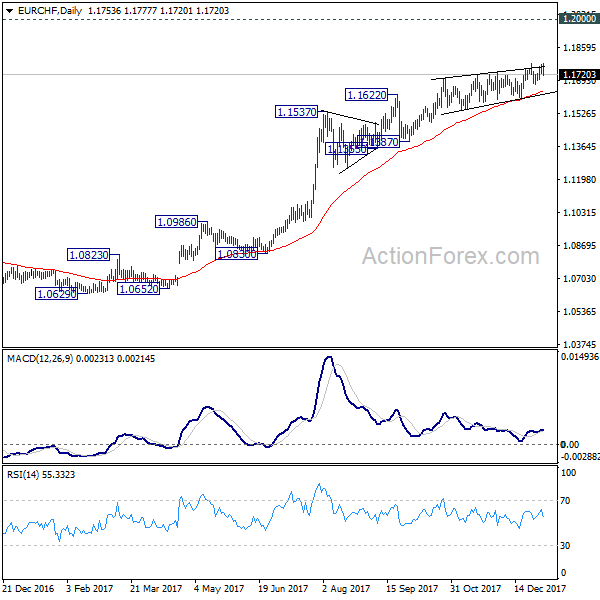
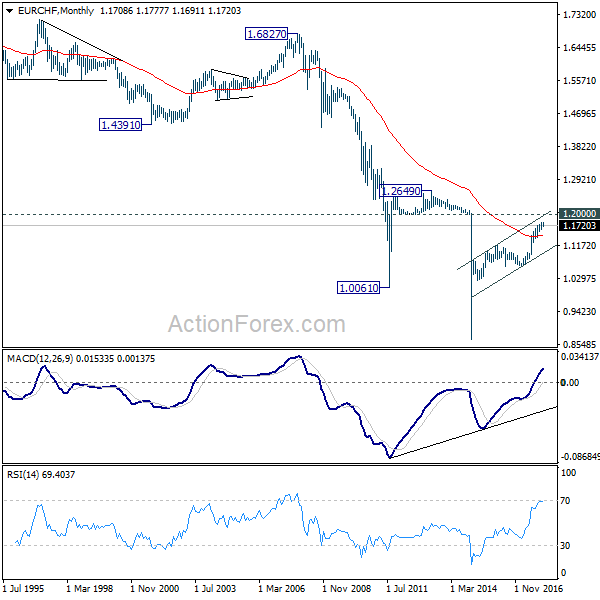
In the bigger picture, while a medium term top could be around the corner, there is no change in the larger outlook. That is, long term rise from SNB spike low back in 2015 is still in progress and would extend. As long as 1.1198 resistance turned support holds, we'll hold on to this bullish view and expect another to prior SNB imposed floor at 1.2000. Though, we'll reassess the outlook if 1.1198 is firmly taken out.
Global Stocks Started 2018 With Break-Loose Rally, Yen and Swiss Franc Suffered
Risk appetite dominated the markets last week and with global equities having a stellar start to 2018. With that, Japanese Yen and Swiss France ended as the two weakest ones. Dollar attempted to rebound multiple times but failed. Non-farm payrolls data were solid even though the headline number missed expectations. But it nonetheless gives no push for Fed to quicken it's rate path. Euro was also relatively firm throughout the week, until data showed headline and core inflation slowed in December. Sustainable strength was seen in commodity currencies. In particular, Canadian Dollar ended as the star as double boosted by strong job data and surge in oil price.
DOW nears 25330 projection level
All three major US indices, DOW, S&P 500 and NASDAQ closed at new record highs last week. What's more impress is the strong momentum as some described as "out-of-the-gate". And first week of the year performance is not seen in decades. Underlying, there is optimism that the Republican's tax cut would boost corporate profits as well as consumer spending. Non-farm payroll report is seen as another factor prompting the 220 pts rally in DOW on Friday. While the headline job number missed, 148k growth was not a disastrous number that indicated anything bad in the economy. Instead, the small miss could keep Fed cautious on it's rate path and reduce the risks of over-supressing growth.
With last week's strong rally, DOW is now inch from 200% projection of 20379.55 to 22179.11 from 21731.12 at 25330.24. There could be some set back from this projection level for retreat. But near term outlook will stay bullish as long as 24876.07 resistance turned support holds. The long term up trend remains in an acceleration phase for next target at 261.8% projection at 26442.36.
FTSE extended record run
FTSE's record run started late in December after the agreement between UK and EU to move on to trade talks in Brexit negotiation. And such record run continued in the first week of 2018. What's impressive is that rise in stocks was accompanied by rally in Sterling too. This could have marked a big shift in the underlying forces. That is, FTSE's strength is no longer driven of Sterling's depreciation, as it was after Brexit referendum. Instead, business investments could be coming back as there is increasing optimism of at least a smoother Brexit. At the same time, BoE interest rates are still close to record lows. And the central bank will likely stay hold their hands off until the next phase of Brexit negotiation is cleared.
Technically, there was strong support seen from the rising 55 week EMA. And, the long term channel is firmly taken out by the rise since early December. FTSE should now be on track to extend the record run to 61.8% projection of 5499.50 to 7598.99 from 7289.35 at 8586.83 in medium term.
China stocks also rebound strongly
Things are looking good in Asia too with Nikkei hitting 26 year high. Strong rebound was also seen in China's Shanghai composite. Technically, the SSE index should have defended 55 week EMA as pull back from last year's high at 3450.49 completed at 3254.17. Retest of 3450.49 should be seen in near term and break will resume long term rise from 2016 low at 2638.30. Momentum of such rise is not too convincing and could just be a corrective move. But still, break of 3450.49 would bring another up leg to 38.2% retracement of 5178.19 to 2638.30 at 3608.53.
WTI breached 62 with strong rally
Another key development in the past two weeks was the rally in oil price. WTI crude oil extended the long term rebound from 26.05 (2016 low) and hit as high as 62.04. Based on the current momentum, WTI should have least have a test on the next cluster resistance level at 66.87/67.53. They are 50% retracement of 107.68 to 26.05 at 66.87 and 100% projection of 26.05 to 51.67 from 42.05 at 67.53. This bullish view will hold as long as 56.09 support holds.
Trading strategy
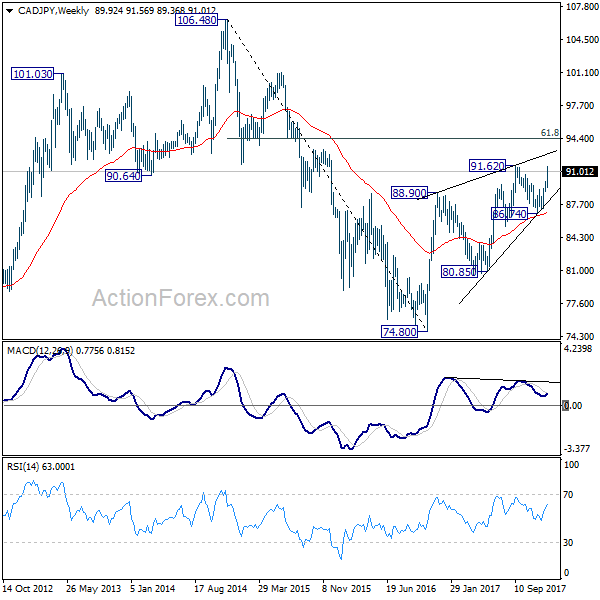
The above analysis suggests that risk appetite is here to stay globally. Yen and Swiss Franc will likely remain the weakest ones in near to medium term. Canadian Dollar was boosted by stellar employment data release on Friday, which sealed the deal for BoC to hike again in Q1. And the central bank could indeed raise interest rate as soon as during the January meeting. And above mentioned bullish outlook in oil price will only give the Loonie more strength. Given these conditions, going long in CAD/JPY is what we'd suggest for position trading.
With last week's rise, CAD/JPY yet to take out 91.62 resistance. There could be some consolidations early this week before CAD/JPY surges pass through 91.62. Hence, we'll try to buy it on pull back to 90.00, or on break of 91.70 (slightly above 91.62). 61.8% retracement of 106.48 to 74.80 at 94.37 is first target. While bearish divergence condition is seen it weekly MACD, the structure of the rise from 74.80, with strong impulsive upmove, suggests that it's more a 1-2-i-ii pattern, than a triangle. Hence, we'd probably see more upside acceleration ahead powering through 94.37 toward 106.48 in medium term.
USD/JPY Weekly Outlook
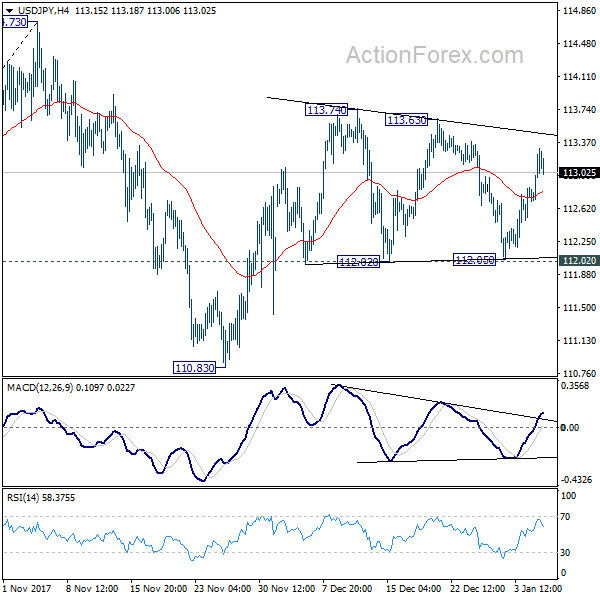
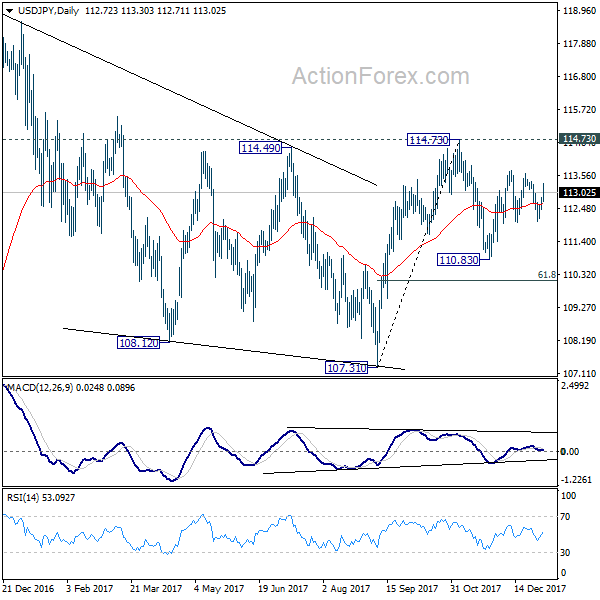
USD/JPY dipped to 112.05 last week but was supported above 112.02 and rebounded. As the pair stays in range of 112.02/113.74, initial bias remains neutral first. But again, outlook remains cautiously bullish as long as 112.02 holds and further rise is in favor. Break of 113.74 will resume the rebound from 110.83 and target 114.73 key resistance. Decisive break there will carry larger bullish implications. However, break of 112.02 will likely extend the corrective pattern from 114.73 with another leg through 110.83 support.
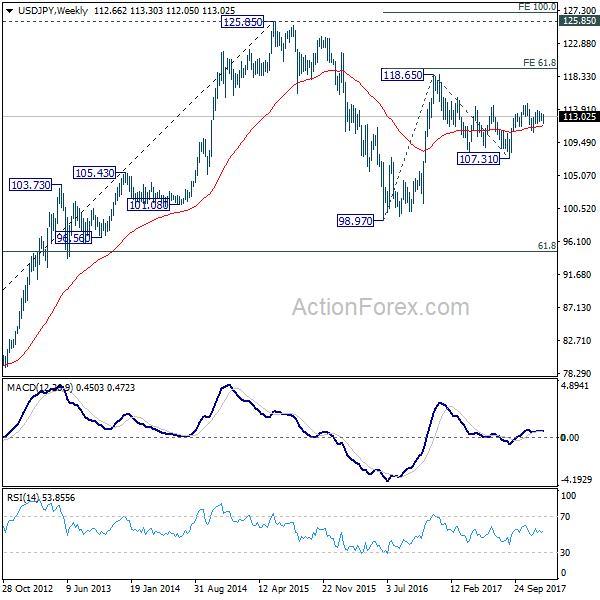
In the bigger picture, we're holding on to the view that correction from 118.65 is completed at 107.31. And medium term rise from 98.97 (2016 low) is going to resume soon. Sustained break of 114.73 should affirm our view and send USD/JPY through 118.65. However, break of 107.31 will dampen this view and extend the medium term fall back to 98.97 low.
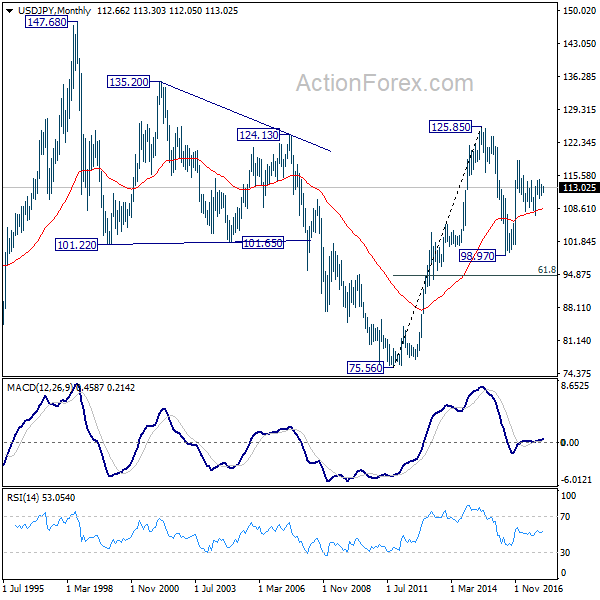
In the long term picture, the rise from 75.56 (2011 low) long term bottom to 125.85 top is viewed as an impulsive move, no change in this view. Price actions from 125.85 are seen as a corrective move which could still extend. In case of deeper fall, downside should be contained by 61.8% retracement of 75.56 to 125.85 at 94.77. Up trend from 75.56 is expected to resume at a later stage for above 135.20/147.68 resistance zone.
Will Gold Shine Even Brighter in 2018?
Gold was one of the main winners of 2017. Intensifying geopolitical tensions, particularly on the Korean peninsula and in the Middle East, combined with the dollar's sharp plunge helped gold prices to finish the year more than 13% higher. Heading into 2018, the outlook for the precious metal continues to appear positive, as geopolitical risks are unlikely to go away anytime soon, and the US dollar does not seem ready to make a strong comeback yet.
Trying to forecast geopolitical developments is inherently difficult. Not only due to the vast number of variables involved, but also because a political narrative can change almost instantly, without any warning signs. Pricing geopolitical risk can be equally challenging, as major events such as military conflict can have a very high impact on markets, but are usually low-probability outcomes. This was perfectly demonstrated by the crisis on the Korean peninsula this past year, with traders appearing uncertain over how much they should react to the erratic and unpredictable missile launches by North Korea.
How, and whether, the Korean story develops could be a major determinant for gold's forthcoming direction. Even though the latest headlines suggest that tensions may be finally easing – with South and North Korea agreeing to talk- that could change practically overnight, as mentioned above. Another point to watch is the ongoing proxy war between two of the Middle East's biggest powers; Saudi Arabia and Iran. A potential escalation in either of these crises would likely prove beneficial for the yellow metal, due to its safe-haven status. Elsewhere, political uncertainty may be set for a comeback in Europe. Italy will hold its General Election in early March, and one of the main parties has previously advocated for holding a referendum on the euro. Then, there is the ongoing Catalonian crisis to consider as well. These risks could continue to provide support for gold in 2018, even in the absence of any "black swan" events to add further to gold's appeal – black swans being unpredictable risk-off events with extreme consequences, such as the 2008 meltdown.
Politics aside, the other crucial subject for gold prices is how the US dollar will perform. Fluctuations in the greenback can have massive effects on the yellow metal, which is denominated in dollars. This implies that when the dollar declines, it becomes cheaper to buy gold with other currencies, thereby increasing the demand for the precious metal. A stronger dollar, on the other hand, makes gold seem comparatively more expensive and thus usually hurts demand and prices.
While a big fall in the dollar from current levels is not very probable, traders are not betting for major gains either given that monetary divergence between the US and other major economies will likely continue to narrow. Instead, the greenback's performance may depend to a significant degree on the performance of its counterparts, a view enhanced by the latest polls from Reuters, which indicate that the USD is expected to gain against the yen, but underperform the euro in 2018. If this is the case indeed, the greenback may be a relatively neutral factor for gold prices in 2018.
Overall, the medium-term outlook for gold appears cautiously bullish. The metal could finish 2018 somewhat higher, perhaps near its recent highs at $1357. An upside break of that zone may set the stage for advances towards the $1375 territory, but for gold to rally much further than that, it may require a major risk-off event and/or continued weakness in the USD. On the other hand, in case geopolitical risks remain subdued or the dollar regains some strength, the precious metal could drift lower. A potential break back below $1300 would bring the metal back within the sideways range between $1200 – $1300, and could be the catalyst for further declines, perhaps towards the lower bound of that range.
Weekly Economic and Financial Commentary: Economic Data Escapes the Freeze
U.S. Review
Hot Data Releases Warm the First Week of 2018
- In the first major data release of the year, the ISM manufacturing index soared to its second fastest pace of expansion in six years. New orders fueled the rise, which bodes well for momentum to start 2018. The service sector is also expanding, though the ISM non-manufacturing index slipped in December to 55.9.
- Construction spending and factory orders continue to support our call for a solid Q4 GDP print of 2.5 percent.
- This morning's jobs report was somewhat softer than expected but still highlighted the strength of the U.S. labor market, which added 148,000 jobs in December. The jobless rate held steady to end 2017 at 4.1 percent.
Economic Data Escapes the Freeze
The ISM manufacturing index for December remained in solid expansion territory, coming in at a balmy 59.7 to extend a five-month streak above 58. The last time the index posted such a run was in 2004, then 1987 prior to that. Activity rose across most sub-categories, particularly new orders, which surged to its 13-year high point. That suggests solid momentum to start 2018. Factories already appear to be having trouble keeping up with orders, as evidenced by the elevated readings for both supplier deliveries and order backlogs. That also allowed for some much needed pricing power, as prices paid rose 3.5 points to 69. International demand was also a large contributor to the increase in orders, as improving economic conditions abroad continue to buoy exports. Better economic fundamentals abroad combined with continued business optimism domestically have set the stage for a strong start to the new year for manufacturers. We will be watching the hard data for orders closely in coming months as they have yet to mirror the ISM outlook. Still, the December ISM report suggests some upside risk to our equipment forecast.
Construction outlays continued to increase in November, notching the fourth-straight month of total spending growth. Strength stemmed from a bevy of sectors. Public spending continued to build on the rise fueled by storm repairs, but it remains down on a year-to-date basis. Residential outlays were strong in November, specifically for single-family homes and remodels and repairs. Multifamily building was down on the month but positive year to date. Strength going forward is likely to come from the singlefamily market, as multifamily has largely topped out this cycle. Total construction spending was up at a strong 8.8 percent three month average annualized growth rate, which bodes well for Q4 GDP growth. We expect residential investment rose 9 percent.
This morning's jobs report was lukewarm relative to consensus expectations. There were 148,000 net new jobs created in the last month of 2017, and revisions to previous months put the average gain over the past three months at 203,700 jobs. That is the highest three-month average posted since September 2016 and suggests solid momentum to start 2018. The U.S. labor market added 2.055 million jobs over the year. That marks a deceleration from previous years of the cycle, which is to be expected given how low the unemployment rate has drifted. The national unemployment rate held steady to end 2017 at 4.1 percent, 0.6 points lower than a year ago. The labor force participation rate was unchanged over the period. Wage gains perked up in December, rising 0.3 percent on the month. Wage growth remains lackluster over the year, rising 2.5 percent from December 2016. The low unemployment rate should put more upward pressure on wages in 2018. We expect the unemployment rate will move even lower over the next year to end 2018 at 3.8 percent.
While the 148,000-job gain was lower than even our belowconsensus expectations for December, the industry detail showed jobs that were added were in a broad range of sectors. Retail trade was the only major sector to post a decline, which likely reflects the shift away from brick and mortar holiday staffing.
U.S. Outlook
CPI • Friday
Consumer price inflation data for December are slated to be released this coming Friday. Consumer price inflation firmed in November, with the CPI index rising 0.4 percent. That pushed the year-ago rate up to 2.2 percent compared to 1.7 percent last November. While the headline gain was in line with expectations, the 0.1 percent rise in core inflation was weaker than anticipated. However, core inflation has been picking up on trend, with the three-month annualized rate coming in at 1.9 percent. With much of the weakness in November core inflation coming from the more volatile components, we continue to expect inflation to trend higher in the coming months.
The Fed's preferred measure of core inflation, the PCE deflator, has reached or surpassed the Fed's 2.0 percent target in only five months of the current expansion. As inflation should more clearly pick up in the coming months, we expect the FOMC will continue on with its gradual pace of tightening in the year ahead.
Previous: 2.2% Wells Fargo: 2.1% Consensus: 2.1% (Year-over-Year)
Retail Sales • Friday
The recent solid string of retail sales prints is giving more credence to the strong consumer confidence numbers. Retail sales figures for December are set to be released this coming Friday. With the 0.8 percent increase in retail and food services sales in November, plus the upwardly revised October number, from 0.2 percent to 0.5 percent, the last quarter of the year is shaping up to end 2017 on a joyful note.
Perhaps the most market-changing release in November was the strong control group sales print. Control sales, which are retail sales less food services, gas, automobiles and building materials, and used for the calculation of GDP, surged 0.8 percent in the month. We expect another strong performance by the U.S. consumer during the last quarter of the year based on the monthly data. Likewise, we look for this strength to continue into Q1-2018.
Previous: 0.8% Wells Fargo: 0.5% Consensus: 0.4% (Month-over-Month)
Business Inventories • Friday
This coming Friday is a busy day in the world of economic indicators as business inventory data for November are also set to be released. In October, and for only the second time this year, businesses dialed back inventories on the month. The entire decline was in the wholesale sector, which was down 0.5 percent. Retailers were flat and manufacturers actually increased stockpiles 0.2 percent. Within retail, it was a mixed picture with declines in autos offset by gains in other areas. Sales posted a 0.6 percent overall increase with gains of roughly the same magnitude across retail, wholesale and manufacturing.
After a big 0.8 percentage point boost to Q3 GDP, October's print suggests less support from inventories in Q4. November's data will help us forecast the net effect of the inventory line on the final GDP release of 2017.
Previous: -0.1% Wells Fargo: 0.3% Consensus: 0.3% (Month-over-Month)
Global Review
Global Economic Growth Looks Sustainable for Now
- The expansion in the global economy looks promising and sustainable for now with manufacturing activity remaining strong and in some instances improving as 2017 came to an end.
- Brazilian industrial production increased 0.2 percent in November sequentially and by a strong 4.7 percent on a yearearlier basis. Both October's month-over-month and year-over year changes were revised up, from 0.2 percent to 0.3 percent and from 5.3 percent to 5.5 percent, respectively.
- In Chile, the monthly economic activity index increased a strong 0.7 percent in November after declining 0.3 percent in October, both sequentially and in seasonally adjusted terms.
Global Economic Growth Looks Sustainable for Now
The expansion in the global economy looks promising and sustainable for now with manufacturing activity remaining strong and in some instances improving as 2017 came to an end. This is good news for overall economic growth expectations for 2018 and presages more changes coming to a "theater-near-you" in the coming months and quarters as policymakers, but especially monetary policymakers across the world, continue to revise their views regarding quantitative easing programs and interest rates. This policy accommodation has served as the backbone of the global economy since the Great Recession in 2008 and 2009.
These revised expectations from policymakers will probably determine the levels of volatility in markets across the world as analysts continue to gauge the prospects for potentially more tightening across the world. For now, certainty in this shift is clear in the United States, as the Federal Reserve continues its tightening campaign, but it is not that clear from other large central banks in the rest of the world.
Meanwhile, geopolitical risks may also be at play during the year even though these risks are difficult to quantify. For more on these risks please see: "The Global Economic Expansion: Mind the Risks," which is available in our website or by request.
Brazilian and Chilean Economy on the Mend
With the release of November 2017 industrial production data for Brazil and the economic activity index for Chile, it is clear that both economies are on the comeback trail, Brazil from its worst recessionary period in history and Chile from an uncharacteristically weak economic period.
The Brazilian industrial production index increased 0.2 percent in November sequentially and by a strong 4.7 percent on a yearearlier basis, not seasonally adjusted. October's month-overmonth and year-over year changes were revised up, from 0.2 percent to 0.3 percent and from 5.3 percent to 5.5 percent, respectively. Thus, the industrial sector slowed down slightly in November but remained strong. Of course, these numbers need to be taken in the context of a depressed industrial sector over the past several years, so the improvement in the sector is still in its infancy. However, the strong performance over the past several months is encouraging. One of the biggest reasons for the slowdown in November was a relatively weak automobile sector, where output declined 0.7 percent sequentially. However, the sector is up 18.8 percent on a year-earlier basis.
In Chile, the monthly economic activity index increased a strong 0.7 percent in November after declining 0.3 percent in October, sequentially and in seasonally adjusted terms. The Chilean economy also improved on a year-ago basis, posting growth of 3.2 percent versus a 2.2 percent rate for the year ending in October. This was the strongest year-over-year print for the Chilean economy since a 4.0 percent rate in February 2016. Thus, we expect both the Brazilian and the Chilean economies to continue to strengthen in 2018, contributing to the global economy.
Global Outlook
Canadian Housing Starts • Monday
Residential construction activity in Canada has been trending higher for the past several years. In November, the annualized pace of housing starts crested above a quarter million. That is just spitting distance from the fastest pace seen over the past decade.
We do not forecast housing starts in Canada, but in past periods a surge like the one seen in November has proved to be short-lived, although the uptrend in the 12-month moving average suggests a firming trend. Despite some recent volatility in home prices, elevated values suggest some room in the market for new inventory.
Most of the action lately has been in multi-family with that series hitting 175,000 in November, an all-time high. December figures for housing starts will print on Monday of next week.
Previous: 252K Consensus: 190K
U.K. Industrial Production • Wednesday
Prospects for growth in the United Kingdom are dependent, at least to some degree, on the Brexit negotiation process. Unfortunately, there is simply no realistic way of knowing the outcome of that process at this time.
In this climate of uncertainty, we are particularly attentive to the risk that uncertainties might cause businesses to retrench via lower investment or to cut back on hiring, which could cause the British economy to weaken further.
Industrial production figures for November due out on Wednesday will offer a measure of activity in the factory sector. Output was flat in October after a 0.7 percent pick-up in the prior month. As the nearby chart shows, the year-over-year figures have been quite volatile in recent years. Even a modest monthly gain in November would likely still result in a dip in the year-over-year rate.
Previous: 3.6% (Year-over-Year) Consensus: 1.8%
Australian Retail Sales • Wednesday
As the nearby chart shows, retail sales activity in Australia has seen the rate of growth trending lower over the past three years or so. Consumers in Australia face elevated levels of household debt as home prices have risen dramatically in some markets.
This problem has been compounded by the fact that wage growth has been under pressure in recent years making it harder for households to free up extra spending money.
The unemployment rate has been trending lower, however, and the 5.4 percent jobless rate in November was at a four-year low. Retail sales shot up 0.5 percent in October marking the second-largest monthly jump in store sales for 2017. The retail sales report for November will hit the wire on Thursday of next week and that will tell us how Aussie retailers were faring heading into the key summer selling months around Christmas.
Previous: 0.5% (Month-over-Month) Consensus: 0.4%
Point of View
Interest Rate Watch
Fed on Track for March Hike
Minutes from the December FOMC meeting suggest that the Fed will likely raise the fed funds rate again in March in what we believe will be the first of three rate increases this year. That comes despite some continued concerns about the outlook for inflation and more recent chatter about the flattening of the yield curve. Growth is expected to remain above its long-term rate next year, however, due in part to the tax bill providing a modest bump to consumer spending and capital investment.
Hinging on Inflation
Inflation remains the most prominent risk to the rate path. Inflation's continued shortfall from the Fed's target and lower inflation expectations led to dissents from Charles Evans and Neel Kashkari, but concern looked to extend to at least one other non-voter. Nevertheless, many members remain of the belief that as the labor market tightens, higher wages and inflation will follow.
The uncertainty surrounding which matters more for inflation over the medium term— lower expectations or slack—left inflation noted as both an upside and downside risk to the current path of rate hikes.
Yield Curve—Not Unusual
The flatter yield curve may have some analysts thinking the Fed may have to backoff their current rate path. Yet, despite Kashkari highlighting it in his dissent, the Committee largely remained unconcerned. Some flattening was to be expected with the FOMC raising short-term rates, and the degree of flattening "was not unusual by historic standards." When the spread between 10- and 2-year Treasuries was similarly narrow in the Spring 2005, the FOMC raised rates another nine times.
Financial Conditions—Still Easy
While some members look increasingly eager to demonstrate that the FOMC's inflation goal is symmetric, a couple others noted that keeping policy highly accommodative continues to pose risks to financial stability. That risk, however, remains more difficult to measure than a two percent inflation goal.
Credit Market Insights
Financial Conditions Remain Easy
Financial conditions remain easy compared to historical norms. While they tightened somewhat through the middle of 2017, conditions eased again in November and December, according to the Chicago Federal Reserve's National Financial Conditions Index (NFCI). The NFCI summarizes 105 measures of financial activity. Decreasing risk, looser credit conditions and higher leverage are associated with a declines in the NFCI, and represent looser financial conditions.
Despite the Federal Open Market Committee (FOMC) raising rates three times in 2017 and beginning to wind down its balance sheet, the NFCI indicates that financial conditions have fallen to levels not seen since the mid-1990s. Recent strength in the economy may encourage investors to take on more leverage, which would contribute to lower values for the NFCI. However, even the adjusted NFCI, which controls for the state of the business cycle and level of inflation, shows that financial conditions have eased since late-2015 when the Fed began tightening monetary policy.
The NFCI suggests that consumers have been cushioned so far from the effects of a higher federal funds rate. However, we are expecting the FOMC to raise rates three more times in 2018, and with continued rate hikes financial conditions will likely tighten in the year ahead. However, historically low debt payment-to-income ratios mean that households will likely be able to manage somewhat tighter financial conditions.
Topic of the Week
Can Consumers Keep the Party Going?
The improvement in consumer confidence over the past year has been followed by a strong response from consumers as they dipped further into their pockets while bringing down the savings rate to complement the low rate of growth of disposable personal income. However, real disposable personal income growth has been improving lately, just in time to help consumers keep the current party going. Furthermore, the expectation of a still-strong employment market for this year and an even lower rate of unemployment should be enough to keep consumers happy. We should also see continued improvement in salaries and wages if the labor market continues to tighten as we are anticipating. At the same time, Americans are tapping into credit cards to complement the weak growth in disposable personal income. However, Americans do not seem to be overstretching in terms of credit card loans as revolving credit growth is still relatively low compared to the past and credit card delinquency rates remain low. Today, revolving credit is growing at about 5 to 6 percent on a year-earlier basis. Even the rate of growth of student loans has slowed down considerably over the past several years (bottom graph).
Will it be sustainable? The fact that the effects of the tax reform on disposable personal income will start to take effect in 2019 will probably give more staying power to the improvement in consumption. So yes, it should be sustainable at least until the end of 2019.
So what could go wrong? Inflation and higher-thanexpected interest rates. If the tax reform, i.e., fiscal policy, adds to stronger economic growth more than what we are estimating, then we could run into issues with higher inflation to a point that pushes the Federal Reserve to step up its tightening campaign. And for those who think that inflation is no longer a problem, we must remind them that we have been there before, when the talk was that the business cycle was dead and then the Great Recession put that thought to rest. That is, never underestimate the power of economic theory.