
Sample Category Title
EUR/GBP Daily Outlook
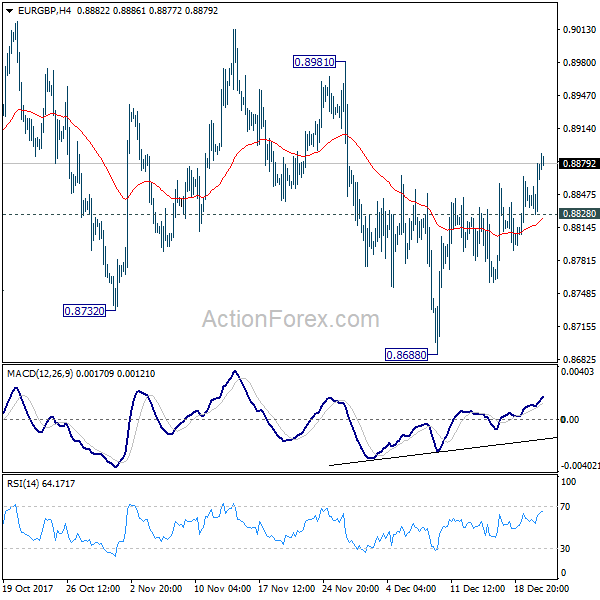
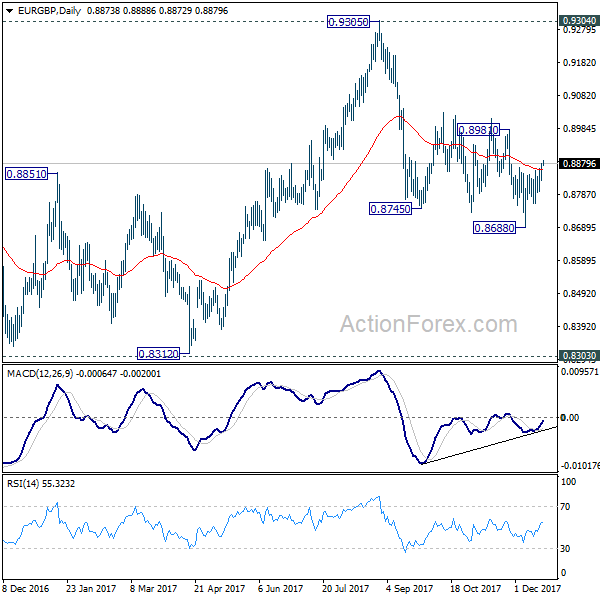
Daily Pivots: (S1) 0.8842; (P) 0.8860; (R1) 0.8892; More...
EUR/GBP's rebound from 0.8688 extends higher and break of 0.8866 resistance indicates near term reversal, on bullish convergence condition in daily MACD. Intraday bias is turned back to the upside for 0.8981 resistance first. Sustained break there will indicate that whole decline from 0.9305 has completed. In such case, EUR/GBP will target a test on 0.9304/5 key resistance. On the downside, below 0.8828 minor support will turn bias back to the downside for 0.8668 instead.
In the bigger picture, there are various ways to interpret price actions from 0.9304 high. But after all, firm break of 0.9304/5 is needed to confirm up trend resumption. Otherwise, range trading will continue with risk of deeper fall. And in that case, EUR/GBP could have a retest on 0.8303. But we'd expect strong support from 0.8116 cluster support (50% retracement of 0.6935 to 0.9304 at 0.8120) to contain downside.
EUR/AUD Daily Outlook
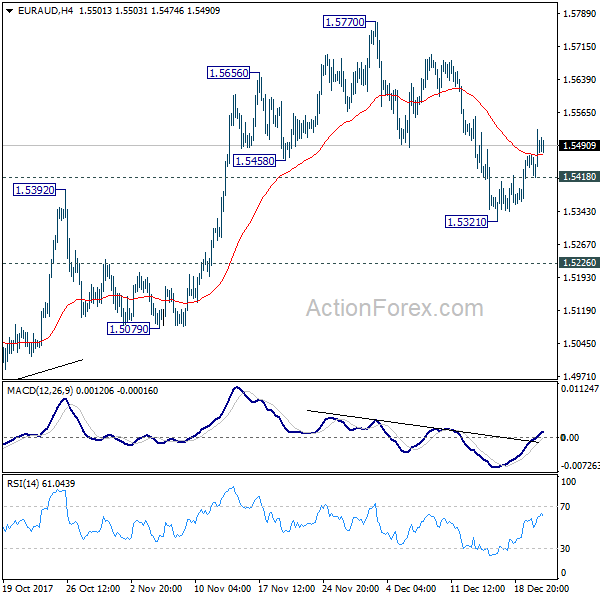
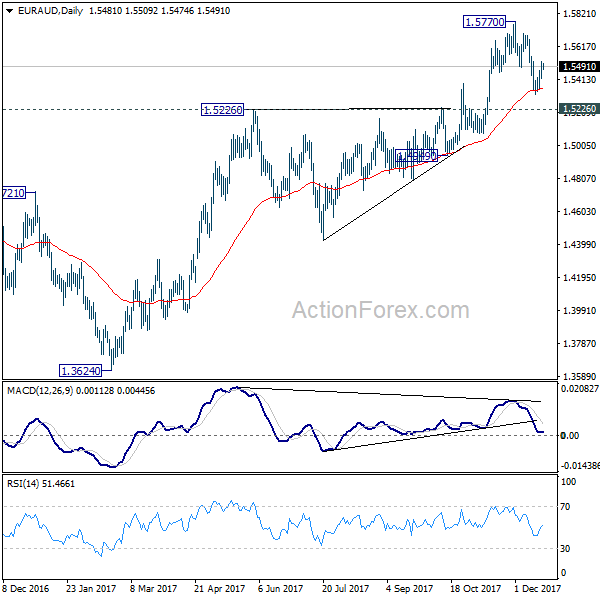
Daily Pivots: (S1) 1.5426; (P) 1.5476; (R1) 1.5533; More....
The break of 1.5482 minor resistance suggests that correction from 1.5770 might be completed at 1.5321 already. Intraday bias is turned back to the upside for retesting 1.5770 first. Break will resume medium term up trend. On the downside, below 1.5418 minor support will extend the correction lower. But after all, outlook will resume bullish as long as 1.5226 resistance turned support holds.
In the bigger picture, we're holding on to the view that corrective decline from 1.6587 medium term top (2015 high) has completed at 1.3624. Rise from 1.3624 is expected to extend to retest 1.6587. We'll hold on to this bullish view as long as 1.5226 resistance turned support holds. Firm break of 1.6587 will resume long term rise from 1.1602 (2012 low). However, sustained break of 1.5226 will indicate trend reversal and target 1.3624 again.
EUR/CHF Daily Outlook
Daily Pivots: (S1) 1.1673; (P) 1.1696; (R1) 1.1738; More...
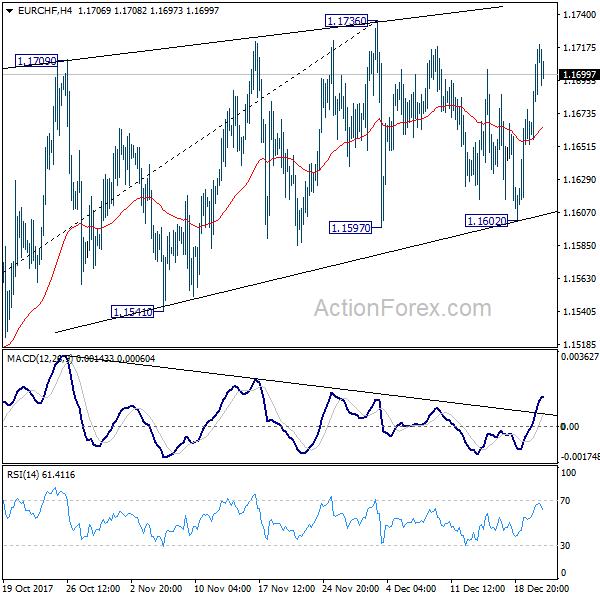
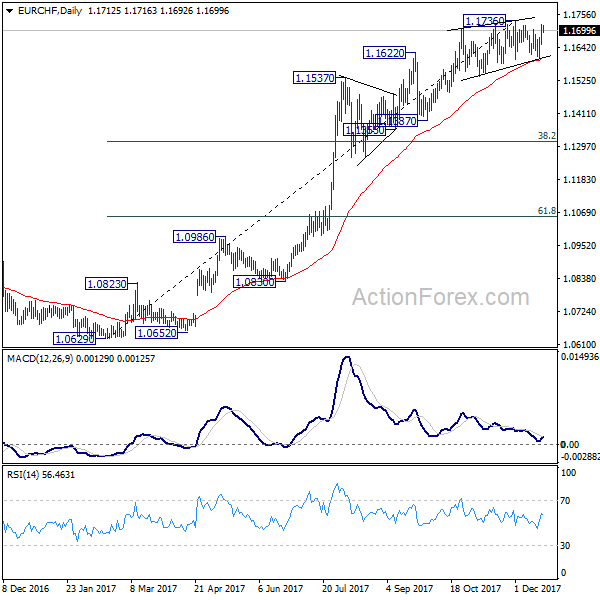
Intraday bias in EUR/CHF remains neutral as it's still bounded in range below 1.1736. We continue to believe that the cross is close to topping, if not formed. On the downside, decisive break of 1.1597 support will a strong sign of trend reversal and should turn outlook bearish for 38.2% retracement of 1.0629 to 1.1736 at 1.1313. However, strong break of 1.1736 will resume medium term up trend from 1.0629 instead.
In the bigger picture, while a medium term top could be around the corner, there is no change in the larger outlook. That is, long term rise from SNB spike low back in 2015 is still in progress and would extend. As long as 1.1198 resistance turned support holds, we'll hold on to this bullish view and expect another to prior SNB imposed floor at 1.2000. Though, we'll reassess the outlook if 1.1198 is firmly taken out.
GBP/JPY Daily Outlook
Daily Pivots: (S1) 151.11; (P) 151.56; (R1) 152.09; More...
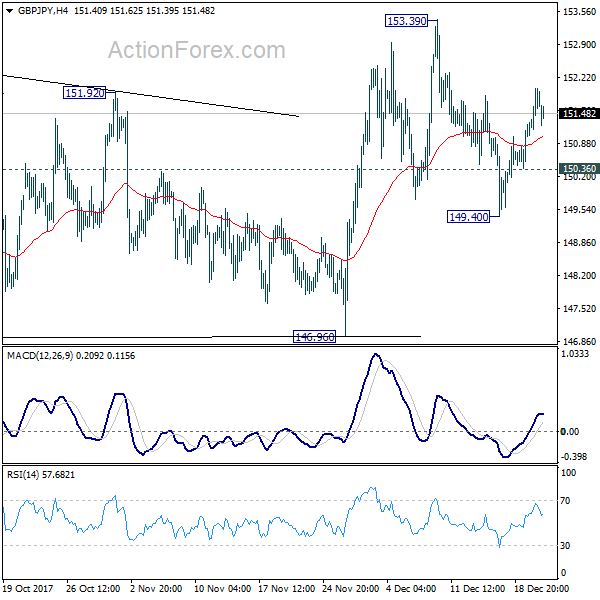
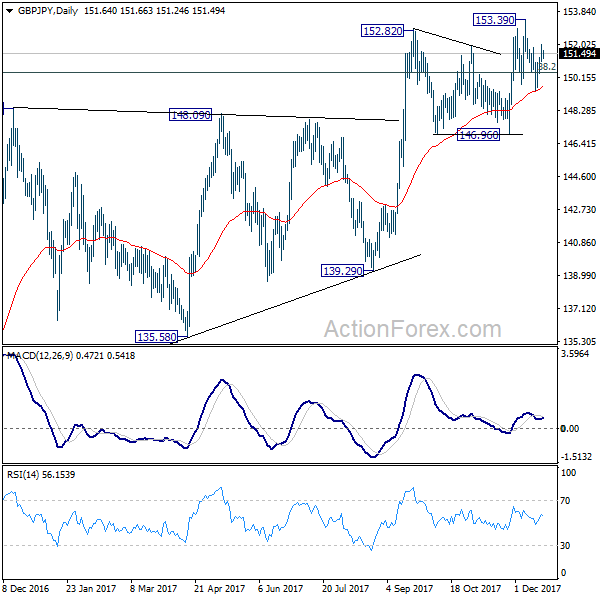
Break of 151.84 minor resistance suggests that pull back from 153.39 might be finished at 149.40. Intraday bias is mildly on the upside for retesting 153.39 first. Break will resume medium term rally. On the downside, below 150.36 minor support will turn bias back to the downside and extend the correction from 153.39. But we'd look for strong support from 146.96 to bring rebound.
In the bigger picture, outlook is mixed up a bit with last week's sharp decline. But still, as long as 146.96 key support holds, medium term outlook remains bullish. Rise from 122.36 is in favor to extend to 61.8% retracement of 195.86 to 122.36 at 167.78. However, break of 146.96 support will indicate trend reversal. And the corrective structure of rebound from 122.36 will argue that larger down trend is resuming for a new low below 122.26.
EUR/JPY Daily Outlook
Daily Pivots: (S1) 133.86; (P) 134.32; (R1) 135.04; More....
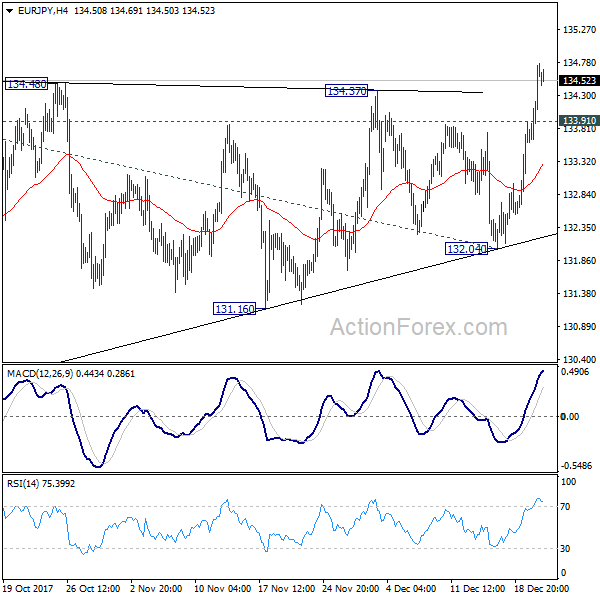
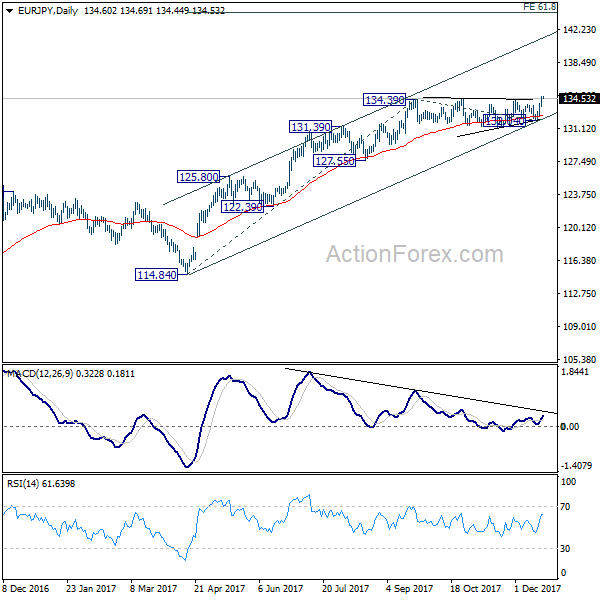
EUR/JPY surges to as high as 134.76 so far. Break of 134.39 resistance indicates resumption of medium term up trend. Intraday bias is now on the upside. Rally from 132.04 should target 61.8% projection of 114.84 to 134.39 from 132.04 at 144.12. Ideally, upside acceleration should be seen in the current move with daily MACD taking out down trend line. On the downside, below 133.91 minor support will turn intraday bias neutral first. But outlook will stay bullish as long as 132.04 key support holds.
In the bigger picture, medium term rise from 109.03 (2016 low) is seen as at the same degree as the down trend from 149.76 (2014 high) to 109.03 (2016 low). Sustained break of 61.8% retracement of 149.76 to 109.03 at 134.20 will pave the way to key long term resistance zone at 141.04/149.76. However, break of 132.04 support will suggest medium term topping and will turn outlook bearish for deeper fall back 55 week EMA (now at 127.82).
BoJ Stands Pat; Power Rally in Treasury Yields Continue
US tax plan has now only one more step to take, President Donald Trump's signature, and it will become law. Market's reactions were relatively muted yesterday after House and Senate approvals. DOW closed slightly down by -0.11% at 24726.65. S&P 500 lost -0.08% to end at 2679.25. In the currency markets, Dollar trades mildly higher today, but remains the second weakest for the week. Yen is the worst performing one as pressured by powerful rally in treasury yields. BoJ's standing pat provides little inspiration to the Japanese currency. Meanwhile, Euro remains the strongest one for the week, followed by Swiss Franc.
BoJ stands pat, dissented again
BoJ left monetary policies unchanged today as widely expected. Short term interest rate target was kept at -0.1%. Under the yield curve control framework, BoJ will continue to buy an annual amount of JPY 80T JGBs to keep 10 year yield at around 0%. Goushi Kataoka dissented again. In the statement, "Kataoka dissented, considering that, taking account of risk factors such as the consumption tax hike and a possible economic downturn in the United States, it was desirable to achieve the price stability target in fiscal 2018, and that it was appropriate for the Bank to purchase JGBs so that yields on JGBs with maturities of 10 years and longer would be broadly lowered."
BoJ maintained the "Japan's economy is expanding moderately, with a virtuous cycle from income to spending operating." Assessments on consumption and and capex were upgraded. "Private consumption has been increasing moderately, albeit with fluctuations, against the background of steady improvement in the employment and income situation." "Capital expenditure continues to increase as a trend as corporate profits and business sentiment improve,"
Trump to sign tax bill into law soon
In the US, the House has finally passed the tax plan yesterday, after voting for a second time, and after Senate approved it. President Donald Trump is now expected to sign the bill into law but the exact timing is unclear yet. One of the main changes in the bill to cutting corporate tax rate from 35% to 21%, effective in 2018. Trump said that's "probably the biggest factor in this plan" and "we've become competitive all over the world". Treasury Secretary Steven Mnuchin said Trump will "sign it as quickly as he can". But there are still some logistics to work on. The signing could be delayed to January 3.
Treasury yields continue powerful rally
US 10 year yield extended recent rally and took out 2.475 resistance decisively, closing at 2.497, up 0.034. There are a couple factors driving up global bond yields towards the year end. Tax cuts in the US are expected to result in increased bond selling in 2018. Meanwhile, Fed's unwinding of the balance sheet will also increased supply. On the other hand, Germany has already indicated to sell more 30 year bunds next year. ECB will also cut down its bond purchases.
TNX's rally firstly confirms rebound of the rebound from 2.034. And more importantly, it affirms that case that medium term correction from 2.621 has completed at 2.034. And up trend from 1.336 could be resuming. A break of 2.621 next year will pave the way to 61.8% projection of 1.336 to 2.621 from 2.034 at 2.827. Such development could be accompanied by USD/JPY breaking 2016 high at 118.65.
On the data front
New Zealand GDP grew 0.6% qoq in Q3, meeting expectation. UK Gfk consumer confidence dropped to -13 in December. Swiss trade balance and UK public sector borrowing are the main feature in European session. Canada CPI and retail sales will likely trigger some movements in Loonie later in the day. US will release Philly Fed survey, jobless claims, house price index, leading indicators and Q3 GDP final.
EUR/JPY Daily Outlook
Daily Pivots: (S1) 133.86; (P) 134.32; (R1) 135.04; More....
EUR/JPY surges to as high as 134.76 so far. Break of 134.39 resistance indicates resumption of medium term up trend. Intraday bias is now on the upside. Rally from 132.04 should target 61.8% projection of 114.84 to 134.39 from 132.04 at 144.12. Ideally, upside acceleration should be seen in the current move with daily MACD taking out down trend line. On the downside, below 133.91 minor support will turn intraday bias neutral first. But outlook will stay bullish as long as 132.04 key support holds.
In the bigger picture, medium term rise from 109.03 (2016 low) is seen as at the same degree as the down trend from 149.76 (2014 high) to 109.03 (2016 low). Sustained break of 61.8% retracement of 149.76 to 109.03 at 134.20 will pave the way to key long term resistance zone at 141.04/149.76. However, break of 132.04 support will suggest medium term topping and will turn outlook bearish for deeper fall back 55 week EMA (now at 127.82).
Economic Indicators Update
| GMT | Ccy | Events | Actual | Forecast | Previous | Revised |
|---|---|---|---|---|---|---|
| 21:45 | NZD | GDP Q/Q Q3 | 0.60% | 0.60% | 0.80% | 1.00% |
| 0:01 | GBP | GfK Consumer Confidence Dec | -13 | -12 | -12 | |
| 2:00 | JPY | BOJ Rate Decision | -0.10% | -0.10% | -0.10% | |
| 7:00 | CHF | Trade Balance Nov | 2.84B | 2.33B | ||
| 9:30 | GBP | Public Sector Net Borrowing Nov | 8.6B | 7.5B | ||
| 13:30 | USD | Philly Fed Manufacturing Index Dec | 20.8 | 22.7 | ||
| 13:30 | CAD | CPI M/M Nov | 0.20% | 0.10% | ||
| 13:30 | CAD | CPI Y/Y Nov | 2.00% | 1.40% | ||
| 13:30 | CAD | CPI Core - Common Y/Y Nov | 1.60% | |||
| 13:30 | CAD | CPI Core - Trim Y/Y Nov | 1.50% | |||
| 13:30 | CAD | CPI Core - Median Y/Y Nov | 1.70% | |||
| 13:30 | CAD | Retail Sales M/M Oct | 0.30% | 0.10% | ||
| 13:30 | CAD | Retail Sales Ex Auto M/M Oct | 0.40% | 0.30% | ||
| 13:30 | USD | Initial Jobless Claims (DEC 16) | 234K | 225K | ||
| 13:30 | USD | GDP Annualized Q/Q Q3 T | 3.30% | 3.30% | ||
| 13:30 | USD | GDP Price Index Q3 T | 2.10% | 2.10% | ||
| 14:00 | USD | House Price Index M/M Oct | 0.40% | 0.30% | ||
| 15:00 | USD | Leading Index Nov | 0.40% | 1.20% | ||
| 15:00 | EUR | Eurozone Consumer Confidence Dec A | 0.2 | 0.1 | ||
| 15:30 | USD | Natural Gas Storage | -69B |
Market Morning Briefing: Euro Reached A High Of 1.1902 Yesterday
STOCKS
Dow (24726.65, -0.11%) has decent resistance near 24900 and while that holds, the index could spend time within 24900-24700 region in a narrow sideways range. A possible dip to 24600 or lower looks likely before another up-leg in the medium term.
Dax (13069.17, -1.11%) saw a sharp fall from levels just above 13300, coming back to test 13000. Note that 13000 is an immediate support which if holds, could push the index back towards 13400 in the next few sessions. Else, failure to remain above 13000 could turn bearish taking the index to as low as 12800 again.
Nikkei (22792.94, -0.43%) continues to trade below 23000. Looking at the strongly bullish US-Japan 10YR yield spread (2.42%), Nikkei and Dollar Yen are likely to continue to move up in the near term. Nikkei if does not move up, would possibly prefer to remain stable below 23000. (Refer to Interest Rates & Forex sections below)
Shanghai (3281.36, -0.20%) has again faced some rejection from 3300 and is headed towards 3250 soon. As mentioned earlier, the 3320-3250 region is likely to hold for now. A break below 3250 could take it lower towards 3240 in the medium term. Near term does not look very positive.
Nifty (10444.20, -0.18%) and Sensex (33777.38, -0.18%) are likely to remain below 10500 and 34000 for some time either coming off towards 10300 and 33500 respectively or spending some time in a sideways consolidation.
COMMODITIES
Gold (1267.64) could be headed towards 1280 slowly and could come off from there back towards current levels. Trading within the downward channel currently, the price is likely to remain within 1280-1260 for some more time.
Silver (16.207) has been coming up from levels near 15.60. and could be headed towards 16.40-16.60 levels in the near term.
Brent (64.50) looks bullish towards 68 while the concern is whether WTI (58.07) would be able to break above 59 or not. Looking at the close relation between the two, chances of directional divergence seems very unlikely. Either of the two may impact the other to follow the same direction but whether it would be bullish or bearish is a doubt just now. A break above 59 on WTI or a fall from there would be the driver for further movement in the crude prices.
Copper (3.1960) is clearly trading above immediate resistances and looks bullish for the near term. While above 3.15, the price is likely to test levels near 3.30% or higher in the medium to long term.
FOREX
Dollar-Index (93.355) saw a low of 93.16 yesterday, but is currently trading around 93.35, slowly approaching 93 (shown as support on daily & 3 day candles). Likelihood of the index staying in the 93.0-93.5 range during the holiday season is high, while a break of 93 could take it towards 92.5, acting as support on weekly line charts.
Euro (1.1874) reached a high of 1.1902 yesterday, thereby testing the crucial resistance near 1.19 earlier than we had expected. It is currently trading below resistance near 1.1875, and much like the Dollar Index, could see levels being maintained near 1.185-1.190 in this holiday season. A decisive move (be it a move past resistance at 1.19 or a break of support at 1.17, should happen in January).
Dollar-Yen (113.43) is close to testing resistance at 113.5 on the daily candles and with a further possible rise in US-Japan 10 yr spread from the current 2.42 to 2.5 (See Interest Rates below), it could move past 113.5 to test resistance at 114 on the 3 day and weekly candles, post which a corrective dip is likely.
Pound (1.3367) moved within a narrow range yesterday (1.3372-1.3420) and little intra-day movement could now be expected, given the beginning of the holiday season. There might be some support near 1.335 on the daily candles which might restrict the possible range of oscillation to 1.335-1.345,
Rupee (64.115) could be expected to stay above 64 for a couple of sessions as the Nifty’s rejection continues to levels near 10300-10400, post which a bounce in the Nifty to 10500-10550 could see simultaneous testing of 63.90 by Rupee next week.
INTEREST RATES
The rise in the US yields continues as the US passed the tax bill yesterday. Sharp rise in the 5YR (2.23%), 10YR (2.49%) and the 30YR (2.87%) from previous levels of 2.21%, 2.45% and 2.81/% respectively. The 10YR could face some resistance near 2.50% but we would have to see if that holds or is broken on the upside in the next few sessions. The 30YR is likely to target levels of 3.00% in the sessions to come.
The Japan yields have also risen sharply in the last couple of sessions. The 10Yr (0.07%) is up from 0.042% seen on Tuesday, while the 30YR (0.819%) is up from 0.80%. The yields look bullish for the near term.
Bullishness in both the Japan and the US yields have together raised the US-Japan 10YR yield spread (2.42%) and while above 2.37%, the yield spread could target levels near 2.50% in the coming sessions. This should pull up Nikkei and Dollar Yen to higher levels in the near term.
We Have A Decision To Make In EUR/AUD
The thing is, we now have a decision to make! First of all, let's take a look at a zoomed out view of the EUR/AUD daily chart:
EUR/AUD Daily 1:
As you can see, I've marked previous higher time frame, swing high resistance that has held… for now.
This is where your trading discretion comes in and you have a question to answer. Does the fact that this resistance level has held, trump the fact that for the entire year of 2017, EUR/AUD has been on a bullish tear? Do you put your weight in the trend, or in the higher time frame level? In an ideal trading setup, both of these would line up, but not here.
So let's now zoom in and take a look at what price is doing now that the swing high resistance level has held:
EUR/AUD Daily 2:
Yes it's held, but only to the most recent price stall. If this previous short term resistance level can hold as support, it's an excellent level to look to buy the pair off and manage your risk around.
For me at the moment, momentum and the trend wins out over the previous swing high resistance level holding. It's a buy until it's not.
China Goes Easy On Debt
They say never bet against the Fed. The institution, which for the last 8 years, has overestimated GDP growth and more importantly, predicted more rate hikes over the last 3 years than it ended up delivering, to the chagrin of USD bulls. But what about China? Those who bet against it since the 2015 market correction, have paid a heavy price. State and provincial debt continues to grow, but its currency has firmed and its capital markets have held up. So what to make of this week's announcement of economic blueprint in Beijing?
Turning on the Taps?
China's Central Economic Work Conference takes place this week, unveiling what could be a critical set of announcements for global risk appetite, indices and world growth. After embarking on a multi-year effort to curb debt, China is no longer expected to focus on reign in borrowing. A WSJ report indicated that Beijing will instead try to slow the pace of debt growth rather than cut leverage.
With debt reduction no longer a key focus and inflation low, China may once again attempt to boost growth, especially private growth. Could China's stock markets see a further resurgence next year, and spill over into commodities and broader emerging markets?
Outperforming before MSCI inclusion
China's growing significance among portfolio managers' stock pickings was manifested over the summer by Morgan Stanley's announcement to include over 200 Chinese stocks in its MSCI Emerging Market Index starting May and August of next year. MS decision to include U.S.-listed Chinese American Depositary Receipts (ADRs) has pushed China's share allocation in its EM index to 26.5%, and will further increase to 32% once the +200 mainland shares are included.
Intermarket Implications
Whether the “buy China + EM” move has already happened and any joiners on the move may be too late is serious question to consider. Most EM equity indices are up +20% this year, while the US-based ETF of Chinese shares is up 50%.
The charts below highlight the strong positive correlation between the US dollar index (57% of which is tied to EURUSD) and the USD/CNY exchange rate. With USDX consistently failing to regain 94.00 (right shoulder resistance), USD/CNY unable to break above 6.70 (55-WMA) and commodities holding above 177, the path of least resistance for this intermarket dynamic remains supportive of metals in particular and commodities in general. And for the latest look on gold's post-Fed move, here our latest video.
Winter Comes For Bond Bears
December 21 is the first day of winter in the northern hemisphere but cold season could last much longer in the bond market if the latest moves are an indication. The euro was the top performer Wednesday while the yen lagged. Kuroda speaks later.
All the talk this week has been about the US tax bill and stock markets but the bond market is quietly wilting. German 10-year bund yields are up 10 bps to 0.40% in the past two days and US 10-year Treasuries are trading just below 2.50% -- the highest since March.
Part of the rise is supply – the US tax plan will mean more bond issuance. If it results in more growth it will also mean higher interest rates and better global growth. Ultimately, inflation will result and if it climbs up to 2-3% then it's going to be a painful year ahead.
Wednesday's trading could be a preview of what's ahead. The yen quietly slid across the board with EUR/JPY gaining more than 100 pips.
Japanese bonds are pinned to the floor because of the BOJ's yield curve control program. Despite improved prospects for growth, there are no signs of any change in course.
Even at these levels, USD/JPY is lower than it should be. If 10-year yields can get to 3% then the pair will almost surely rise above 120 and potentially significantly higher.
Of course, that all depends on what happens next in bonds. Congress passed the tax cut bill on Wednesday and Trump will sign it in the week ahead. The main risk now is 'selling the fact' or flows related to year end and the new year.
But first, BOJ Governor Kuroda speaks in a press conference at 0630 GMT.