
Sample Category Title
Trade Idea : EUR/USD – Sell at 1.0730
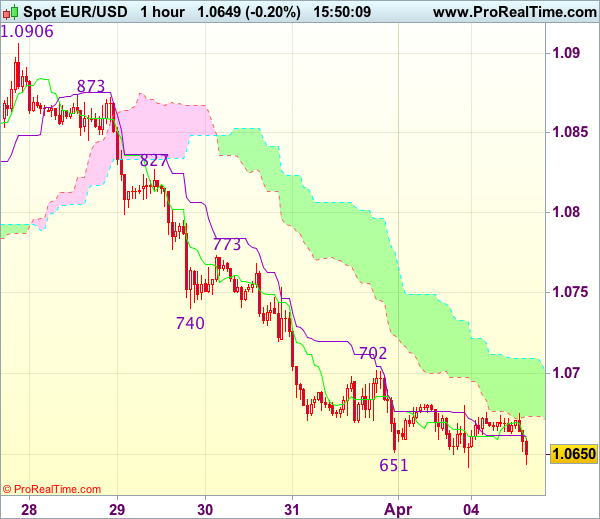
EUR/USD - 1.0654
Most recent candlesticks pattern : N/A
Trend : Near term down
Tenkan-Sen level : 1.0660
Kijun-Sen level : 1.0661
Ichimoku cloud top : 1.0710
Ichimoku cloud bottom : 1.0673
Original strategy :
Sell at 1.0740, Target: 1.0625, Stop: 1.0775
Position : -
Target : -
Stop : -
New strategy :
Sell at 1.0730, Target: 1.0610, Stop: 1.0765
Position : -
Target : -
Stop : -
As the single currency has remained under pressure after falling to 1.0642 yesterday, adding credence to our bearish view that the decline from 1.0906 top is still in progress and bearishness remains for this fall to extend further weakness to 1.0620-25, then test of previous chart support at 1.0600, however, a sustained breach below the latter level is needed to retain downside bias for subsequent selloff to 1.0570-75 first, otherwise, risk from there is seen for a rebound later.
In view of this, would not chase this fall here and would be prudent to sell dollar on recovery as 1.0730-40 should limit upside. Only a firm break above resistance at 1.0773 would suggest low is formed instead, bring a stronger rebound to 1.0800 but resistance at 1.0827 should remain intact.
Trade Idea : USD/JPY – Sell at 110.95
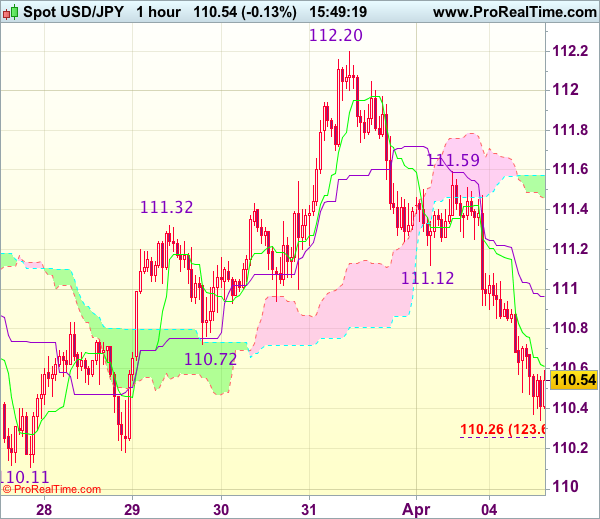
USD/JPY - 110.51
Most recent candlesticks pattern : N/A
Trend : Near term down
Tenkan-Sen level : 110.61
Kijun-Sen level : 110.97
Ichimoku cloud top : 111.57
Ichimoku cloud bottom : 111.46
New strategy :
Sell at 110.95, Target: 109.95, Stop: 111.30
Position : -
Target : -
Stop : -
As the greenback has dropped again after meeting renewed selling interest at 111.59 yesterday, adding credence to our view that top ha been formed at 112.20 and bearishness remains for the selloff from there to extend weakness to 110.11 support, however, break there is needed to retain downside bias and confirm medium term decline has resumed for further subsequent fall to 109.80-85 (1.618 times projection of 112.20-111.12 measuring from 111.59) which is likely to hold on first testing.
In view of this, would not chase this fall here and would be prudent to sell dollar on recovery as 110.90-95 should limit upside. Above previous support at 111.12 (now resistance) would defer but only break of resistance at 111.59 would abort and signal the fall from 112.20 has ended instead.
Flight-To-Safety Sends Safe Havens To Monthly Highs
The robust growth in manufacturing data across Europe, Asia, and the U.S. was not enough to refuel the reflation trade. Asian equities declined early Tuesday, sovereign bonds pushed higher, the USDJPY fell below 110.5, and gold prices approached 2017 highs.
The price action in different asset classes indicates that investors are favoring the safe havens ahead of a potentially tensed Trump-Xi summit. The U.S. Treasury yields reflect markets nervousness to a large extent because in this rising rates environment where economic conditions are improving, it doesn't make a lot of sense to see U.S. 10-year yields dropping back towards 2.32%, an 11.6% decline from March highs. If the drop in yields is not temporary, it would spark a market correction, so traders should keep a close eye on U.S. sovereign debt.
Crude oil prices are not supporting appetite to risk either. The continued increase in U.S. rig counts and the rebound in Libyan output kept prices under pressure. "Oversupply", the most offensive term for OPEC, doesn't seem to have faded yet, which requires OPEC and non-OPEC producers to take extending production cuts into serious consideration, otherwise balancing the markets will take much longer than previously anticipated.
The Reserve Bank of Australia kept its cash rate at 1.5% for the eighth consecutive month, a widelyexpected decision. But the AUDUSD declined by 30 pips, as the RBA highlighted that a soft labor data remains an area of concern and an appreciating Aussie would complicate the economy's transition away from mining. The Central Bank also warned on risky lending to house buyers which drove prices in the main cities to double-digit gains, suggesting that regulators will take the proper measures to curb risky mortgage lending to cool down escalating home prices.
In other currency news, the South African rand resumed its fall after S&P cut the country's rating into junk. ZAR fell 1.7% early Tuesday after dropping 2% on Monday. The elevated political risks after firing the finance minister will continue to be reflected in the country's currency. From a fundamental perspective, the rand looks undervalued, but how much lower it might drop in the short run depends on the political developments. A 5-10% fall from current levels is very likely.
Foreign Exchange Market Commentary: EUR/USD, USD/JPY, GBP/USD, GOLD, WTI CRUDE, DJIA, FTSE 100, DAX
EUR/USD
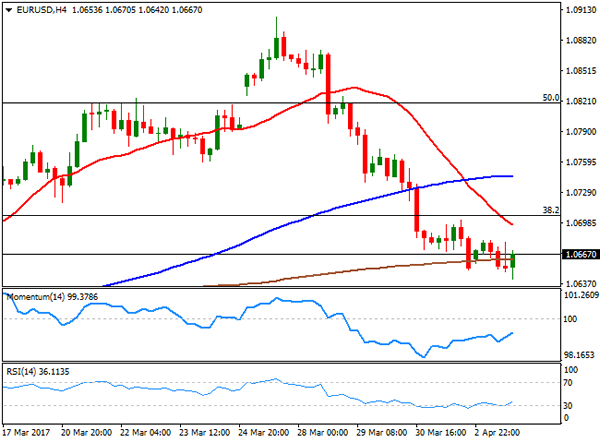
The EUR/USD pair traded with a soft tone this Monday, having extending its latest decline to a fresh 3-week low of 1.0642 during US trading hours, and bouncing modestly from the level afterwards, to end the day around 1.0660. The macroeconomic calendar was quite busy, but was not enough to attract speculative interest around the pair. In the EU, the seasonally adjusted unemployment rate fell to 9.5% in February from 9.6% in January, and the lowest since May 2009, while the final Markit manufacturing PMIs for March, confirmed the region grew at its fastest pace in nearly six years as the final revision of the index matched the preliminary estimate of 56.2. On a negative note, the EU PPI for February came in flat, after advancing 1.1% in February, while the year-on-year price index grew by 4.5%, above estimates of 4.4.
The US manufacturing sector's growth was also confirmed at record during March, although the final Markit PMI came in slightly lower, at 53.3 from the flash estimate of 53.4, while the ISM index beat expectations by printing 57.2, down from January's 57.7, but still showing the overall economy grew for the 94th consecutive month. What actually weighed on the common currency, were comments from ECB Praet, who said that April's reduction of assets purchases doesn't signal the start of gradual reduction of QE.
The dollar suffered a setback mid American afternoon, as stocks plunged, prompting the pairs' recovery, although the overall risk remains towards the downside, given that the pair posted a lower low and a lower high daily basis, while trading below the critical 1.0700 threshold. In the 4 hours chart, a strongly bearish 20 SMA has crossed below the 100 SMA, both well above the current level, whilst technical indicators have managed to recover partially from their mid-lines, but remain within bearish territory, far from supporting additional gains. In fact, the pair needs to surpass the 1.0710 region to be able to recover further, whilst below 1.0620 the bearish momentum will likely accelerate with 1.0565 as the main bearish target.
Support levels: 1.0620 1.0590 1.0565
Resistance levels: 1.0710 1.0745 1.0780
USD/JPY
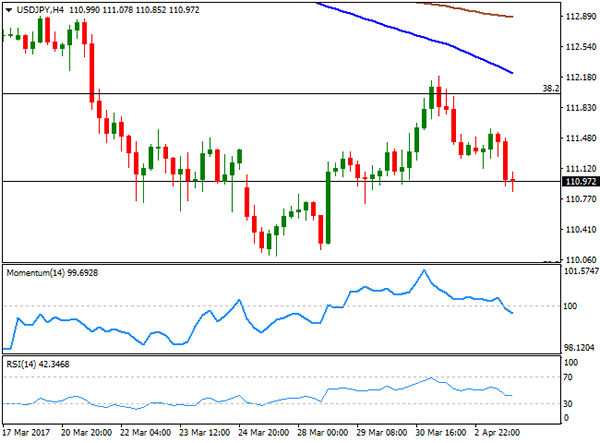
The USD/JPY pair sunk to 110.85 and settled a few pips above the level, undermined by plummeting US stocks and Treasury yields. The 10-year note benchmark fell down to 2.34%, its lowest in over a month, whist the 2-year note fell to 1.22%, as mixed US manufacturing indexes dented latest confidence in the US and fueled demand for bonds. The pair traded as high as 112.19, but was unable to settle above the 112.00 level, and quickly retreated, which left the dominant bearish trend firm in place. As for the intraday technical outlook, the 4 hour chart shows that the 100 and 200 SMAs gained bearish momentum above the current level, with the shortest detaching from the largest and currently around 112.20, whilst technical indicators continued pulling back from overbought readings and entered negative territory, now partially decelerating their declines, but still far from changing bias. The pair seems poised to retest its recent lows around 110.10, with a major Fibonacci support being at 109.90, the 50% retracement of the late 2016 monthly advance. The level should attract buyers if reached, but a break below it could see the pair entering in sell-off mode, and aim towards 108.50, mid November lows.
Support levels: 110.95 110.50 110.10
Resistance levels: 111.60 112.00 112.50
GBP/USD
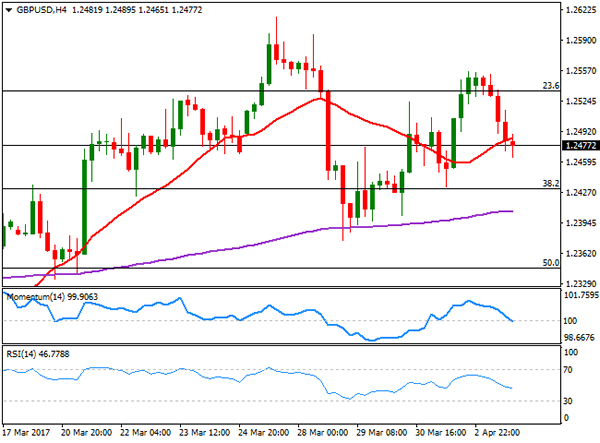
The GBP/USD pair reversed all of its Friday's gains to settle at 1.2477, undermined by a poor UK Markit Manufacturing PMI released early Europe. The index declined to 54.2 in March from 54.6 in February, below expectations of 55.1 and the lowest reading in four months. US data, on the other hand, confirmed that the world's largest economy continued growing at a steady pace by the end of the first quarter of the year. The daily decline, following failure to regain the 1.2600 level last week, has increased the risk of a new leg lower. The 4 hours chart supports additional declines, as the price is currently developing below its 20 SMA, whilst the Momentum indicator is crossing below the 100 level, and the RSI heading south around 46. Still the pair has a major support around 1.2430, which stands for the 38.2% retracement of the January rally. A break below this last should expose March 29th low of 1.2375, en route to 1.2330 a strong static support. The upside should remain capped by selling interest around 1.2540/60 for the bearish trend to remain in place.
Support levels: 1.2465 1.2430 1.2380
Resistance levels: 1.2510 1.2550 1.2590
GOLD
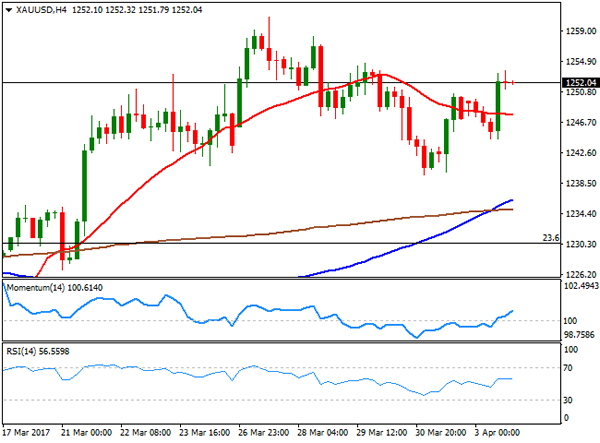
Spot gold jumped in the US afternoon to $1,253.63 a troy ounce to settle around 1,252.00, backed by falling equities and bond yields, which prompted investors towards safe-haven assets. The commodity started the day with a soft tone, as the greenback started the week with a firmer pace, but the release of mixed US data weighed on equities, indicating that confidence in the US economic future is quite fragile. Technically, the daily chart for the index shows that it bounced strongly after testing its 200 DMA, currently at 1,244.45, while the 20 DMA gained further upward strength below the largest. In the same chart, the Momentum indicator has turned flat well above its 100 level, while the RSI indicator aims north around 61, all of which favors additional advances towards 1,263.80, this year high. In the 4 hours chart, the price settled above all of its moving averages, with the 100 SMA advancing above the 200 SMA and with technical indicators holding in positive territory, with the Momentum still heading north, but the RSI flat around 56, this last amid decreasing volumes at the end of the day.
Support levels: 1.243.60 0 1,230.00 1,222.70
Resistance levels: 1,253.65 1,263.80 1,272.80
WTI CRUDE
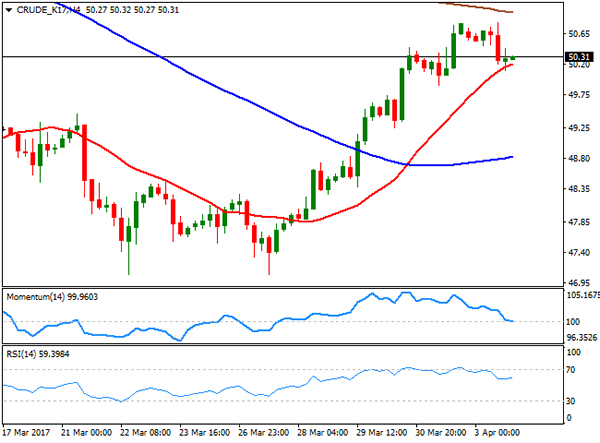
Crude oil prices retreated on Monday, with West Texas Intermediate futures ending the day at $50.30 a barrel, ending a four-day winning streak. The commodity was affected by news indicating that oil production resumed in Libya after the latest disruption, although the decline was limited, as investors remain optimism on an extension of the OPEC output cut deal. Technically, the daily chart shows that the commodity held within its Friday's range, and above its 20 and 200 DMAs, whilst technical indicators have lost upward momentum, but hold within positive territory. In the 4 hours chart, the intraday decline was contained by a bullish 20 SMA, although the Momentum indicator retreated towards its 100 level, while the RSI indicator also retreated, but turned flat around 59, indicating a limited bearish scope as long as the index holds above the psychological 50.00 level.
Support levels: 49.90 49.50 49.00
Resistance levels: 50.60 51.25 51.90
DJIA
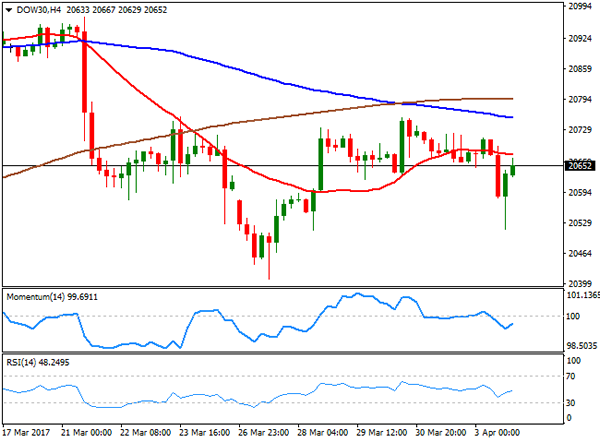
Wall Street closed marginally lower, reversing and early sharp decline. The Dow Jones Industrial Average shed 13 points and closed at 20,650.21 after trading as low as 20,515, while the Nasdaq Composite settled at 5,894.68, down 0.29% or 17 points. The S&P lost 0.16%, to 2,358.84. Leading the decline was the auto manufacturers sector, after reporting worse-than-expected sales for March, while weaker oil prices also weighed. El du Pont was the worst performer, down 0.66%, while American Express followed, ending the day 0.58% lower. UnitedHealth Group led advancers by adding 1.03%. From a technical point of view, the index has made little progress, as in the daily chart, it remained below a modestly bearish 20D DMA, while technical indicators keep consolidating below their mid-lines. In the 4 hours chart, the index settled below all of its moving averages, whilst technical indicators have recovered within bearish territory, limiting chances of a steeper decline. Below the mentioned daily low, however, the selling interest will likely accelerate, with the index then poised to challenge past week low of 20,409.
Support levels: 20,623 20,562 20,515
Resistance levels: 20,717 20,757 20,806
FTSE 100
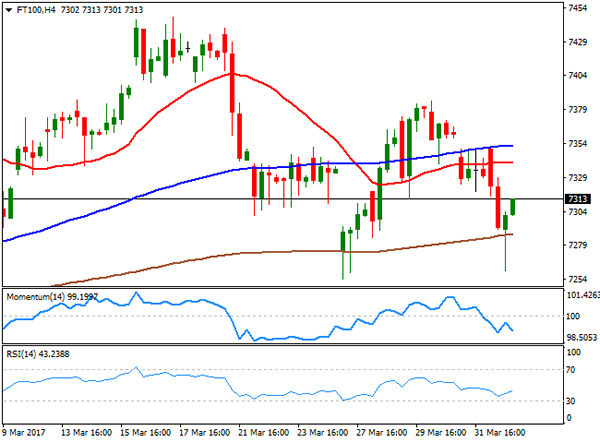
London equities edged lower at the beginning of the week, with the FTSE 100 ending the day at 7,289.69, down by 40 points, as softer-than-expected growth in the manufacturing sector weighed on the benchmark. Only 16 components closed with gains, with Provident Financial being the best performer, up 1.57%, followed by Mondi which added 1.45%. Randgold Resources made it to the top ten list by adding 1.01%. Next led decliners, shedding 3.56&, while ITV followed, ending the day 2.56% lower. The daily chart for the index presents an increasingly bearish potential, as it held below a flat 20 DMA, while technical indicators have entered negative territory, with modest downward strength. In the shorter term, and according to the 4 hours chart, the risk is also towards the downside, as the index extended its decline further below its 20 and 100 SMAs that anyway remain flat, while the Momentum indicator resumed its decline within negative territory, whilst the RSI hovers around 42.
Support levels: 7,289 7,254 7,210
Resistance levels: 7,349 7,387 7,415
DAX
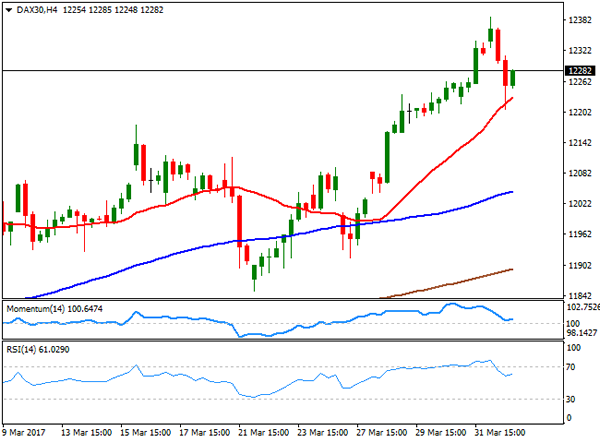
The German DAX retreated from multi-year highs and settled at 12,257.20, down 55 points this Monday, with European indexes weighed by the poor performance of banking and automotive companies. Deutsche Bank and Commerzbank led declines, losing 2.65% and 1.18% respectively, whilst Daimler was also among the worst performers, shedding 0.3%. Deutsche Boerse led advancers, adding 1.30%. The index advanced intraday up to 12,387, flirting with record highs before turning into the red, and technical readings in the daily chart show that the index is still far above a bullish 20 SMA, whilst the Momentum indicator remains flat above its 100 level, and the RSI indicator barely retreated from overbought readings, maintaining the downward risk limited. In the 4 hours chart, the index bounced after testing a bullish 20 SMA, whilst technical indicators also recovered from their mid-lines, after correcting extreme overbought readings reached at the beginning of the day, also limiting chances of a downward move, as long as the index holds above the daily low of 12,206.
Support levels: 12,248 12,206 12,167
Resistance levels: 12,298 12,341 12,399
GBP/JPY Daily Outlook
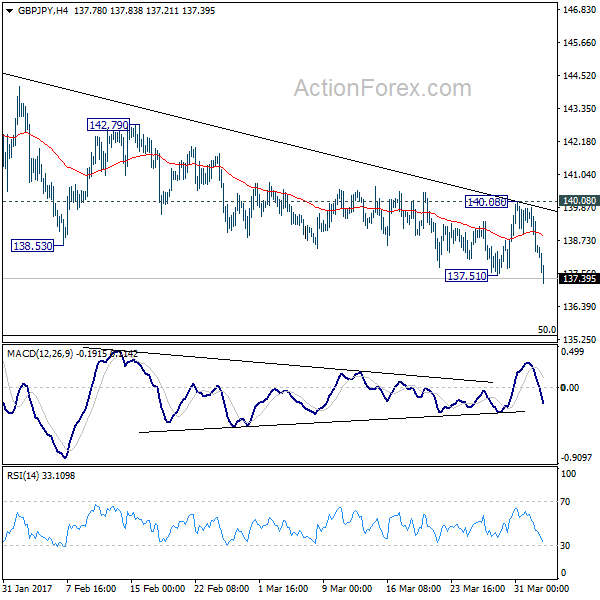
Daily Pivots: (S1) 137.87; (P) 138.88; (R1) 139.47; More...
GBP/JPY's recovery failed below 140.60 resistance and drops sharply since then. Break of 137.51 now resumes the choppy decline from 144.77. Intraday bias is back on the downside for medium term fibonacci level at 135.39. We'd look for bottoming around there. But now, break of 140.08 resistance is needed to indicate short term reversal. Otherwise, outlook will remain bearish in case of recovery.
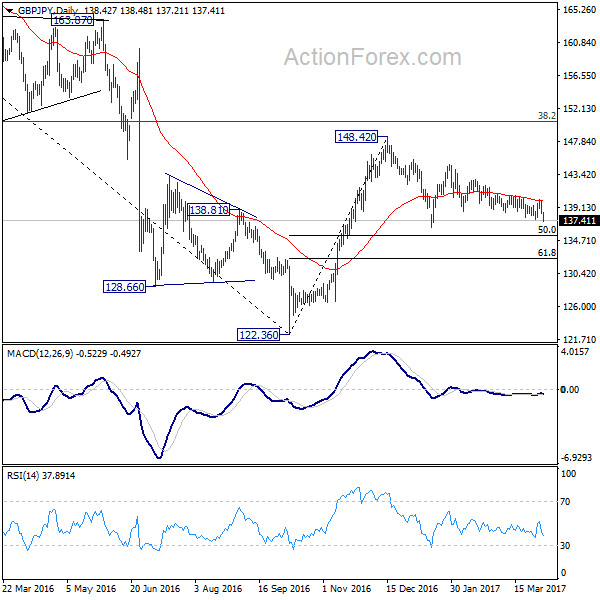
In the bigger picture, price actions from 122.36 medium term bottom are still seen as a corrective pattern. Main focus is on 38.2% retracement of 195.86 to 122.36 at 150.42. Rejection from there will turn the cross into medium term sideway pattern. Or, sustained break of 50% retracement of 122.36 to 148.42 at 135.39 will turn outlook bearish for a test on 122.36 low. Though, sustained break of 150.42 will extend the rebound towards 61.8% retracement of 195.86 to 122.36 at 167.78.
Market Update – Asian Session: RBA On Hold With A More Dovish Statement Amid Softer Employment And Wage Growth
US Session Highlights
Major equity indices retraced slightly with little news from Washington, as the Trump administration's Supreme Court nomination is headed for a filibuster fight and investors continue to wait for the economic policy promises that began the last stock rally. There were some positive economic data releases, but not enough to put more wind into the sails. NYSE volume 3% below 3-month average.
GM Reports Mar US sales +1.6% y/y, to 256.2K units v 276.3Ke; Mar industry SAAR at 17M (v 17.2Me)
(US) MAR MARKIT FINAL MANUFACTURING PMI: 53.3 V 53.5E (lowest since August)
(US) MAR CHICAGO PURCHASING MANAGER: 57.7 V 56.9E
(US) MAR ISM MANUFACTURING: 57.2 V 57.2E; PRICES PAID: 70.5 V 66.0E (prices paid highest since May 2011); Employment: 58.9 v 54.2 prior (highest since June 2011)
US markets on close: Dow -0.1%, S&P500 -0.2%, Nasdaq -0.3%
Best Sector in S&P500: Telecommunication
Worst Sector in S&P500: Consumer Discretionary
Biggest gainers: INCY +3.6%; NEM +2.8%; CI +2.0%; GGP +1.8%; HUM +1.8%
Biggest losers: KMX -4.3%; FTR -4.2%; ORLY -4.1%; RHI -4.0%; BWA -3.5%
At the close: VIX 12.41 (+0.04pts); Treasuries: 2-yr 1.25% (-2bps), 10-yr 2.35% (-5bps), 30-yr 2.99% (-3bps)
US movers afterhours
PRTK: Announces positive Phase 3 study of omadacycline in community-acquired bacterial pneumonia; +29.6% afterhours
SHIP: Reports Q4 -$0.29 v -$0.31 y/y, R$10.9M v $6.8M y/y; Fleet utilization 82.6% v 73.0% y/y; +23.7% afterhours
EDAP: Reports Q4 -$0.05 v -$0.01e, R$11.4M v $10.1Me; +4.1% afterhours
KATE: Reportedly wants a few more weeks of time to negotiate following receipt of bid from Coach last week; Michael Kors said to still be interested in Kate Spade; -5.9% afterhours
Key economic data
(JP) Bank of Japan (BOJ) Q1 TANKAN 12-month Inflation Expectation Survey for Japan companies: 0.7% v 0.7% prior
(AU) RESERVE BANK OF AUSTRALIA (RBA) LEAVES CASH RATE TARGET UNCHANGED AT 1.50% (AS EXPECTED)
(AU) AUSTRALIA FEB TRADE BALANCE (A$): 3.6B V 1.9BE (4TH CONSECUTIVE SURPLUS)
(AU) Australia ANZ Roy Morgan Weekly Consumer Confidence Index: 111.1 v 113.8 prior
(NZ) NEW ZEALAND Q1 NZIER BUSINESS CONFIDENCE: 17 V 28 PRIOR (1-yr low); ADJ 16 V 26 PRIOR
(KR) SOUTH KOREA MAR CPI M/M: 0.0% V 0.0%E; Y/Y: 2.2% V 2.1%E; CORE CPI Y/Y: 1.4% V 1.5%
(KR) SOUTH KOREA Q1 FOREIGN DIRECT INVESTMENT (FDI) Y/Y: -9.2% V -18.2% PRIOR
Asia Session Notable Observations, Speakers and Press
Asian equity markets are tracking the declines on Wall St, where cash markets were down for the 2nd straight day. Soft auto sales in March and a slight miss on the US manufacturing PMI were attributed to the selloff, while political risk remained in focus with reports that Democrats in the Senate have the numbers to stonewall Supreme Court nominee Gorsuch with a filibuster. Materials, Financials, and Consumer Discretionary sectors led the selling, while Telecom fared well. US Treasuries were bid for the 2nd straight session, with the 10-year around 1-week lows of 2.35%. Gold prices were also higher on safehaven demand.
Nikkei225 is among the worst performers in Asia, though trading remained light as markets in mainland China and Hong Kong were closed for holiday. Headwinds in Japan tracked the rally in USD/JPY, as it fell below 110.50 for the first time in a week. AUD/USD and NZD/USD saw more pronounced selling late in the session with the release of a more dovish statement accompanying RBA decision to keep rates at 1.5%.
Employment had been fairly resilient in Australia in the 2nd half of last year, but the latest reading saw jobless rate rise to a 13-month high and net change was negative for the first time in 5 months. RBA acknowledged the softening in its statement, and also added that wage growth remains slow. Another notable change in the statement was addressed at the property market, as RBA recommended that "lenders ensure the "serviceability metrics that they use are appropriate for current conditions" while also urging reduced reliance on interest-only housing loans. RBA is clearly wary of risks of accelerating housing correction given that some of the lenders have started to tighten mortgage rates and target speculative buying. Ahead of the decision, Australia Trade Balance topped expectations, with Exports rising 1.5% and Imports sliding over 5% on the month.
China
(CN) CICC sees China Q1 GDP rising to 6.9% from 6.8% in Q4 - Shanghai Daily
Japan
Japan Ministry of Economy, Trade and Industry (METI): To increase LNG investment in emerging countries
(JP) BOJ Gov Kuroda: BOJ ETF purchase to cut risk premium; reiterates too early to discuss an ex; Too early to talk about exit strategy
Korea
(KR) South Korea acting President Hwang: There is a high chance of North Korea provocation
Asian Equity Indices/Futures (00:00ET)
Nikkei -0.6%, Hang Seng closed, Shanghai Composite closed, ASX200 -0.3%, Kospi -0.1%
Equity Futures: S&P500 -0.2%; Nasdaq -0.1%, Dax -0.1%, FTSE100 -0.1%
FX ranges/Commodities/Fixed Income (00:00ET)
EUR 1.0660-75; JPY 110.45-95; AUD 0.7588-0.7614; NZD 0.6990-0.7020
Apr Gold +0.3% at 1,258/oz; May Crude Oil +0.1% at $50.29/brl; May Copper -0.2% at $2.60/lb
(KR) South Korea MoF sells 30-yr Treasury Bonds; avg yield 2.325
JGB (JP) Japan MoF sells ¥2.08T v ¥2.3T offered in 10-year 0.1% JGBs; Avg yield: 0.064% v 0.082% prior; bid to cover: 3.96x v 3.74x prior
Asia equities notable movers
Australia
NWS.AU News Corp. -2.5% (sued for sexual harassment)
CDV.AU Cardinal Resources +7.6% (acquisition)
BAL.AU Bellamys +5.9% (Janchor Partner adds stake)
NUF.AU Nufarm -1.7% (Credit Suisse downgrades)
VLA.AU Viralytics -9.5% (interim clinical result)
RMS.AU Ramelius Resources +6.7% (exploration update)
RSG.AU Resolute Mining +5.6% (guidance)
WHC.AU Whitehaven Coal +7.9% (coking coal prices may spike)
Japan
3333.JP Asahi Co Ltd +6.4% (results)
8227.JP Shimamura +3.6% (results)
3632.JP Gree Inc -1.7% (Jefferies cuts rating)
2809.JP Kewpie Corp. -8.0% (Q1 result)
6146.JP Disco Corp +1.1% (Q4 result)
6113.JP Amada +1.9% (JPMorgan upgrades)
3148.JP Create SD Holdings -4.9% (9-month result)
5423.JP Tokyo Steel Mfg +1.9% (Mitsubishi upgrades)
6502.JP Toshiba Corporation -8.9% (may seek 3rd extension to earnings)
South Korea
005930.KR Samsung Electronics +1.2% (Apple said to order OLED panels)
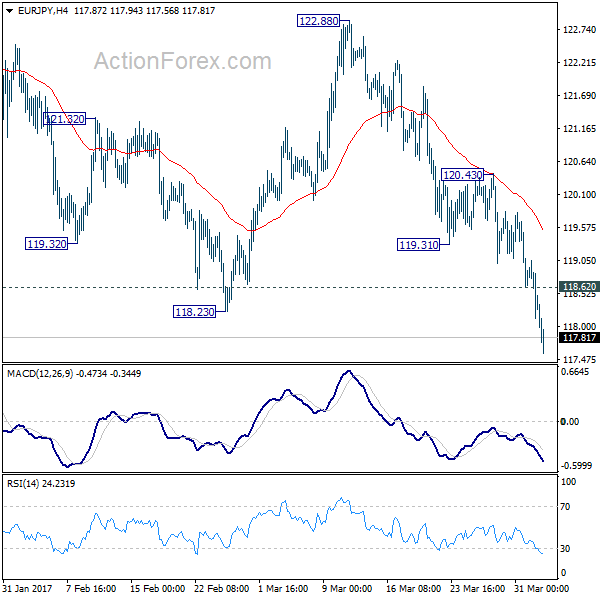
EUR/JPY Daily Outlook
Daily Pivots: (S1) 117.96; (P) 118.50; (R1) 118.88; More...
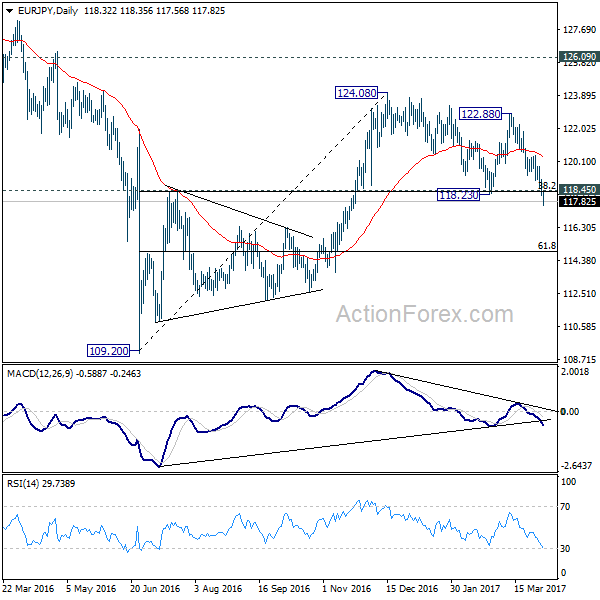
EUR/JPY's decline accelerates to as low as 117.56 and took out 118.39/45 cluster support zone decisively. The development now argues that rise from 109.20 is completed. Intraday bias stays on the downside for 61.8% retracement of 109.20 to 124.08 at 114.88 next. On the upside, above 118.62 minor resistance will turn bias neutral and bring recovery. But upside should be limited by 120.43 resistance and bring another fall.
In the bigger picture, the firm break of 38.2% retracement of 109.20 to 124.08 at 118.39 indicates that medium term rise from 109.20 is completed at 124.08. That's well below 126.09 key support turned resistance. Also, EUR/JPY failed to sustain above 55 week EMA. Deeper decline would now be seen back to 109.20 low. Overall, the down trend from 149.76 (2014 high) is not completed yet. Break of 109.20 will resume such down trend towards 94.11 low. In any case, break of 126.09 is needed needed to confirm medium term reversal.
RBA Stands Pat On Interest Rate
For the 24 hours to 23:00 GMT, the AUD declined 0.16% against the USD and closed at 0.7602.
LME Copper prices declined 0.6% or $32.0/MT to $5817.0/MT. Aluminium prices rose 0.1% or $2.0/MT to $1948.5/MT.
In the Asian session, at GMT0300, the pair is trading at 0.7603, with the AUD trading a tad higher against the USD from yesterday's close.
Earlier in the session, the Reserve Bank of Australia (RBA), in its latest monetary policy meeting, held the key interest rate steady at 1.50%, as widely expected.
In economic news, Australia's seasonally adjusted trade surplus widened more-than-expected to a level of A$3547.0 million in February, boosted by elevated iron ore prices and a sharp fall in imports of consumer goods. Markets anticipated the nation to record a surplus of A$1900.0 million, following a revised surplus of A$1503.0 million in the prior month.
The pair is expected to find support at 0.7584, and a fall through could take it to the next support level of 0.7565. The pair is expected to find its first resistance at 0.7623, and a rise through could take it to the next resistance level of 0.7643.
Looking ahead, investors will direct their attention to Australia's AiG performance of services index for March, due to release in the early hours' tomorrow.
The currency pair is showing convergence with its 20 Hr moving average and trading below its 50 Hr moving average.

Euro-Zone’s Unemployment Rate Dips To Its Lowest Level Since May 2009 In February
For the 24 hours to 23:00 GMT, the EUR declined 0.09% against the USD and closed at 1.0666.
On the macro front, the Euro-zone's unemployment rate fell to 9.5% in February, meeting market expectations and hitting its lowest level in nearly eight years, thus chiming with other signs that the common currency region is regaining momentum. The region's unemployment rate had registered a reading of 9.6% in the previous month. Additionally, the region's manufacturing sector growth was confirmed at a nearly seven-year high level of 56.2 in March, meeting market expectations. In the prior month, the PMI had recorded a level of 55.4.
Elsewhere, Germany's final Markit manufacturing PMI rose to a level of 58.3 in March, confirming the preliminary figures and following a reading of 56.8 in the previous month.
In the US, the ISM manufacturing PMI eased to a level of 57.2 in March, meeting market expectations and falling from a more than two-year high level of 57.7 registered in the preceding month, suggesting that growth in the nation's manufacturing sector is losing some steam. Also, the nation's Markit manufacturing PMI was unexpectedly revised lower to a level of 53.3 in March, from a reading of 53.4 recorded in the preliminary print. The PMI had registered a reading of 54.2 in the previous month, whereas markets expected for a fall to a level of 53.5.
In contrast, the nation's construction spending rebounded 0.8% MoM in February, surging to its highest level in nearly eleven years, amid robust gains in home building investment. Construction spending had recorded a revised drop of 0.4% in the prior month.
In the Asian session, at GMT0300, the pair is trading at 1.0663, with the EUR trading marginally lower against the USD from yesterday's close.
The pair is expected to find support at 1.0642, and a fall through could take it to the next support level of 1.0622. The pair is expected to find its first resistance at 1.0682, and a rise through could take it to the next resistance level of 1.0702.
Moving ahead, investors will look forward to the Euro-zone's retail sales data for February and a speech by the ECB President, Mario Draghi, due in a few hours. Moreover, in the US, trade balance figures, factory orders and final durable goods orders, all for February, scheduled to release later in the day, will keep investors on their toes.
The currency pair is showing convergence with its 20 Hr and 50 Hr moving averages.

Britain’s Manufacturing Sector Growth Unexpectedly Slowed In March
For the 24 hours to 23:00 GMT, the GBP declined 0.37% against the USD and closed at 1.2484, after data revealed that UK's manufacturing sector activity unexpectedly cooled for a third consecutive month in March.
UK's Markit manufacturing PMI surprisingly eased to a level of 54.2 in March, compared to market consensus for an advance to a level of 55.0 and dropping for a third straight month, thus highlighting that the nation's manufacturing sector ended the first quarter on a weaker footing. In the prior month, the PMI had recorded a revised reading of 54.5.
In the Asian session, at GMT0300, the pair is trading at 1.2490, with the GBP trading slightly higher against the USD from yesterday's close.
The pair is expected to find support at 1.2451, and a fall through could take it to the next support level of 1.2412. The pair is expected to find its first resistance at 1.2541, and a rise through could take it to the next resistance level of 1.2592.
Looking ahead, investors await the release of UK's Markit construction PMI for March, due in a few hours.
The currency pair is showing convergence with its 20 Hr moving average and trading below its 50 Hr moving average.
