Sample Category Title
Gold Falls from Highs
The price of gold fell to $2370.00 per troy ounce by Thursday following the release of the minutes from the latest US Federal Reserve meeting. The general tone of the Fed's policymakers was notably cautious, aligning with previous calls for a restrained approach to monetary policy.
The Fed indicated that more time is needed to be confident that US inflation is declining towards the 2% target. This cautious sentiment has tempered market expectations of imminent interest rate cuts. Previously, the market anticipated two rate cuts (in September and December); now, it expects no more than one. Consequently, the US interest rate is likely to remain at 5.5% per annum for an extended period before the Fed considers revising it.
Higher interest rates reduce the attractiveness of gold, which does not yield interest. This dynamic has contributed to the recent decline in gold prices.
Technical analysis of XAU/USD
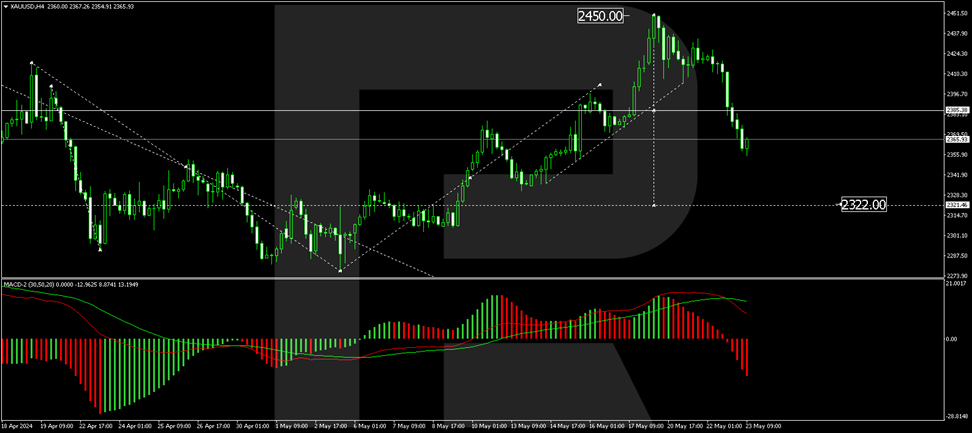
On the H4 chart, XAU/USD has formed a downward impulse to the level of 2404.40, followed by a correction to 2433.90. The limits of the consolidation range are now well-defined, and the market has recently broken out downwards. This breakout opens the potential for a further decline to 2322.00. After reaching this level, a rebound to 2385.35 is expected. This scenario is technically supported by the MACD indicator, with its signal line above zero but directed strictly downwards towards new lows.
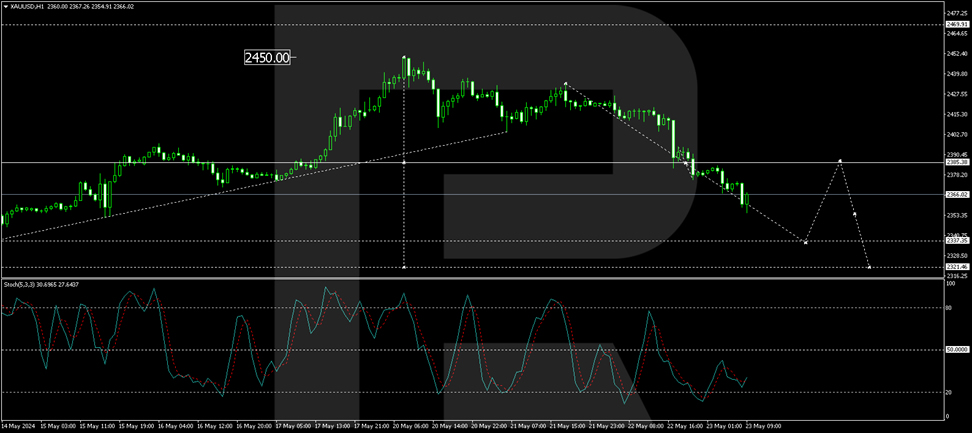
On the H1 chart, a decline to 2385.00 has been executed, followed by the formation of a consolidation range around this level. The market has recently broken out downwards from this range, opening the potential for a further decline to 2337.35, which is the local target. Following this, a correction back to 2385.00 (testing from below) is possible. Further decline towards 2321.45 may follow. This scenario is technically confirmed by the Stochastic oscillator, with its signal line above 20 and poised to rise to 50 before another potential decline to 20.
Summary
Gold prices have declined due to the Fed's cautious stance on monetary policy and the expectation of prolonged high interest rates. Technical indicators suggest further potential declines, with possible corrective rebounds along the way. Investors should monitor these levels closely as market conditions evolve.
EUR/USD Price Forms Bullish Reversal Amid Key News
Last night, the FOMC meeting minutes were released. According to USNews, there were no major surprises. However, the confirmation of persistent inflation – along with hints that some officials discussed potential future rate hikes – displayed a "hawkish" stance. The dollar index initially rose following the minutes' release but returned to pre-release levels this morning, suggesting the initial reaction might have been incorrect.
Subsequently, the Purchasing Managers' Index (PMI) data for key European economies was published. According to ForexFactory:
→ Flash Manufacturing PMI (France): actual = 46.7; expected = 45.8; previous = 45.3;
→ Flash Services PMI (France): actual = 49.4; expected = 51.8; previous = 51.3;
→ Flash Manufacturing PMI (Germany): actual = 45.4; expected = 43.4; previous = 42.5;
→ Flash Services PMI (Germany): actual = 53.9; expected = 53.5; previous = 53.2.
Overall, the actual PMI figures, considered a leading indicator of economic health, exceeded expectations and gave the euro a bullish push.
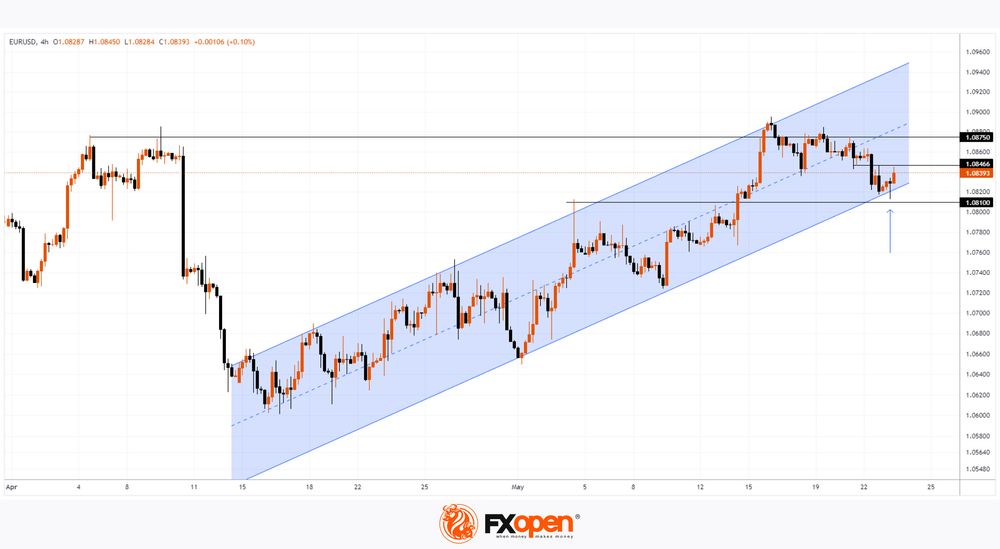
The combined effect of the euro's rise and the dollar's decline since midnight resulted in a four-hour EUR/USD chart candle with a long lower tail (indicated by an arrow), suggesting demand outweighs supply. A subsequent bullish candle could confirm this.
Technical analysis of the EUR/USD chart shows:
→ The price is within an ascending channel;
→ The 1.081 level served as resistance from 1-13 May but, following a bullish breakout on 14 May, now shows signs of support. This level is reinforced by the lower boundary of the ascending channel and the fundamental news mentioned above.
Thus, euro bulls might attempt to resume the trend and lift the EUR/USD rate to the significant resistance at 1.08750, established in April. The first test of their resolve could be the former support at 1.08466.
Trade over 50 forex markets 24 hours a day with FXOpen. Take advantage of low commissions, deep liquidity, and spreads from 0.0 pips. Open your FXOpen account now or learn more about trading forex with FXOpen.
This article represents the opinion of the Companies operating under the FXOpen brand only. It is not to be construed as an offer, solicitation, or recommendation with respect to products and services provided by the Companies operating under the FXOpen brand, nor is it to be considered financial advice.
EURGBP Tests Critical Pivot Area After Slump
- EURGBP at a make-or-break point near 0.8500 after plunge
- Oversold conditions detected, but the bears not ready to give up the battle
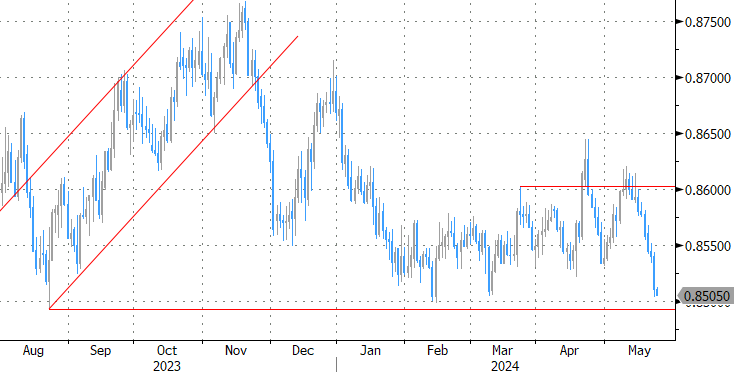
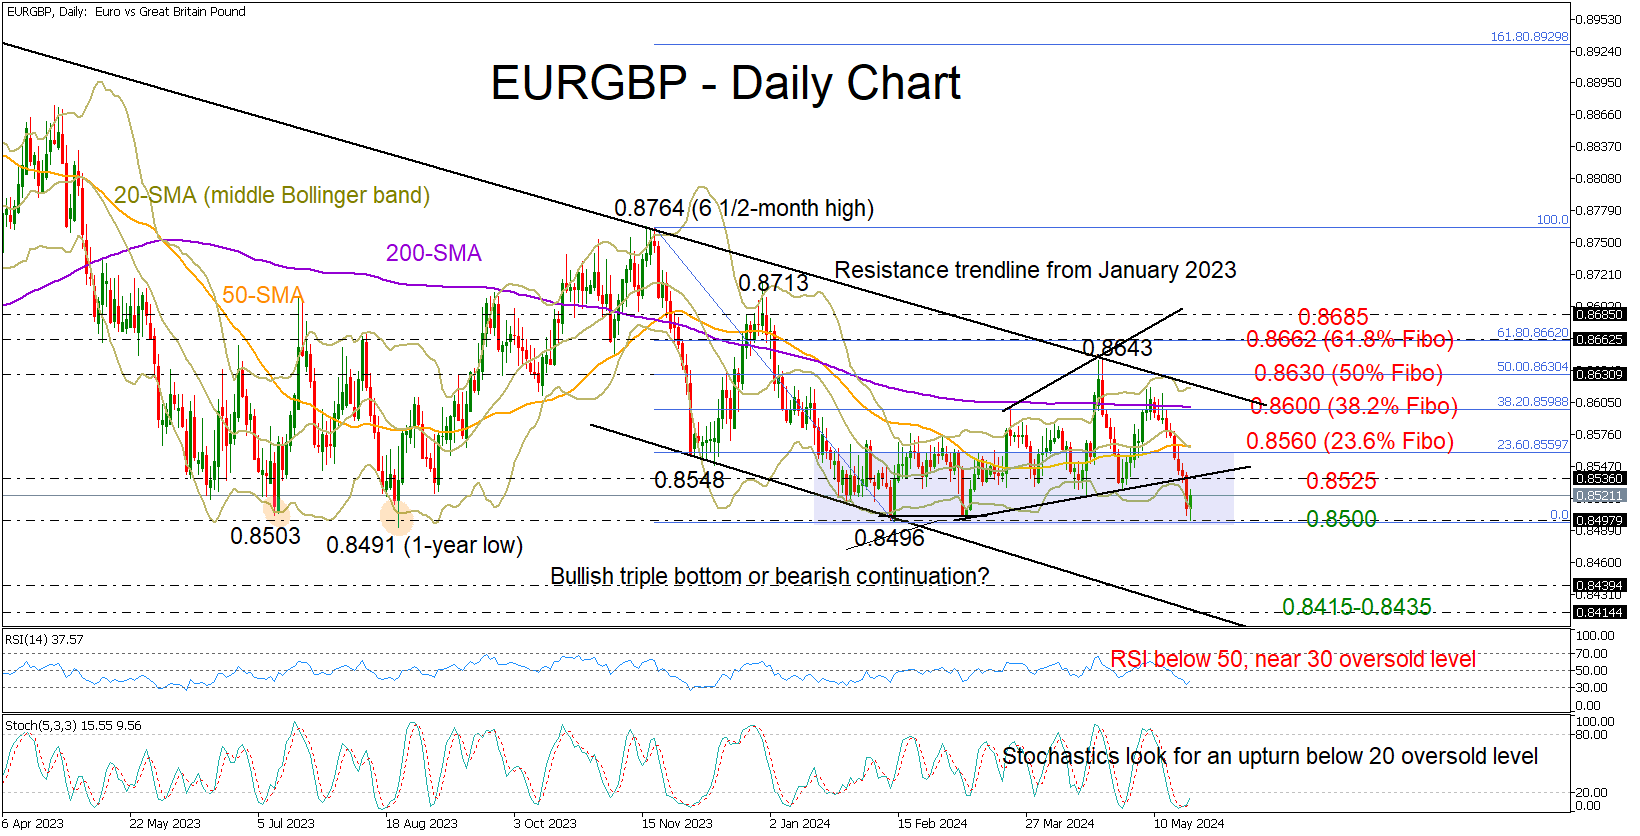
EURGBP was knocked down near the 200-day simple moving average (SMA) at the start of the month, subsequently losing around 1.0% to reach the critical pivot zone of 0.8490-0.8500 which rescued the pair fourth times since July 2023.
Better-than-expected eurozone PMI figures generated fresh positive momentum today after a decline to 0.8498. With the price having stretched below the lower Bollinger band and the stochastic oscillator preparing its next bullish cycle in the oversold zone below 20, there is potential for some recovery. Yet, Wednesday’s crash below the short-term support trendline at 0.8535 suggests that potential increases might be short-lived and insufficient to reverse the negative trajectory in the market. Recall that April’s peak at 0.8643 formed a new bearish channel in the medium-term picture.
If the bulls cannot take charge above 0.8500, the pair could slump towards the channel’s bottom and into the 0.8415-0.8430 territory last active in 2022. An extension lower could see a test near the August 2022 low of 0.8340.
In the event the current positive momentum in the price accelerates above 0.8535, the 20- and SMAs could challenge the bulls around the 23.6% Fibonacci retracement of the November 2023-February 2024 downleg at 0.8560. If the rally continues, the spotlight will again turn to the flattening 200-day SMA at 0.8600, while any spikes above that wall could cease near the channel’s upper band at 0.8625, which is also the extension of the 2023 resistance line. A break higher could trigger a fast rally towards the 0.8685 region, unless the 61.8% Fibonacci mark of 0.8660 blocks the way up beforehand.
Summing up, EURGBP is currently looking oversold near a critical support zone, which helped the pair gain significant ground in the past. That said, worsened trend signals are reducing the odds for a meaningful rebound.
Bitcoin Prepares for $100K Hike
Market picture
The crypto market is quiet, hovering around a total capitalisation of $2.6 trillion for the third day. Bitcoin has so far failed to gain a foothold above $70K, and this is curbing the enthusiasm. It is losing 0.3% in 24 hours against Ethereum’s 0.6% rise.
The top altcoins have comparatively subdued and varied dynamics, with fluctuations between -2% for Dogecoin, -1.5% for Solana and a 1.5% rise for Toncoin.
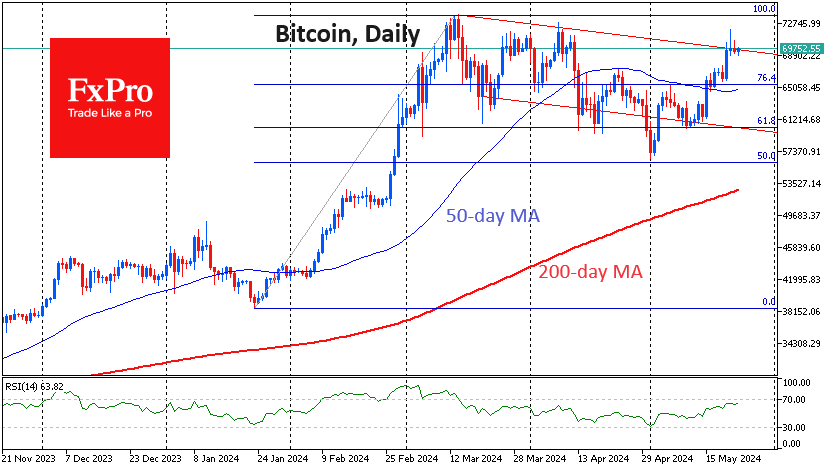
Technically, Bitcoin remains near the upper boundary of the descending range. The round level of $70K is also quite important for the young crypto market. Going higher would break two barriers at once. Short-term growth momentum could quickly take the price to the highs at $73.5K. A more distant and important target could be in the $95K-$100K area, where the lower boundary is the 161.8% level of the January-March rise and the upper boundary is an important round level.
News background
US SEC staff told trading platforms that the agency is “leaning towards” approving a spot Ethereum-ETF. This is reported by Barron’s, citing anonymous sources. The SEC has requested comments on the applications, and if submitted in time, could lead to approval as early as this week, the piece said.
At least five management companies have sent updated documents to the SEC, Bloomberg notes. Spot ETH-ETFs from VanEck and Franklin Templeton under the tickers ETHV and EZET have appeared on the US National Settlement Depository (DTCC) asset list.
The resumption of the SEC’s dialogue with companies is an important step that may indicate a U-turn in the regulator’s policy, according to Bloomberg. At the same time, some experts saw political overtones in the regulator’s actions.
If the spot Ethereum-ETFs are approved, Matrixport believes cryptocurrency Solana (SOL) could be the next contender to launch exchange-traded funds.
Decentralised exchange Uniswap called on the SEC to reconsider its decision to file the lawsuit, citing the agency’s actions as unreasonable and the legal argument as weak. Uniswap said it is prepared for a legal fight with the regulator.
SEC head Gary Gensler said that the bill proposed for approval by the House of Representatives on the structure of the U.S. cryptocurrency market excludes the definition of digital assets as securities, which poses a danger to investors.
Gold: Hawkish Fed Minutes Further Weaken Near-Term Sentiment
Gold price remains in red for the third straight day and fell to the lowest since May 15 during early European session on Thursday, in extension of Wednesday’s 1.75% drop.
Fed minutes, released late Wednesday, showed that the US central bank believes that inflation will cool further over the time, but left the door open for possible further tightening, if conditions worsen.
Markets saw the latest message from the US policymakers as hawkish signal, which raised demand for dollar and deflated the yellow metal’s price.
Fresh dips weakened near-term structure, but overall picture remains overall bullish on daily chart and suggesting that pullback from new record high ($2450, posted on May 20) would mark a healthy correction before bulls regain full control.
Strong supports at $2343/32 (Fibo 61.8% of $2277/$2450 upleg / top of thick daily Ichimoku cloud) should contain dips and keep near-term action biased higher, though return above pivots at $2391/$2400 (daily Tenkan-sen / psychological) will be required to confirm.
Conversely, loss of $2343/32 handles would open way for deeper correction and expose next targets at $2318/$2300 (Fibo 76.4% / psychological) guarding key near-term supports at $2277/72 (May 3 low and floor of recent consolidation range (Fibo 38.2% of $1984/$2450 uptrend).
Only firm break here would sideline larger bulls and generate initial reversal signal on completion of a double-top pattern ($2431/50).
Res: 2391; 2400; 2413; 2433.
Sup: 2343; 2332; 2300; 2277.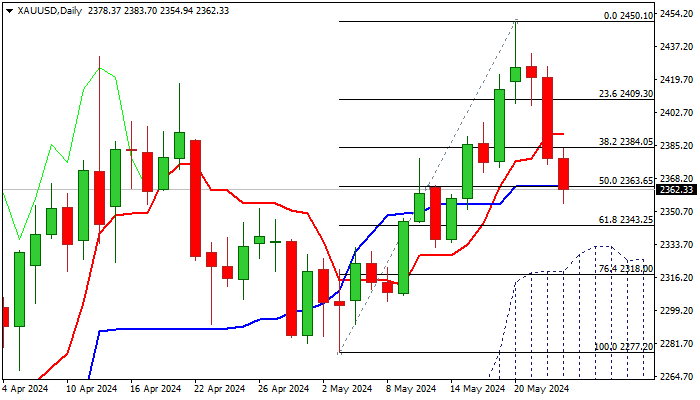
New Zealand Dollar Rises After Hot Retail Sales Data
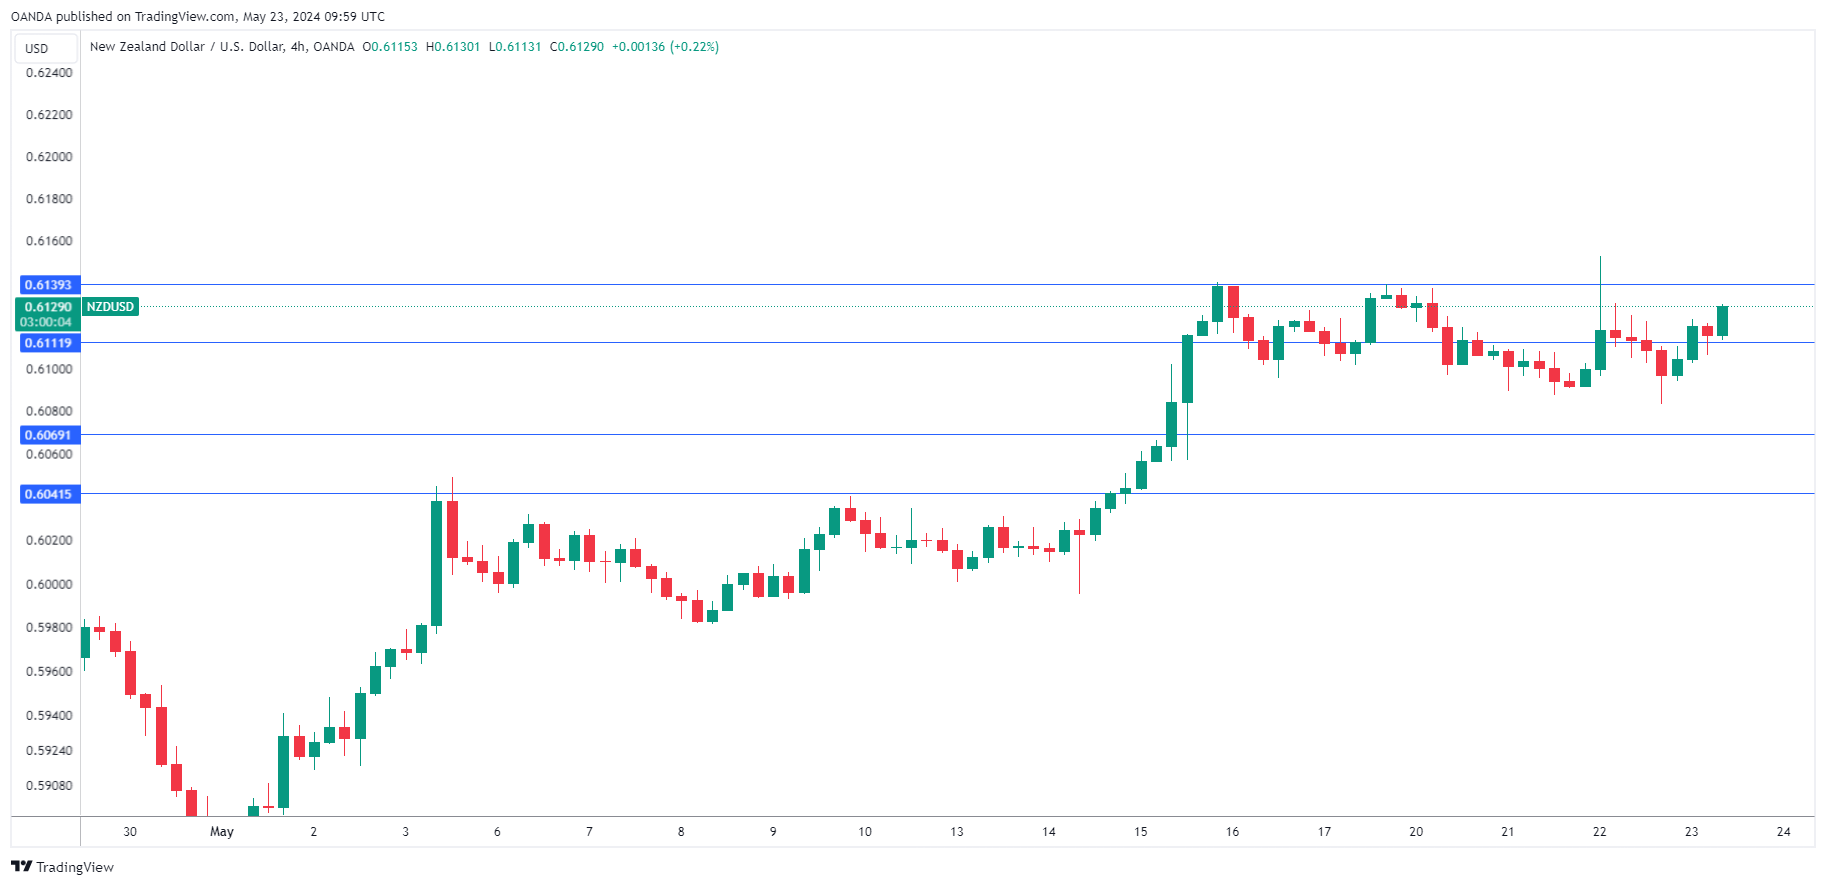
The New Zealand dollar is in positive territory on Thursday. NZD/USD is up 0.38%, trading at 0.6120 in the European session at the time of writing. The New Zealand dollar showed some strength after the Reserve Bank of New Zealand rate decision on Wednesday, gaining as much as 1% and hitting a nine-week high. However, the New Zealand dollar couldn’t consolidate and gave up almost all of these gains.
NZ retail sales climb for first time in two years
New Zealand’s retail sales rose 0.5% q/q in the first quarter, which was itself an achievement after declining for eight straight quarters. This beat the market estimate of -0.3%. The turnaround was driven by a strong increase in the purchase of food and recreational goods. On a yearly basis, retail sales is still in a deep hole, with a 2.4% decline in Q1, following a 4.1% decline in the fourth quarter of 2023. This was a sixth consecutive quarter of a fall in retail spending.
The Reserve Bank of New Zealand held the cash rate at 5.5% for a seventh straight time, as it sticks with its “higher for longer” rate policy. At the follow-up press conference, Orr noted that inflation expectations were falling and said it would take time for inflation to decline. Orr said that Bank members had discussed raising rates at the meeting, reiterating the policy statement. The RBNZ is concerned about high inflation and a rate cut does not look likely in the near-term.
FOMC minutes reflect Fed’s hawkish stance
With inflation falling around the globe, major central banks have been under pressure to lower interest rates. The central banks remain cautious, however, and the Fed minutes indicated that there was a discussion to raise rates at the May 1st meeting. The Fed is not the only player with a hawkish stance; the central banks of Australia and New Zealand held rates at their May meetings but indicated that members looked at the option of raising rates.
The FOMC minutes noted that policy makers are not confident about lowering rates at this stage and want to see more evidence that inflation falls closer to the 2% target. This message is consistent with what we have been hearing from a host of Fed members, although the markets have priced in a September rate cut.
NZD/USD Technical
- NZD/USD is testing resistance at 0.6111. Above, there is resistance at 0.6139
- 0.6069 and 0.6041 are the next support levels
Is USDJPY Still Searching for New Highs?
- USDJPY surpasses key resistance, but more steps needed
- Short-term risk tilted to the upside; 157.00 mark under examination
- US S&P Global PMIs, initial jobless claims, new home sales on the agenda
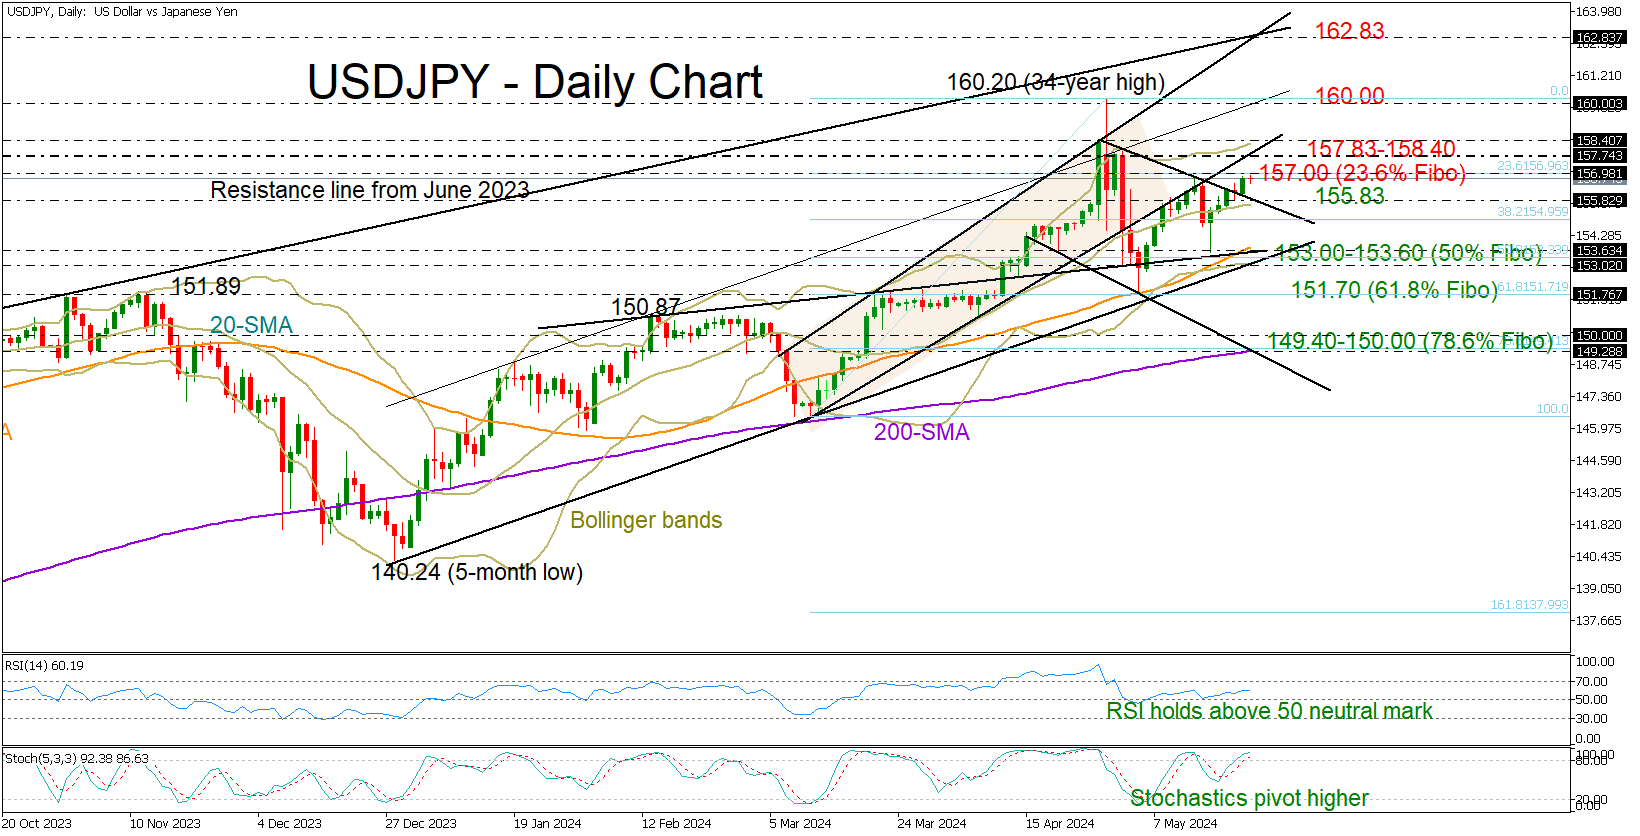
USDJPY closed Wednesday’s session with modest gains at 156.75 as the FOMC minutes highlighted worries about inflation and disagreements among policymakers on the timeline of monetary easing.
The soft bullish move was enough to drive the price above the short-term resistance line drawn from April and therefore boost optimism for a continuation higher, but there are a couple of obstacles which could still stop the rally.
Specifically, the 23.6% Fibonacci retracement of the latest upleg near 157.00 and April’s border of 157.83-158.40 are within breathing distance and overlap with the broken support trendline from March. The bulls must breach the latter in order to advance towards the 2024 resistance line seen near 160.00. Even higher, the pair could target the critical trendline area of 162.83.
In trend signals, the positive gap between the shorter- and longer-term simple moving averages (SMAs) is currently endorsing the ongoing upward wave. The momentum indicators are favouring the bulls too, with the RSI fluctuating comfortably above its 50 neutral mark , the stochastic oscillator bouncing up again, and the price itself hovering within the bullish upper Bollinger area.
However, if the price drops below its 20-day SMA and the descending line at 155.80, traders may start selling, pushing the price into the 153.00-153.60 range. This is where the 50-day SMA, the 50% Fibonacci level, and two critical constraining lines are placed. Hence, a close lower could confirm another leg down to the 61.8% Fibonacci of 151.70. In the event that the bears claim dominance over the floor, the short and medium-term outlook could deteriorate, resulting in a possible decline towards the 149.40-150.00 region, where the 200-day SMA and 78.6% Fibonacci number converge.
Overall, while USDJPY bulls appear to have the advantage, it would be intriguing to see if they can surpass the 158.40 level.
UK PMI manufacturing rises to 22-month high, services growth slows
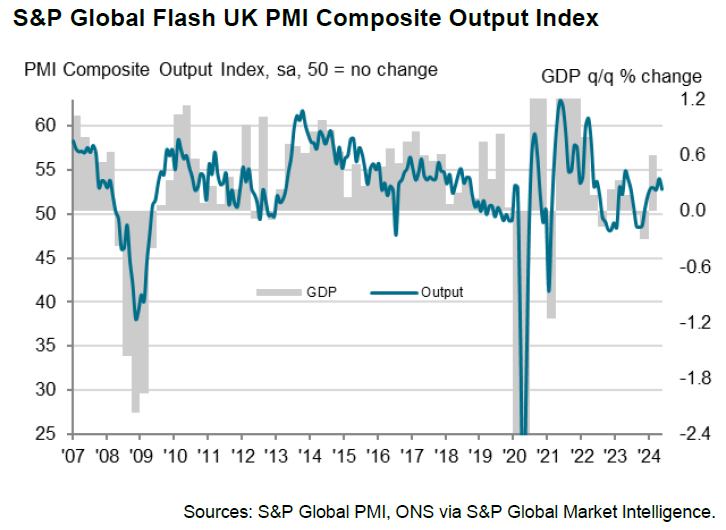
UK PMI Manufacturing rose from 49.1 to 51.3 in May, surpassing expectations of 49.2 and reaching a 22-month high. However, PMI Services fell from 55.0 to 52.9, below the anticipated 54.8 and marking a 6-month low. Consequently, PMI Composite dropped from 54.1 to 52.8.
Chris Williamson, Chief Business Economist at S&P Global Market Intelligence, stated that the flash PMI indicates a "further expansion" of UK business activity, aligning with GDP growth of around 0.3% in Q2. He highlighted an "encouraging revival of manufacturing accompanied by sustained, but slower, service sector growth."
The survey also revealed positive news regarding service sector inflation, which is cooling. Companies reported the slowest price growth in over three years, with headline inflation falling close to BoE's target. Williamson noted that the PMI data support the view that BoE will start cutting interest rates in August, assuming the data continues to improve over the summer.
Eurozone PMI composite hits 12-month high at 52.3, pointing to 0.3% GDP growth in Q2
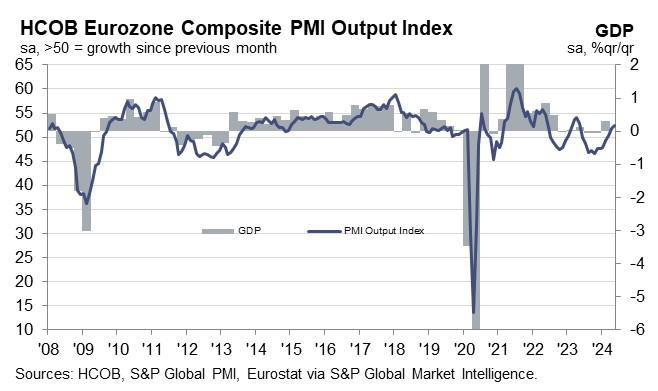
In May, Eurozone's PMI Manufacturing rose from 45.7 to 47.4, surpassing expectations of 46.6 and marking a 15-month high. PMI Services remained unchanged at 53.3, slightly below the forecast of 53.5. PMI Composite increased from 51.7 to 52.3, reaching a 12-month high.
Cyrus de la Rubia, Chief Economist at Hamburg Commercial Bank, noted that Eurozone's economy is "gathering further strength." He highlighted that new orders are growing at a healthy rate, and companies' confidence is reflected in a steady hiring pace.
Additionally, de la Rubia pointed out some positive developments for ECB. Rates of inflation for input and output prices in the services sector have softened. This trend supports ECB's apparent stance to cut rates at the upcoming meeting on June 6.
Incorporating PMI numbers into their GDP nowcast, de la Rubia suggested that Eurozone will likely grow at a rate of 0.3% during Q2, effectively dispelling fears of a recession. He further indicated that GDP growth rate of nearly 1% could be achievable this year, with potential for even higher growth.
Full Eurozone PMI release here.
Also released, French PMI Manufacturing rose from 45.3 to 46.7 in May. PMI Services fell from 51.3 to 49.4. PMI Composite fell from 50.5 to 49.1, back in contraction.
Germany PMI Manufacturing rose from 42.5 to 45.4 in May, a 4-month high. PMI Services rose from 53.2 to 53.9, an 11-month high. PMI Composite rose from 50.6 to 52.2, a 12-month high.
EUR/USD Fell With Noticeable Acceleration After FOMC Minutes
Markets
Above-consensus April inflation figures in the UK triggered an obvious underperformance of gilts, resulting in yield gains between 7.2 (30-yr) and 14.2 bps (2-yr). A June rate cut by the BoE is just short of fully priced out. Steep gilt losses dragged core peers lower as well. German yields gapped higher at the open and traded sideways afterwards. Yields ended between 2.7 and 4 bps higher across the curve. US rates at the front rose up to 4.2 bps after receiving a second gentle push in the back by the FOMC May meeting minutes. They generally showed policymakers supporting a higher for longer message in the wake of “disappointing readings on inflation over the first quarter”. “Various” participants mentioned willingness to tighten further if needed, something chair Powell at the press conference more or less ruled out. While he said back then that policy was restrictive enough, the minutes revealed more uncertainty with officials pointing at the possibility of high interest rates having a smaller impact on the economy than in the past and a potentially higher neutral rate. The dollar gained the upper hand all day against most peers, supported by the minor risk-off on equity markets (WS between 0.2 and 0.5% lower). EUR/USD fell from 1.0854 to 1.0823 with a noticeable acceleration after the minutes’ release. DXY closed a tad below 105, up from 104.618 at the open. USD/JPY (156.8) closed at the highest level since the (alleged) intervention by Japanese officials. Sterling shared first place with the NZD (hawkish hold by the RBNZ). EUR/GBP tanked towards the lowest level since mid-March. With a close at 0.851 the pair seems to be reading a test for the YtD low of 0.8498. Cable (1.2717) eked out a small again despite an overall strong USD.
PMI business confidence and euro area Q1 negotiated wages are the next big thing on this week’s economic calendar. Markets are headed towards their release expecting an ongoing recovery of the former in Europe. Especially services (53.3 in April) surprised to the upside lately, with even final readings coming in better than the preliminary release. Manufacturing will remain in the doldrums, weighed down by Germany in particular. Last time around, though, the rate of decline in the actual output eased again to the slowest in 12 months. Price pressures have been intensifying in recent months with prices in services climbing at a strong pace by historical standards, driven by higher wage rates. This is where the Q1 wage negotiations outcome will offer an important glimpse for what to expect going forward. Member states data suggest only a marginal easing of the 4.5% pace in 2023Q4. Taken together, we believe today’s data will support core/European yields in their recent recovery. This should protect the euro’s downside against a dollar that did notice yesterday’s FOMC meeting minutes and Powell’s one-sided interpretation at the presser. A break above the recent highs (1.0895) requires a strong upside surprise in both the PMIs and the wage data.
News & Views
UK PM Rishi Sunak yesterday called a July 4 general election. The move came as a surprise as the Conservatives trail the opposition Labour party led by Keir Starmer by some 20 points in the polls (roughly 45% vs 25%), likely ending their 14-yr rule in power. There was no point in waiting until autumn though. After consulting with Chancellor Hunt, they agreed there won’t come any additional economic cheer, not least because public finances don’t allow for more tax gifts. It could help them campaigning on the swift recovery from recession and the fall in inflation (2.3% headline) given the bumpy path ahead. The Tories faced a hard January 2025 deadline nevertheless to hold new elections.
The Bank of Korea kept its policy rate unchanged at 3.5% this morning, the level in place since January 2023. The decision was unanimous. The central bank raised its growth forecast for this year from 2.1% to 2.5% and lowered it from 2.3% to 2.1% for next year. This year’s CPI forecast is unchanged at 2.6%, but more data is needed to be confident that inflation will converge to the target given increased upside inflation risks (stronger Q1 growth, heightened volatility in the exchange rate and persisting geopolitical risks). Governor Rhee Chang-yong at the press conference sounded less certain on the timing of a potential first rate cut than a month ago.
Graphs
GE 10y yield
ECB President Lagarde clearly hinted at a summer (June) rate cut which has broad backing. EMU disinflation continued in April and brought headline CPI closer to the 2% target. Together with weak growth momentum, this gives backing to deliver a first 25 bps rate cut. A more bumpy inflation path in H2 2024 and the Fed’s higher for longer strategy make follow-up moves difficult. Markets have come to terms with that.
US 10y yield
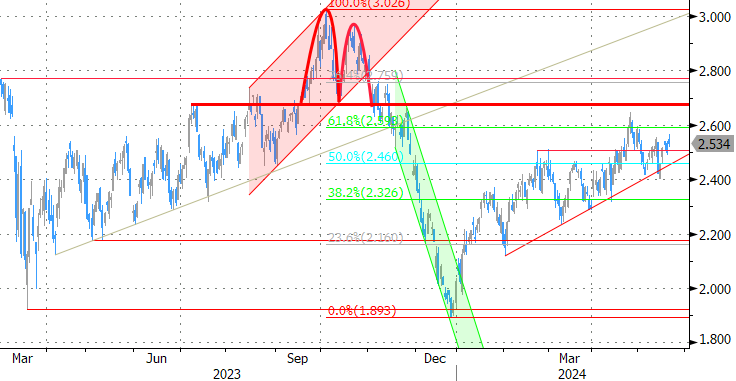
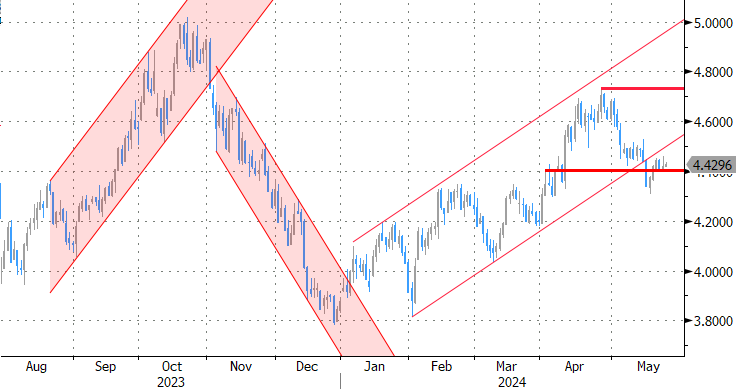
The Fed in May acknowledged the lack of progress towards the 2% inflation objective, but Fed’s Powell left the door open for rate cuts later this year. Soft US ISM’s and weaker than expected payrolls supported markets’ hope on a first cut post summer, triggering a correction off YTD peak levels. Sticky inflation suggests any rate cut will be a tough balancing act. 4.37% (38% retracement Dec/April) already might prove strong support for the US 10-y yield.
EUR/USD
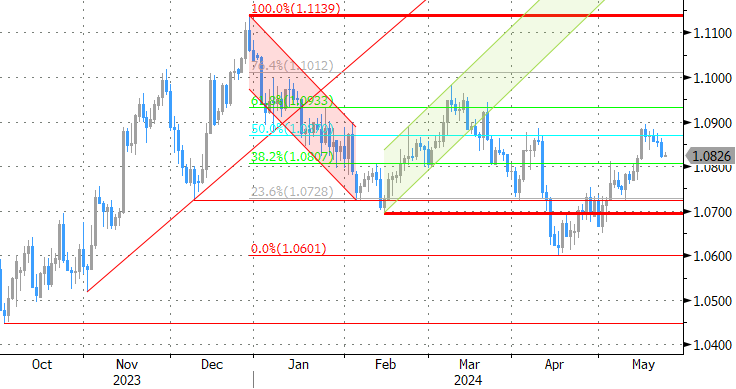
Economic divergence, a likely desynchronized rate cut cycle with the ECB exceptionally taking the lead and higher than expected US CPI data pushed EUR/USD to the 1.06 area. From there, better EMU data gave the euro some breathing space. The dollar lost further momentum on softer than expected early May US data. Some further consolidation in the 1.07/1.09 are might be on the cards short-term.
EUR/GBP
Debate at the Bank of England is focused at the timing of rate cuts. Most BoE members align with the ECB rather than with Fed view but slower than expected April disinflation complicated matters. A June cut looks in line with the ECB looks improbable. Sterling extends a recent bull rally. A test of EUR/GBP’s 2024 YtD low (0.8489) is possible. We expect this important support level to hold.