Sample Category Title
Why is Gold Defying Gravity?
- Gold stays in rally mode, even when dollar and yields rise
- Central banks and geopolitics among the main drivers
- Chinese demand and inflation hedging add extra support
Is it a bird? Is it a plane? No, it’s gold!
Gold entered a flying mode at the beginning of March, surpassing its previous record high of $2,135 hit on March 7. The metal consolidated only for a while thereafter before rallying again during the last days of the month to continue conquering uncharted territory. And all this even during periods when the dollar and Treasury yields were rising on the back of easing bets about Fed rate cuts.
From pricing in around 160bps worth of reductions at the turn of the year, the market now believes that by December, Fed officials will lower borrowing costs by only around 70 basis points, even fewer than the Fed’s projection of 75. This was the result of stickier-than-expected inflation and data pointing to solid economic performance in the US.
What are the buying forces?
But why did gold traders remain indifferent to such developments? Why has the inverse correlation of gold with the dollar and yields broken down?
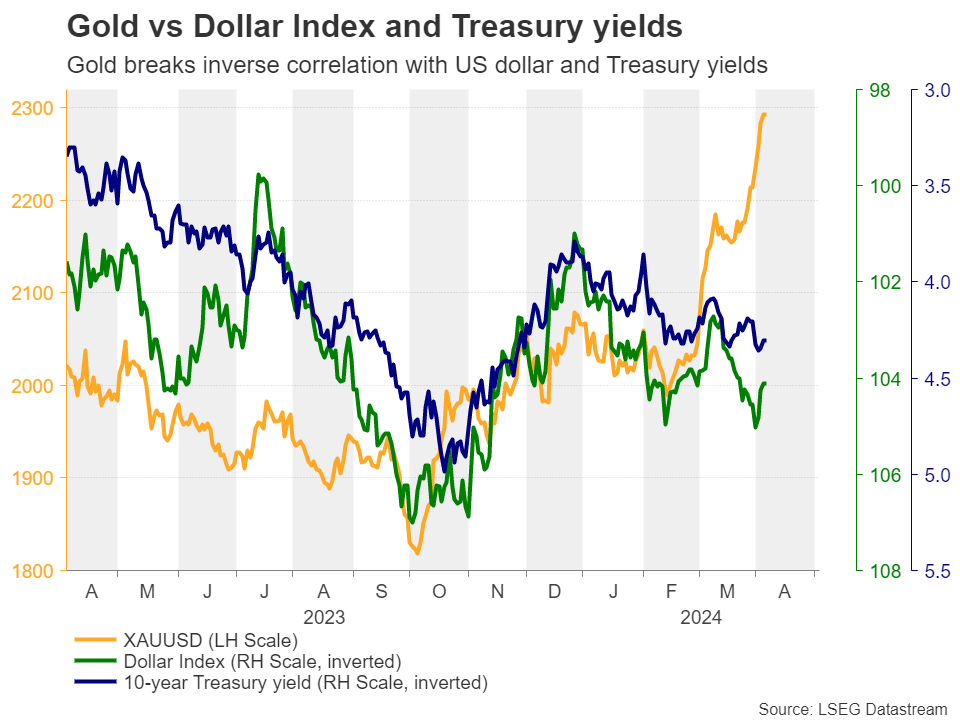
The fact that gold did not materially slide between December and February, when the dollar was outperforming all its major counterparts, suggests that there are other forces keeping the precious metal supported.
Central bank purchases
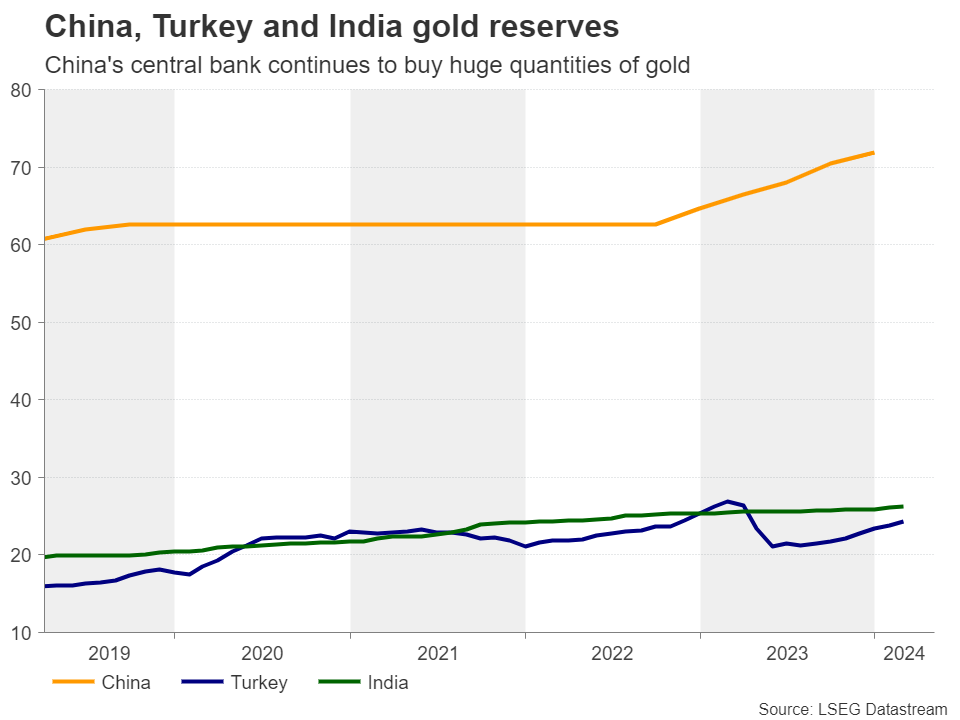
One may be the continued purchases by central banks, with the frontrunners being China, Turkey, and India. Although the latest publicly available data is for February points to a notable slowdown in central bank buying from January, those three central banks continued their purchases at an elevated pace, with China holding a long distance from the other two. Whether the overall central bank buying accelerated during March, when the precious metal skyrocketed, will be confirmed in the first few days of May.
Safe-haven flows
The geopolitical uncertainty may also be a reason for investors to canalize flows into gold. The Israeli strikes on the Iranian consulate in Syria with Iran promising payback, as well as Ukraine’s attacks on Russia’s oil infrastructures, are far from suggesting that the conflicts are nearing resolution. And with the yen staying wounded even after the BoJ’s decision to lift interest rates, gold may be the only safe haven in town.
Chinese demand
Traditionally, India is also a helping hand during the first few months of the year, as demand in the world’s second largest consumer for the precious metal increases due to the wedding season. However, as gold prices already hit a record in December, demand was dampened this year, with India’s imports likely plunging by more than 90% in March according to a government official.
Considering that China and India account for more than half of total global gold demand, the yellow metal may be drawing bigger support from the world’s second-largest economy. With the Chinese stock market suffering and cryptos being banned there, the options for vehicles that local investors can profit from become very limited, and that’s maybe one of the reasons for increasing demand for gold. Indeed, the Shanghai benchmark gold price has been rising faster than international prices for the last couple of years.

Risk of Fed rate cut delay
As for expectations regarding the Fed’s future course of action, delayed rate cuts may not be much of a concern for gold investors whose horizons are likely longer than those of forex traders. The fact that the Fed’s next policy move is likely to be a cut may be more than enough, as it keeps the upside potential in Treasury yields limited. And with inflation data suggesting that prices in the US are stickier than previously expected lately, some participants may have viewed gold as a hedging vehicle against inflation for now.
Will the rally continue?
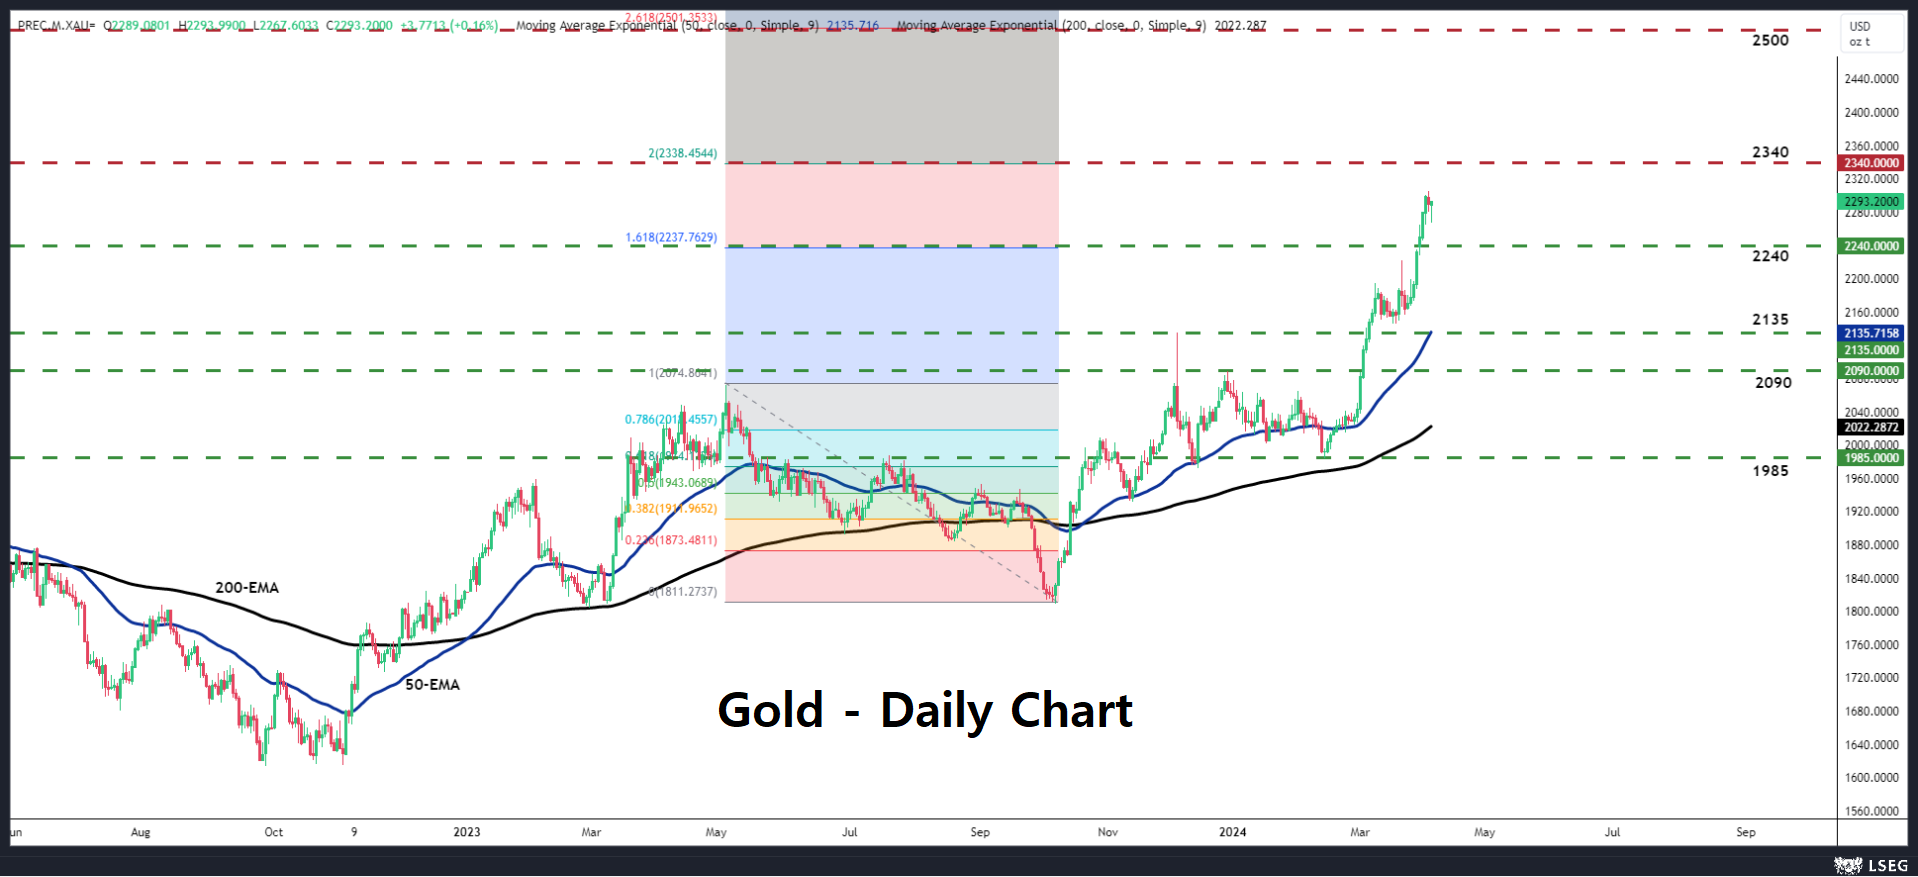
Moving ahead, the prospect of lower interest rates in the US, the elevated demand from China, and the uncertainty surrounding the geopolitical landscape are likely to keep gold supported for a while longer. With no prior highs or inside swing lows to mark potential resistance levels on the metal’s way higher, the next zone that could play such a role may be the 200% extension level of the May – October 2023 decline, at around $2,340. A break higher may encourage traders to aim for the psychological level of $2,500, which I the 261.8% Fibonacci extension level of the aforementioned slide.
For the outlook to change
For the picture to darken, the precious metal may need to slide below $2,135, a level which now coincides with the 50-day exponential moving average (EMA). That said, for such a fall to materialize, some fundamental themes may need to change.
For example, the Chinese economy may need to improve to the point where local investors feel more confident to divert flows to the Chinese stock market. Or tensions between the world’s two largest economies – the US and China – may need to diminish, something that may prompt the PBoC (People’s Bank of China) to slow substantially its gold purchases. After all, the PBoC’s gold buying rampage is driven by a desire to weaken its dollar dependency. Other narratives that could weigh on gold may be the resolution of the geopolitical conflicts in the Middle East and Ukraine, or a fading out of all the basis points worth of Fed rate cuts for this year. Having said all that though, all these changes seem unlikely to happen anytime soon.
RBNZ May Start Laying Groundwork for a Rate Cut
- A dovish shift seems to be underway at the Reserve Bank of New Zealand
- Technical recession and falling inflation may pave way for 2024 rate cut
- Is a dovish hold on the cards at Wednesday’s meeting (02:00 GMT)?
Weaker economy has been good news for inflation
New Zealand’s economy shrunk in the final three months of 2023, entering a technical recession for the second time in 15 months. In the bigger picture, economic growth appears to have stagnated, much like in Europe and the United Kingdom. For policymakers, this is probably seen as a necessary price for bringing inflation under control, and all the indications are that it is working.
Inflation fell to 4.7% in Q4 and there was likely a further drop in the consumer price index in the first few months of 2024 as the RBNZ’s own measures of inflation expectations continued to decline in the first quarter.
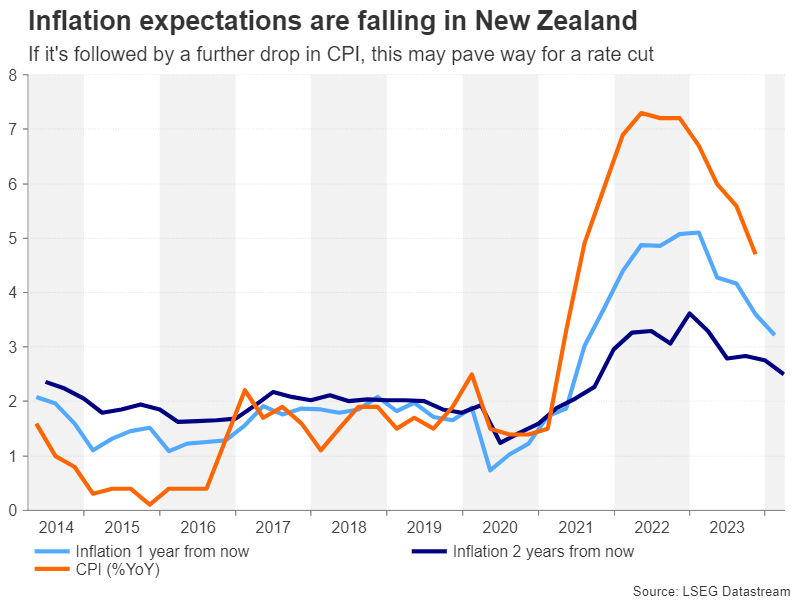
Things have also been moving in a ‘satisfactory’ direction for the labour market. Worker shortages started to ease after more migrants were allowed to enter the country following the reopening of the borders in 2022. The unemployment rate has been steadily edging higher, reaching 4.0% in Q4 versus the post-pandemic low of 3.2%. More importantly, wage growth has been moderating, falling to 3.9% in Q4.
Rate cuts may come sooner than anticipated
Governor Adrian Orr even went as far as acknowledging in recent remarks that the conditions for cutting rates are becoming more apparent. Meanwhile. the Bank’s chief economist, Paul Conway, signalled back in March that a Fed rate cut towards the end of this year would make it easier for the RBNZ to follow suit if it leads to an appreciation in the New Zealand dollar versus the greenback.
At the last meeting, policymakers had projected that rates could begin to fall sometime in the middle of 2025, significantly later than the current market pricing of August 2024 for a 25-basis-point cut. There will be no updated forecasts at the April meeting, nor a press conference by Orr, but there’s likely to be some clues in the statement about whether or not committee members are becoming more optimistic about inflation falling within the 1-3% target band sooner than anticipated.
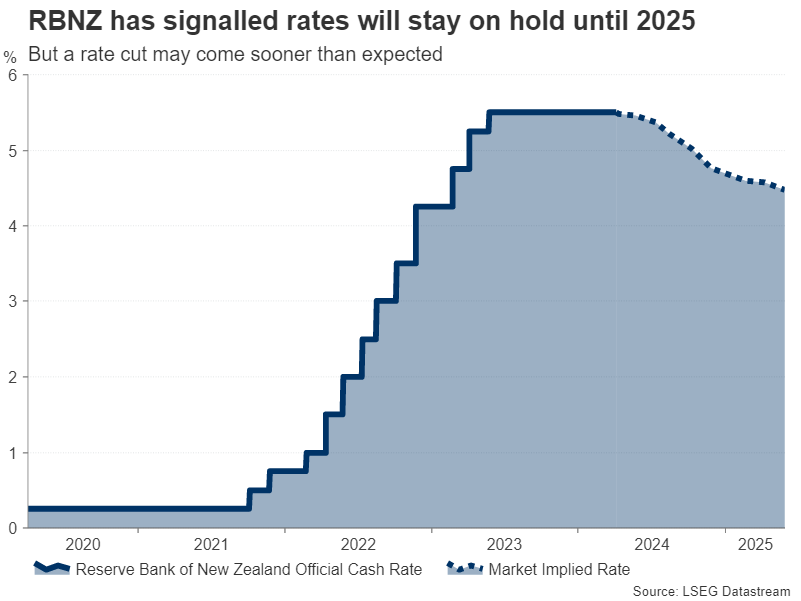
Specifically, the language will possibly reveal whether the expected decision to keep the policy rate unchanged at 5.50% will signal another dovish tilt after the Bank adopted a somewhat more neutral stance at the February meeting.
Kiwi on the slide
And this will likely determine the market reaction in the local dollar. The kiwi has come under pressure lately, slipping to four-and-a-half-month lows against the US dollar. Should the language of the statement be more dovish than expected, the kiwi could breach the April 1 low of $0.5938 and head for the $0.5900 mark. A drop below this level would bring $0.5860 into view before targeting the $0.5800 area that supported prices in October 2023.
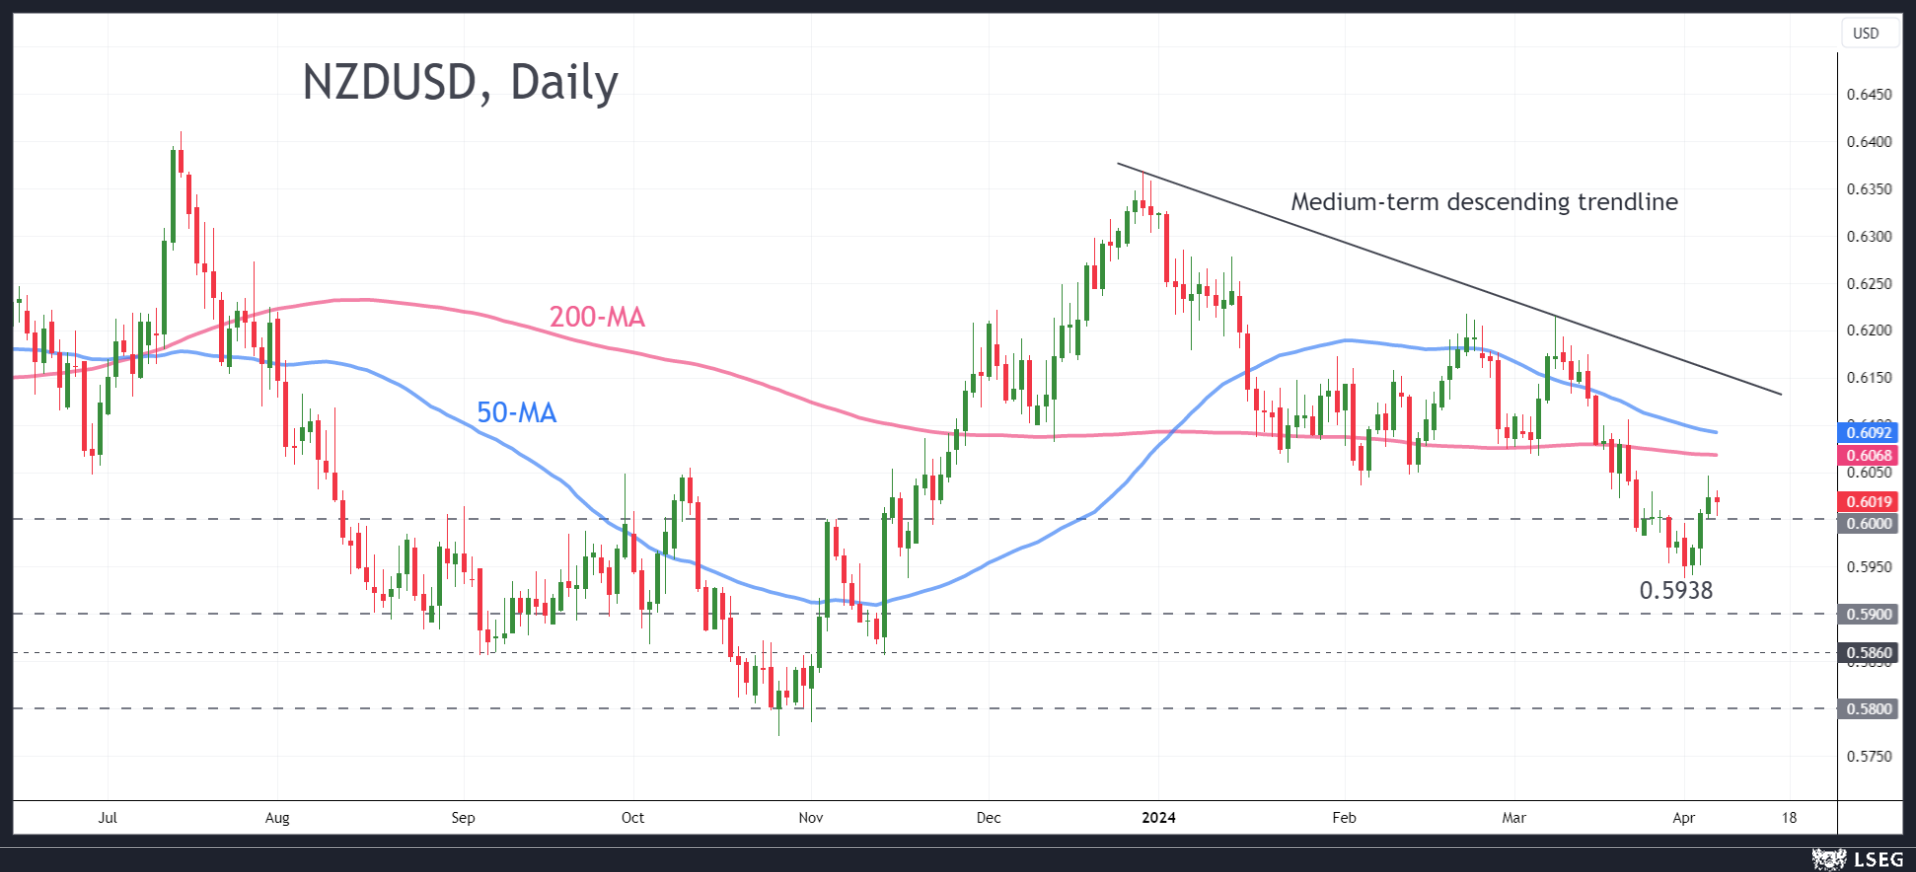
However, if policymakers maintain their caution over the inflation outlook and the need for a prolonged period of restrictive policy, the kiwi could rebound towards its 200-day moving average, currently at $0.6068, before aiming for the medium-term descending trendline.
Yet, for the kiwi to stage a meaningful rebound, the Fed would first have to start its easing cycle and additionally, China’s economic recovery would have to gather more pace. This would create the ideal conditions for a rally, potentially offsetting any selling pressure from a more dovish RBNZ.
Week Ahead – ECB Decision and US Inflation to Fuel FX Volatility
- Central bank decisions in Eurozone, Canada, and New Zealand
- Highlight will be the ECB - likely to signal a rate cut in June
- In US, the dollar will be driven by inflation stats and Fed minutes
ECB meeting - Nearly time to cut
The Eurozone economy has gone through a rough patch over the last year. Growth has been almost stagnant, held back by Germany, which fell into contraction as a slowdown in global trade suppressed demand for exports and crippled the nation’s manufacturing sector.
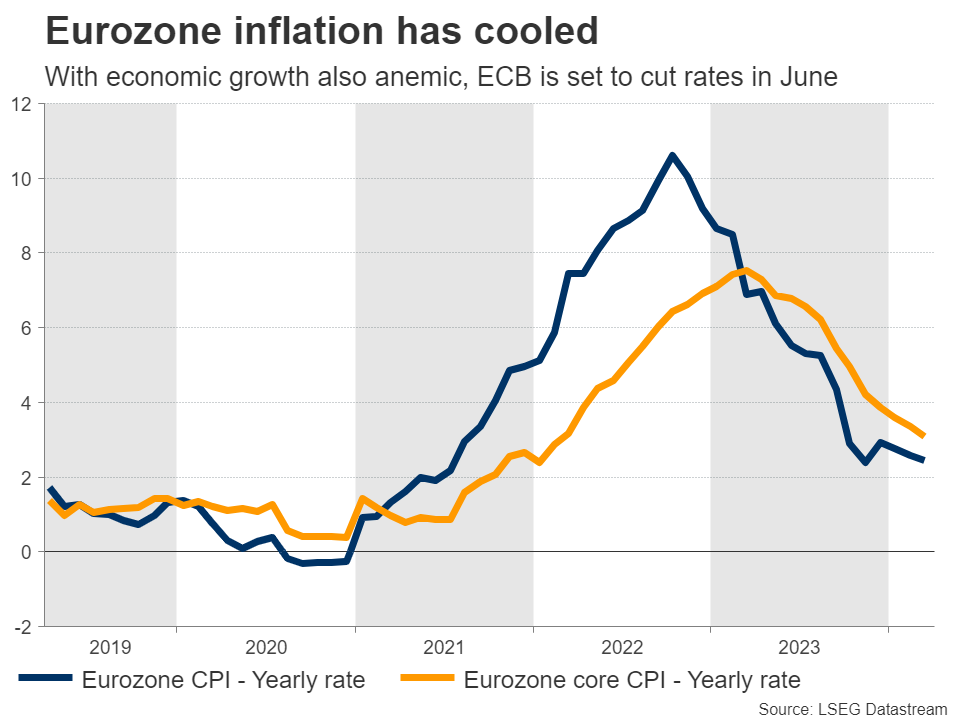
On the bright side, the economic stagnation has helped dampen inflationary pressures. Inflation fell to 2.4% in March, pushing the European Central Bank one step closer to cutting interest rates. Most ECB officials have pointed to a cut in June as the most likely scenario.
Investors share this view. A June rate cut is already fully priced into money markets, reflecting the slower growth pulse and the cooldown in inflation. The unemployment rate has also risen a touch this year, reinforcing hopes that inflation is headed lower.
Therefore, the ECB will likely use the meeting on Thursday as a stepping stone, setting the stage for summer rate cuts. President Lagarde could highlight the progress on inflation and argue that lowering rates soon would help minimize the risk of a recession.
As for the euro, its gloomy economic fundamentals paint a negative picture. One reason the single currency has been so resilient over the past year has been the collapse in natural gas prices, which benefited the euro through the trade channel. The euphoric tone in stock markets also helped, by pinning down the safe-haven US dollar.
So the euro has been kept afloat not by economic performance, but rather by developments in other financial markets. This is a double-edged sword, because it implies that any change in these trends could remove a big pillar of support for the currency.
In other words, the euro needs low gas prices and rising stock markets to remain above water. Otherwise, traders might start focusing on the anemic growth outlook and rate cuts.
US inflation and Fed minutes in focus
Over in the United States, the spotlight will fall on CPI inflation data and the minutes of the latest Fed meeting, both on Wednesday. These will help investors decide whether the Fed will cut rates in June, which markets currently assign a 70% probability to.
Forecasts suggest inflation reaccelerated, with the CPI rate seen at 3.4% in March from 3.2% previously. However, the core rate is anticipated to tick down to 3.7%. The difference most likely reflects the rally in oil during the month, as the core figure excludes the effects of energy prices.
This would translate into a mixed report for the Fed. A decline in the core rate would suggest the broader trend of disinflation continues, even if rising energy prices are keeping headline inflation elevated.
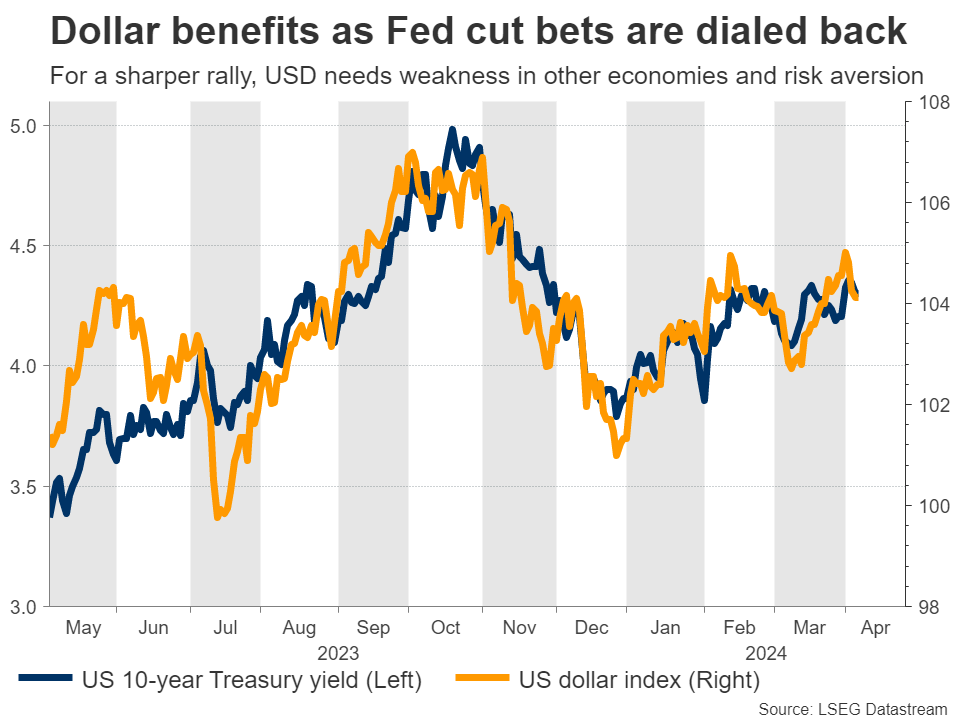
Meanwhile, the minutes will cover the March meeting, where FOMC officials upgraded their growth and inflation forecasts but still projected three rate cuts for this year. It will be interesting to see the discussions behind the scenes. That said, this release is unlikely to contain any groundbreaking revelations, as most officials have spoken several times since this meeting.
As for the dollar, it went for a wild ride this week, losing ground after a disappointing ISM services survey but then recovering with some help from risk aversion amid fears of an Iranian attack against Israel.
Overall, US economic fundamentals seem stronger than most regions. For instance, GDP growth is on track to hit 2.5% this quarter according to the Atlanta Fed. Therefore, the broader outlook seems positive, although for the reserve currency to stage a lasting rally, it might need more signs of weakness in foreign economies or a risk-off atmosphere that fuels demand for haven assets.
Rate decisions in Canada and New Zealand
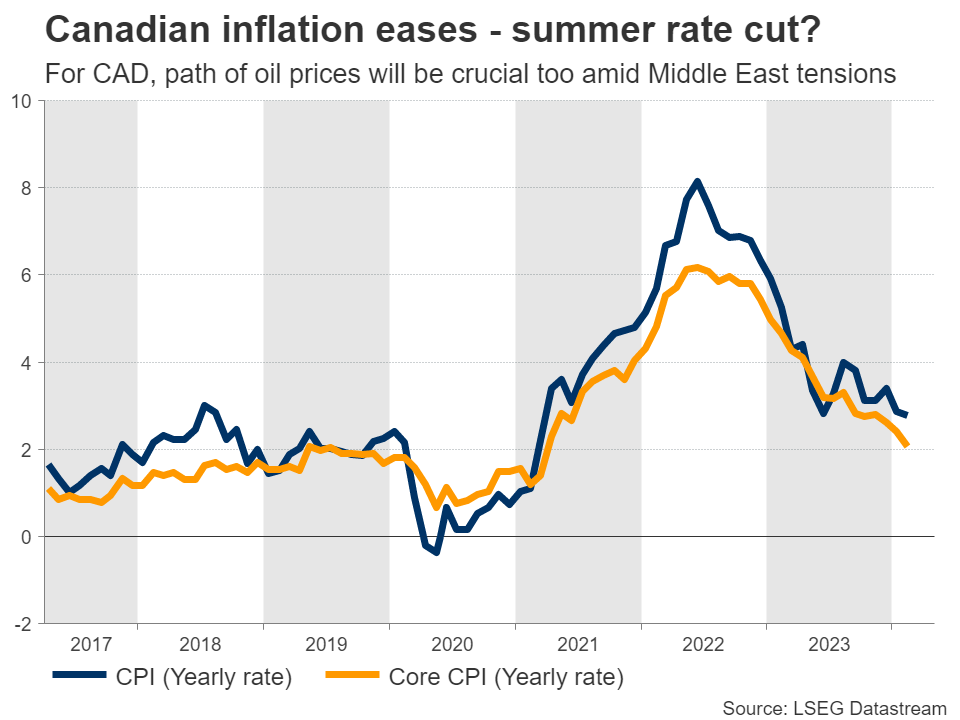
In Canada, the central bank meets on Wednesday and markets assign a 15% chance for an immediate rate cut, as core inflation has declined steadily. Massive population growth has helped to loosen labor market conditions, dampening concerns about wage-fueled inflation. The negative side of that is housing shortages, which are keeping shelter inflation hot.
As such, the Bank of Canada is unlikely to slash rates at this meeting, although it might provide clearer signals that cuts are coming this summer. The Canadian dollar will also be driven by oil prices, with any escalation in the Middle East likely to benefit the oil-exporting currency.
Crossing into New Zealand, the local currency has been on the ropes this year, losing more than 4% against the US dollar. The economy fell into a minor technical recession late last year, which has weighed on consumer and business confidence. But inflation remains elevated, so markets don’t expect any move from the Reserve Bank when it meets on Wednesday.
For the New Zealand dollar to mount a sustainable comeback, it will probably need a meaningful recovery in China that boosts demand for the nation’s commodity exports.
In this sense, China’s trade data for March will be closely watched on Friday for any signs of a rebound. Other notable releases on Friday include monthly GDP stats from the United Kingdom.
ECB Preview – An Intention to Cut
We expect the key takeaway from next week's ECB meeting will be an affirmation of the prevailing ECB narrative, of the ECB on route to deliver a rate cut in June. While this meeting may be considered an interim meeting, and lead to limited market reaction, we expect the ECB to deliver a clear commitment to a June rate cut, in the form of explicit guidance of an 'intention to cut by 25bp in June'. We expect no guidance will be offered beyond that point on the pace of cuts or the end level of the tightening cycle.
Markets are pricing 1bp for next week's meeting and 23bp of cuts in June. Our baseline scenario of three cuts of 25bp this year still holds, but see the risks skewed for ECB to deliver less than that this year, due to the sticky underlying inflation.
Weekly Focus – Decent Data Over Easter Dampen Rate Cut Expectations
Positive data surprises especially in the US have continued to mostly drive interest rates higher and the USD stronger over the last two weeks. Americans increased their consumption by 0.4% in February and reduced their savings rate to its lowest level since December 2022, while the ISM survey showed a clear positive surprise in March for US manufacturers who are now reporting expansion, also for the first time since 2022. While core PCE inflation (the Fed's preferred measure) came out as expected for February, 0.3% m/m price increase is still too much, and the January number was revised up to 0.5% m/m. All in all, the data does not support an early rate cut. Fed Chair Jerome Powell, among others, signalled over Easter that the direction of interest rates is still down, but that the strong data allows for waiting in order to gain more confidence about declining inflation before moving. The market is now pricing almost no chance of a May rate cut, instead looking for June. Key data to watch will be the jobs report later today (Friday) and March CPI on Wednesday next week.
In the euro area, inflation in March was slightly lower than expected, with the core price measure increasing 2.9% y/y. According to the ECB, that corresponds to a bit more than 0.2% m/m, so still to the high side in terms of reaching the 2% annual inflation target, especially as service inflation is 0.4% m/m. In other words, the concern remains that a tight labour market and high wage growth will keep inflation running. The euro area unemployment rate was 6.5% in February, and since earlier data was revised, that still means a record low. Euro area PMIs for March point to economic growth for the first time since May last year.
None of this will likely have changed the quite clearly communicated view from the ECB that there will be no rate change at next week's meeting but that a rate cut in June is to be expected. This means that the meeting on Thursday is unlikely to be a major market mover. We expect the ECB to restate the outlook for a June cut provided that the disinflation process continues, and to clarify that it is a 25bp rate cut and not 50bp, as some market participants have been speculating lately. We do not expect them to give strong guidance as to what will happen after June.
The 2023 budget deficit in France was 5.5% of GDP, significantly higher than expected, drawing negative comments from rating agency Moody's. S&P already has France on negative outlook and there is clearly risk of a downgrade.
Not only US manufacturers reported progress in March. In China, manufacturing PMIs also rose and especially the official version delivered a strong positive surprise. The manufacturing upswing is supporting commodity prices which are generally rising, not least the oil price which is also affected by the conflicts in the Middle East and the war between Russia and Ukraine. However, we are starting to see signs that the manufacturing sector has stopped improving, for example in export data from Asian countries that are usually leading indicators. This includes Japan where the Tankan business survey showed weaker (but still strong) manufacturing - but also the best sentiment among large non-manufacturers since the early 1990s.
Strong NFP Could Deepen Correction in Stocks & Support Dollar
The monthly jobs report has enough potential for the market to set the trend for the coming weeks. However, there is also a risk that the extensive list of indicators, from employment change and unemployment rate to the pace of wage growth, will feed both the dove and hawk camps.
In our view, the slowdown in US job creation is unlikely to be a game changer. Perhaps the only thing that could affect the markets would be a drop in employment. But this would be an unexpected turn of events, as the preliminary figures are more likely to show growth above the expected 200-210k for March.
Much more volatility is likely to come from the wage growth rate. The recent increase in the minimum wage and ADP’s announcement of a 5% acceleration in wage growth make the release cautious.
An acceleration in wage growth could negatively impact risk demand in two ways. Firstly, it will dramatically increase the chances that the Fed will push back even further on plans to start cutting rates and reduce the expected number of cuts this year. That’s good news for the dollar but bad news for the stock market, much of whose rally was based on easing forecasts.
Second, wage increases and staff build-ups translate into higher costs and drag down profits. And that’s bad news for stocks.
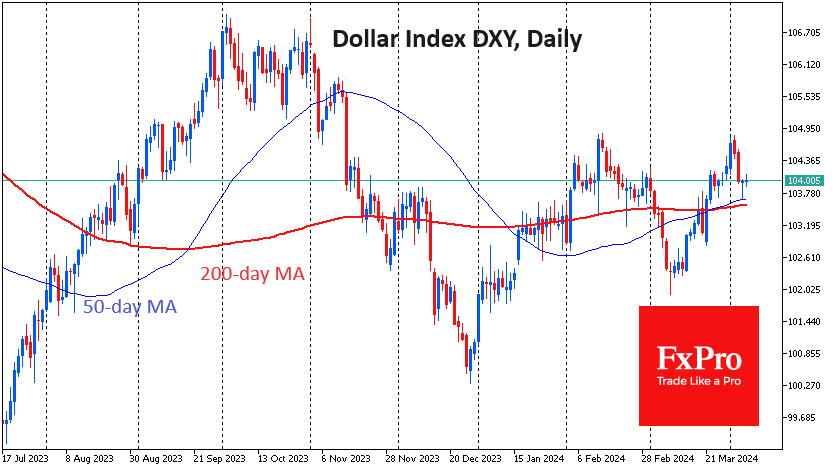
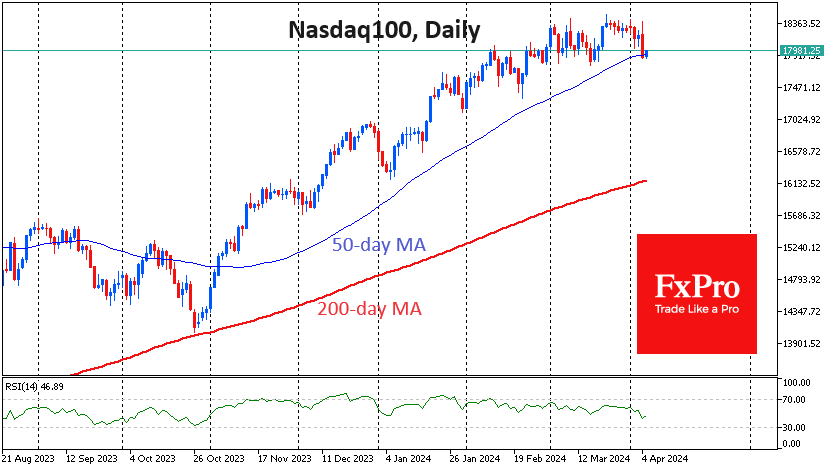
It could be a verdict for key US indices, which have been clinging to the lower boundary of the uptrend of recent months after Thursday’s sell-off. A failure under the 50-day average promises to accelerate the sell-off in equities, putting the 200-day as the bears’ next target. For the Nasdaq100 index, this opens up the potential for a 10% decline, while the Dow Jones 30 could fall 6.7%. News positive for the dollar has a chance to breathe new life into the DXY rally, which started on last month’s NFP but lost momentum at the start of April.
However, it is well worth being prepared for a continuation of the trend towards more moderate wage growth at a rate of job creation just below 200k per month, which is in line with the long-term trend of healthy economic expansion.
We also can’t rule out cooling surprises in wages. In theory, this would be a major relief for the stock market, which would have a chance to cling to established growth trends and return to storming highs in the next couple of weeks. In such an outcome, the Dollar Index may pull back from the current 104 below 103.5 and then head towards 102.3, the area of the lows of the last three months.
Sunset Market Commentary
Markets
Today’s countdown towards the March payrolls fortunately wasn’t in vain. Job gains printed at a stellar 303k, surging past the 214k consensus, the 232k whisper number and the 290k high-end of analyst estimates. The two-month revision brought an additional 22k jobs. Gains were broad-based but sectors showing the biggest rise include health & social assistance (81k), leisure & hospitality (49k) as well as construction (39k). The government added another 71k. The household survey recently diverged strongly from the afore-mentioned establishment survey job growth - an anomaly some say is related to immigration which isn’t (enough) accounted for in the Census Bureau population estimate. This time around, though, the former caught up with a whopping 498k, confronting those who saw the recent weak readings as early warnings. That same questionnaire also showed the unemployment rate easing back to 3.8% from 3.9%, despite a bigger-than-expected increase in the participation rate from 62.5% to 62.7%. Wage growth picked up as expected from 0.1% m/m to 0.3% to be 4.1% higher compared to March of last year. It’s a strong labour market on all accounts and in any case not the kind that validates quicker rate cuts by the Fed. Powell suggested this could happen if the labour market were to deteriorate suddenly and sharply. Markets react accordingly with US yields spiking 7-8.4 bps higher across the spectrum before paring gains a bit. The short (e.g. 2-y) and the long (e.g. 10-y) end revisit the resistance/YtD (closing) levels they turned away from in recent days, a.o. on a softer services ISM. We don’t expect a break higher just yet ahead of next week’s US CPIs but it looks as if the tiniest upside surprise might just do the trick. Given the low comparison base, especially for the headline number (0.1% m/m in March 2023), inflation is bound to reaccelerate in y/y terms (expected at 3.5%). After today’s data, markets have become less certain on the three rate cuts the dot plot has pencilled in (88% vs near-100% yesterday).
The US labour market report woke the dollar from it’s intraday lull. EUR/USD fell with 1.08 fighting for survival ahead of the weekend. The trade-weighted index bounces to 104.68 but remains south of this week’s high around the 105 big figure. The JPY erased all earlier (and to be honest unconvincing) gains following BoJ governor Ueda’s hint on a second rate hike in 2024H2. USD/JPY trades back into familiar territory at 151.65. Sterling hasn’t drawn any headlines recently but EUR/GBP has been creeping stealth-like higher all week. The pair is currently attacking recent closing highs around 0.8578.
News & Views
After seven months of decline, the UN’s Food and Agriculture Organization’s (FAO) food price index ticked up in March (+1.1% M/M but still -7.7% Y/Y), mostly driven by higher world vegetable oil prices (+8% M/M). Vegetable oil prices reached a one-year high reflecting higher price quotations across palm (seasonally lower outputs and firm demand in Southeast Asia), soy (robust demand from biofuel sector), sunflower and rapeseed oils. Higher crude oil prices also contributed. Dairy prices rose by 2.9% M/M, marking the sixth consecutive monthly increase. Meat prices increased by 1.7%. Cereal prices are down 2.6% M/M and 20% Y/Y. Ample wheat supply and cancelled purchases from China put downward pressure together with favorable crop forecasts. Sugar prices fell 5.4% M/M, mainly because of an upward revision to the 2023/24 sugar production forecast in India and the improved pace of harvest in Thailand. Persisting concerns over the crop in Brazil limit the price decline.
• March Canadian payrolls disappointed. Net job growth fell by 2.2k, while consensus expected an increase by 25k. Details showed marginal job shedding in both full time and part time jobs. The unemployment rate rose from 5.8% to 6.1% with an unchanged participation rate of 65.3%. There were fewer people employed in accommodation and food services (-27k), wholesale and retail trade (-23k) and professional, scientific and technical services (-20k). Employment increased in four industries, led by health care and social assistance (+40k). Total hours worked in March were virtually unchanged but up 0.7% Y/Y. Average hourly wages among employees rose 5.1% Y/Y. USD/CAD rises to a new YTD high (1.3630) on a combination of USD strength and CAD weakness.
EUR/USD Mid-Day Outlook
Daily Pivots: (S1) 1.0821; (P) 1.0849; (R1) 1.0866; More...
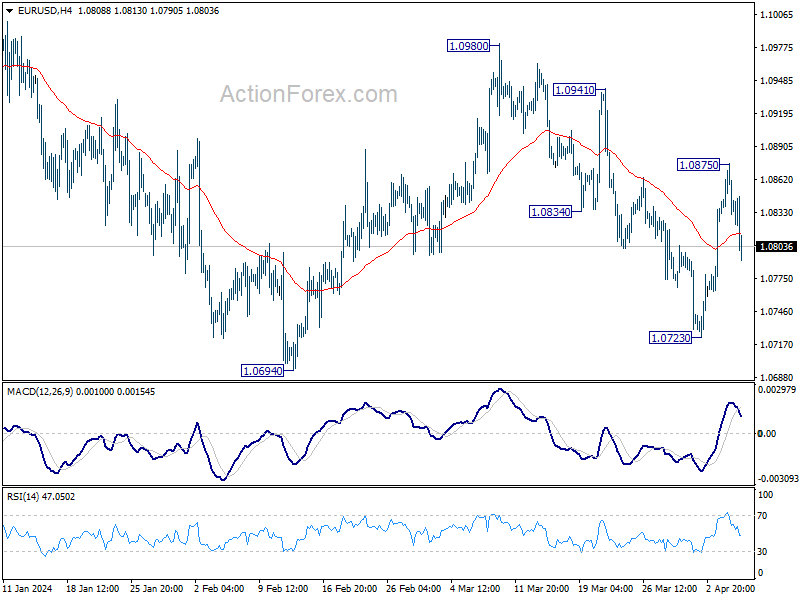
Intraday bias in EUR/USD is back on the downside with break of 55 4H EMA (now at 1.0814). Deeper fall would be seen to retest 1.0694/0723 support zone On the upside, break of 1.0875 will resume the rebound from 1.0723 towards 1.0980 resistance instead.
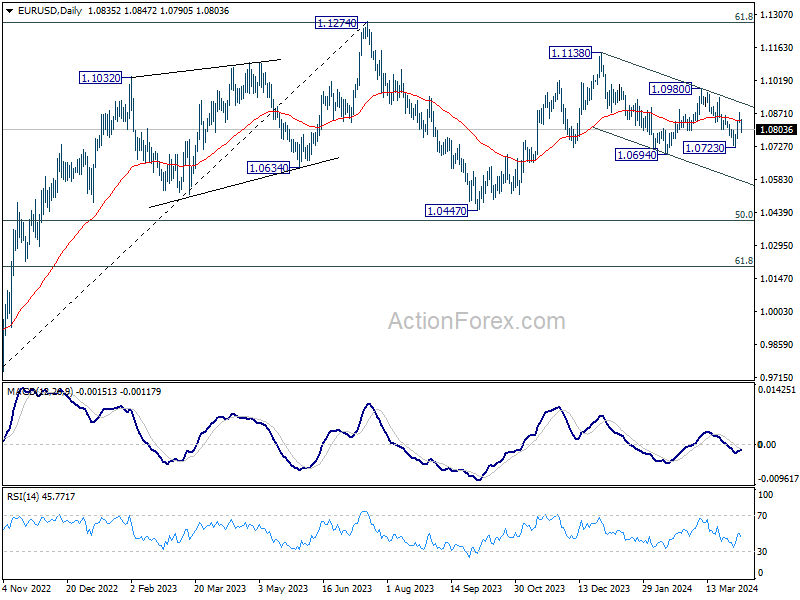
In the bigger picture, price actions from 1.1274 are viewed as a corrective pattern to rise from 0.9534 (2022 low). Rise from 1.0447 is seen as the second leg. While further rally could cannot be ruled out, upside should be limited by 1.1274 to bring the third leg of the pattern. Meanwhile, sustained break of 1.0694 support will argue that the third leg has already started for 1.0447 and possibly below.
GBP/USD Mid-Day Outlook
Daily Pivots: (S1) 1.2624; (P) 1.2654; (R1) 1.2673; More...
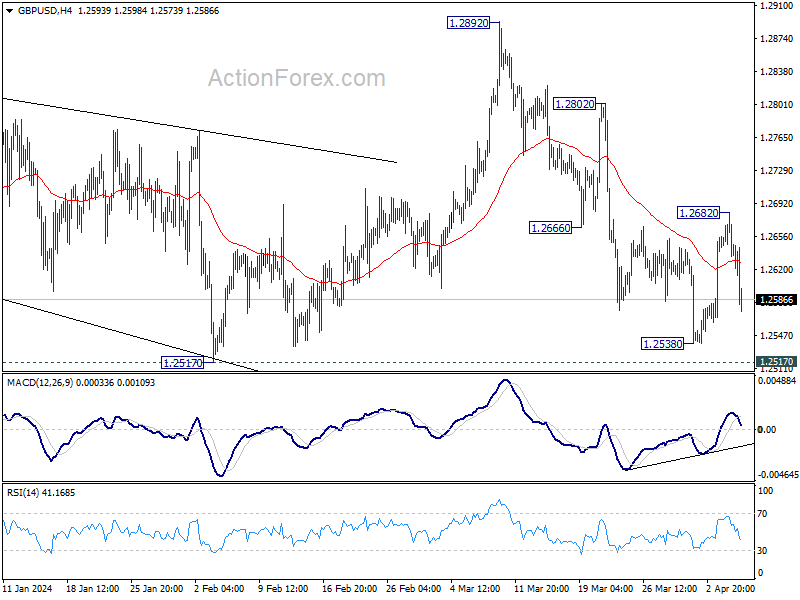
Intraday bias in GBP/USD remains mildly on the downside for 1.2517/38 support zone. Decisive break there will suggest that rise from 1.2036 has completed at 1.2892 already, and turn near term outlook bearish. On the upside, however, firm break of 1.2682 will suggest that fall from 1.2892 has completed at 1.2538. Intraday bias will be turned back to the upside for 1.2802 resistance next.
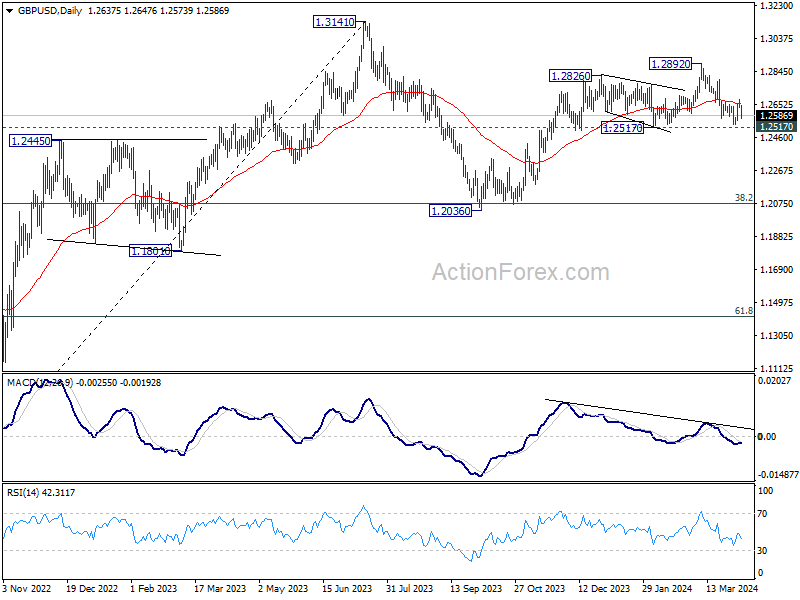
In the bigger picture, price actions from 1.3141 medium term top are seen as a corrective pattern to up trend from 1.0351 (2022 low). Rise from 1.2036 is seen as the second leg, which might still be in progress. But upside should be limited by 1.3141 to bring the third leg of the pattern. Meanwhile, break of 1.2517 support will argue that the third leg has already started for 38.2% retracement of 1.0351 (2022 low) to 1.3141 at 1.2075 again.
USD/CHF Mid-Day Outlook
Daily Pivots: (S1) 0.8989; (P) 0.9033; (R1) 0.9057; More....
Intraday bias in USD/CHF remains neutral and outlook is unchanged. On the downside, firm break of 55 4H EMA (now at 0.9018) will bring deeper pullback. But downside should be contained by 0.8884 resistance turned support to bring rebound. On the upside, break of 0.9094 will resume larger rise from 0.8332 to 0.9243 key resistance.
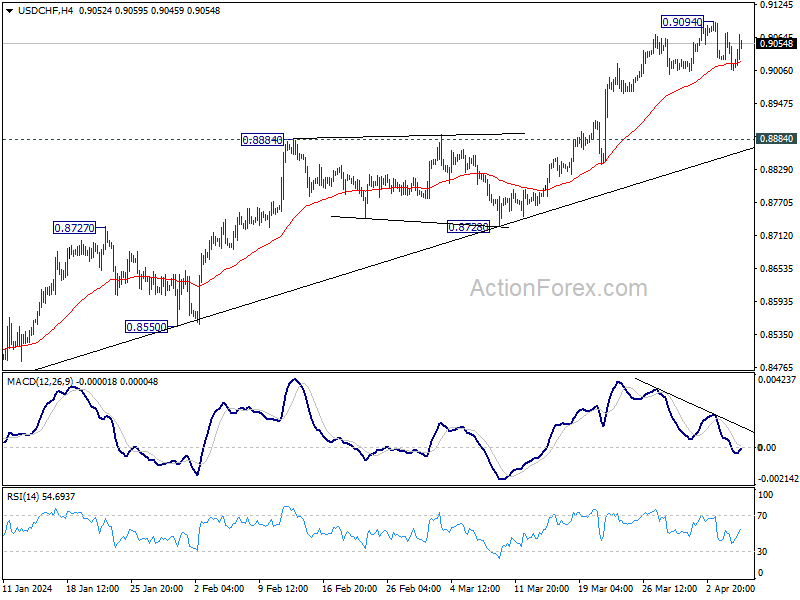
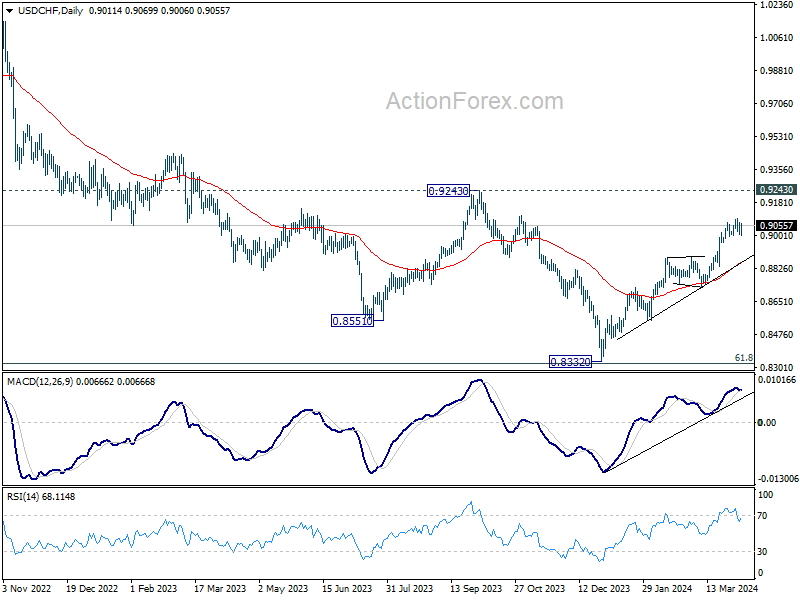
In the bigger picture, price actions from 0.8332 medium term bottom as tentatively seen as developing into a corrective pattern to the down trend from 1.0146 (2022 high). Further rise would be seen as long as 0.8728 support holds. But upside should be limited by 0.9243 resistance, at least on first attempt.