Sample Category Title
Canadian Dollar Edges Lower Ahead of Canadian, US Job Reports
The Canadian dollar is slightly lower on Friday. In the European session, USD/CAD is trading at 1.3559, up 0.12%.
Canada and the US will both release employment data later today, which could mean some volatility from USD/CAD in the North American session.
Employment in Canada is expected to drop to 25,000 in March, a significant decline from the February gain of 40,700. The labour market remains in good shape but Canada’s rapid population growth has pushed the unemployment rate higher. The unemployment rate rose to 5.8% in February, up from 5.7% a month earlier and is expected to rise again to 5.9% in March.
US nonfarm payrolls expected to slip
The markets are bracing for a sharp drop in US nonfarm payrolls for March. Job growth hit 353,000 in January, but then fell to 275,000 in February and the market estimate for March stands at 200,000. The labour market has stood up well in the face of elevated interest rates but another decline in the March data would indicate a clear downtrend in job growth, which would support the Federal Reserve deciding to lower interest rates sooner rather than later.
All eyes are on the Fed in anticipation of a rate cut later this year, but the Fed’s message this week has not been uniform. Fed Chair Jerome Powell said that although inflation has been bumpy, he expected the Fed to lower rates “at some point this year”. Cleveland Fed President Loretta Mester echoed this position, saying that the Fed was becoming more confident that it could lower rates in the next few months.
Contrast that stance with that of Minneapolis Fed President Neel Kashkari, who questioned if rate cuts were needed this year “if we continue to see inflation moving sideways”. Kashkari does not have a vote on monetary policy but his comments indicate that a rate cut is not a done deal and will depend on the data, in particular inflation.
USD/CAD Technical
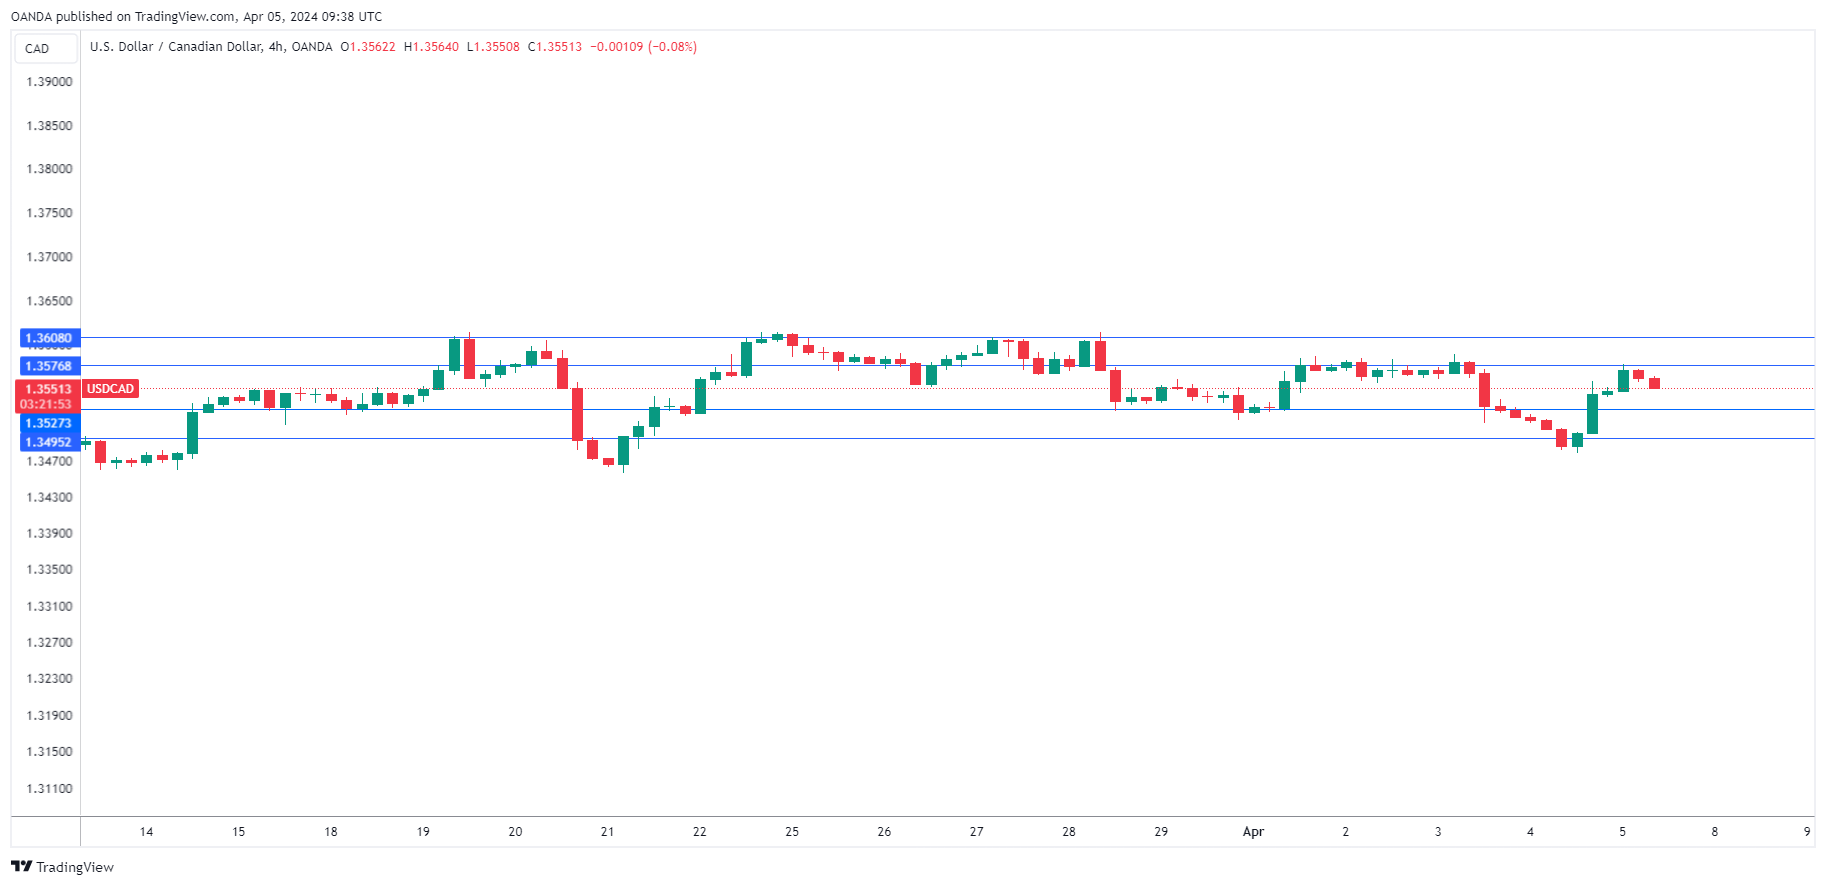
- USD/CAD tested resistance at 1.3576 earlier. Then next resistance line is 1.3608
- 1.3527 and 1.3495 are providing support
BTC/USD Analysis: Bearish Arguments Become More Convincing
On March 18, we wrote about the activation of bears near the USD 70,000 level and the likelihood of consolidation forming near this psychological mark.
On March 25, we wrote that anxiety remains in the Bitcoin market.
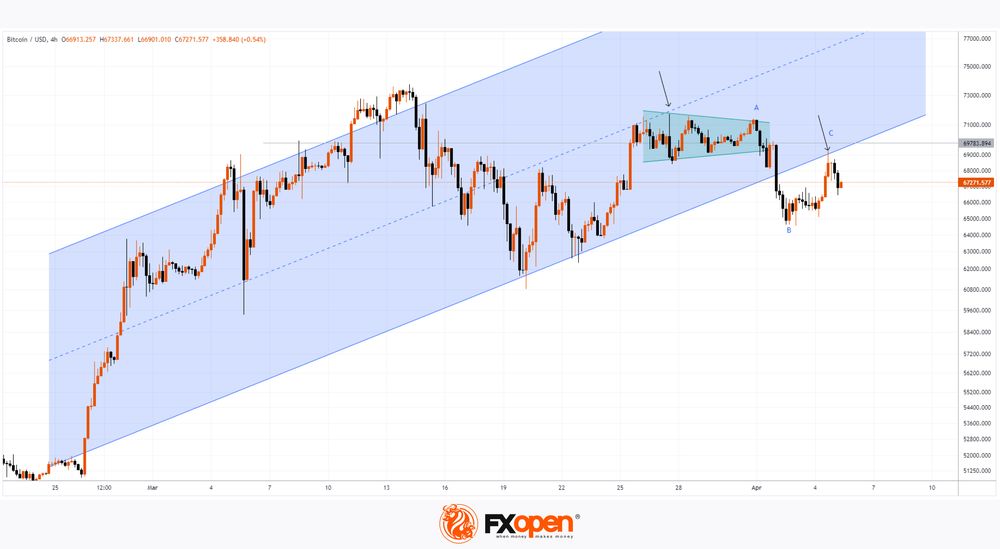
Technical analysis of the BTC/USD chart with new data on the behavior of Bitcoin prices today relative to the previously designated levels and lines shows that bearish arguments are becoming more convincing:
→ the median line of the ascending channel acted as resistance (shown by the first arrow);
→ the price has formed a consolidation zone (shown in green) with a subsequent bearish exit from it;
→ after a bearish breakdown of the lower border of the ascending channel, it showed signs of resistance (shown by the second arrow);
→ the increase in B→C is about 50% of the decrease in A→B, which corresponds to the proportion of the normal intermediate recovery within the dominant bearish trend.
Attempts to reach the level of USD 70k for Bitcoin in April were unsuccessful. The inability of the cryptocurrency price to demonstrate bullish dynamics is alarming due to the approaching halving, which is considered a positive factor influencing the price of Bitcoin.
It is possible that further developments will provide more turning points for building a downward channel.
FXOpen offers the world's most popular cryptocurrency CFDs*, including Bitcoin and Ethereum. Floating spreads, 1:2 leverage — at your service. Open your trading account now or learn more about crypto CFD trading with FXOpen.
*At FXOpen UK and FXOpen AU, Cryptocurrency CFDs are only available for trading by those clients categorised as Professional clients under FCA Rules and Professional clients under ASIC Rules respectively. They are not available for trading by Retail clients.
This article represents the opinion of the Companies operating under the FXOpen brand only. It is not to be construed as an offer, solicitation, or recommendation with respect to products and services provided by the Companies operating under the FXOpen brand, nor is it to be considered financial advice.
AUD Takes a Pause After Rally
After three days of significant gains, the Australian dollar is retreating against its American counterpart, with the AUD/USD pair falling to 0.6573.
The US dollar has rebounded after Federal Reserve officials expressed doubts about an immediate monetary policy easing. The discussion around interest rates and the timing of their reduction has become a central topic in the market. Signals that the Fed is prepared to cut rates three times this year, making borrowing costs more affordable, have put pressure on the US dollar, allowing other currencies to recover. However, signs that the Federal Reserve is still awaiting more data before deciding have led to a rebound in the USD and a decline in overall market sentiment.
Australia's statistical data revealed that import volumes grew by 4.8% month-over-month in February, compared to a previous increase of 1.4%. Export volumes decreased by 2.2% month-over-month, with January's figure at 1.5%. The positive trade balance in February was the lowest in five months, primarily due to a drop in overseas shipments of iron ore.
For the third consecutive meeting, the Reserve Bank of Australia (RBA) has left the interest rate unchanged at 4.35% annually, its highest level in 12 years. Meanwhile, the RBA has omitted any mention of potential rate hikes from its comments, confident in reducing inflationary pressure. This has led to forecasts that borrowing costs in Australia may decrease later this year.
Technical analysis of AUD/USD
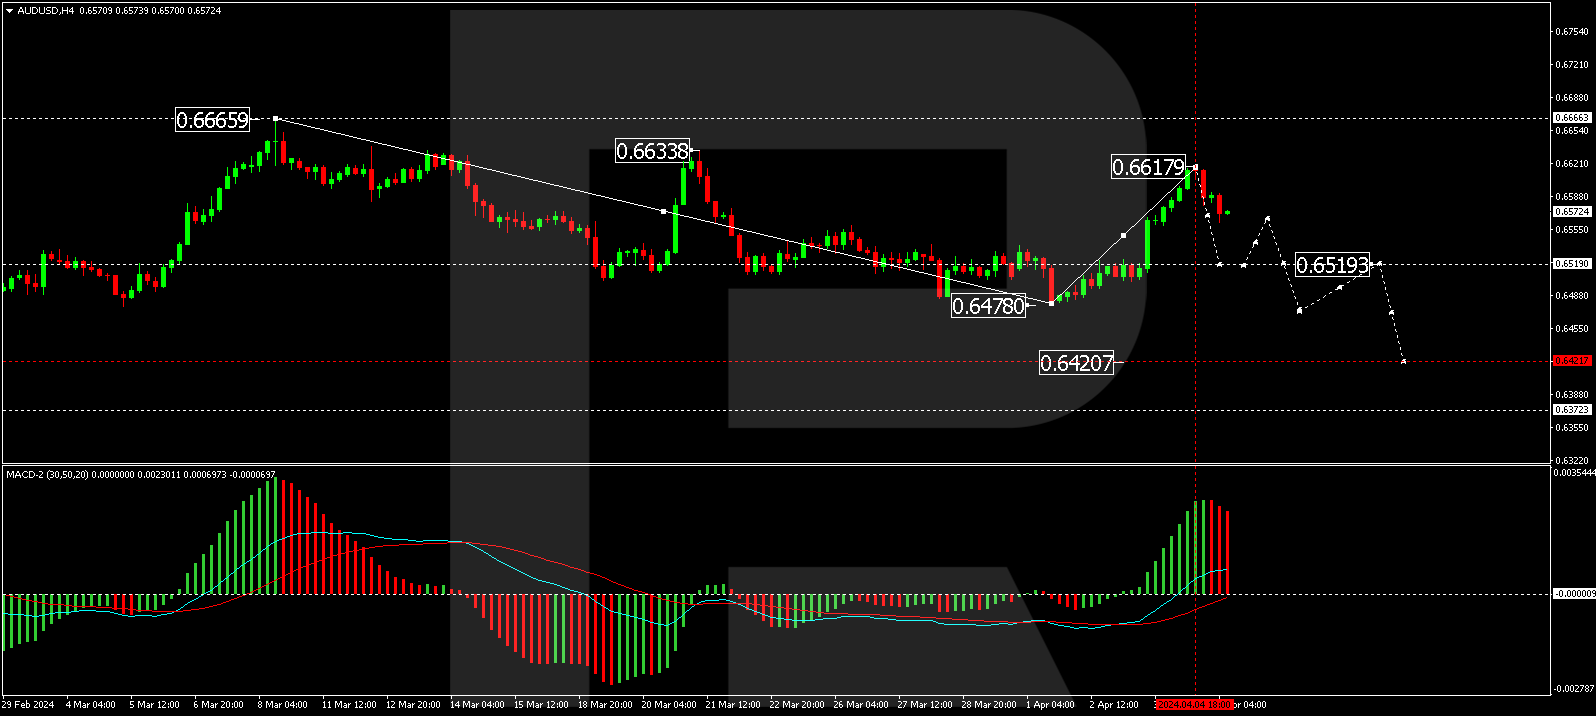
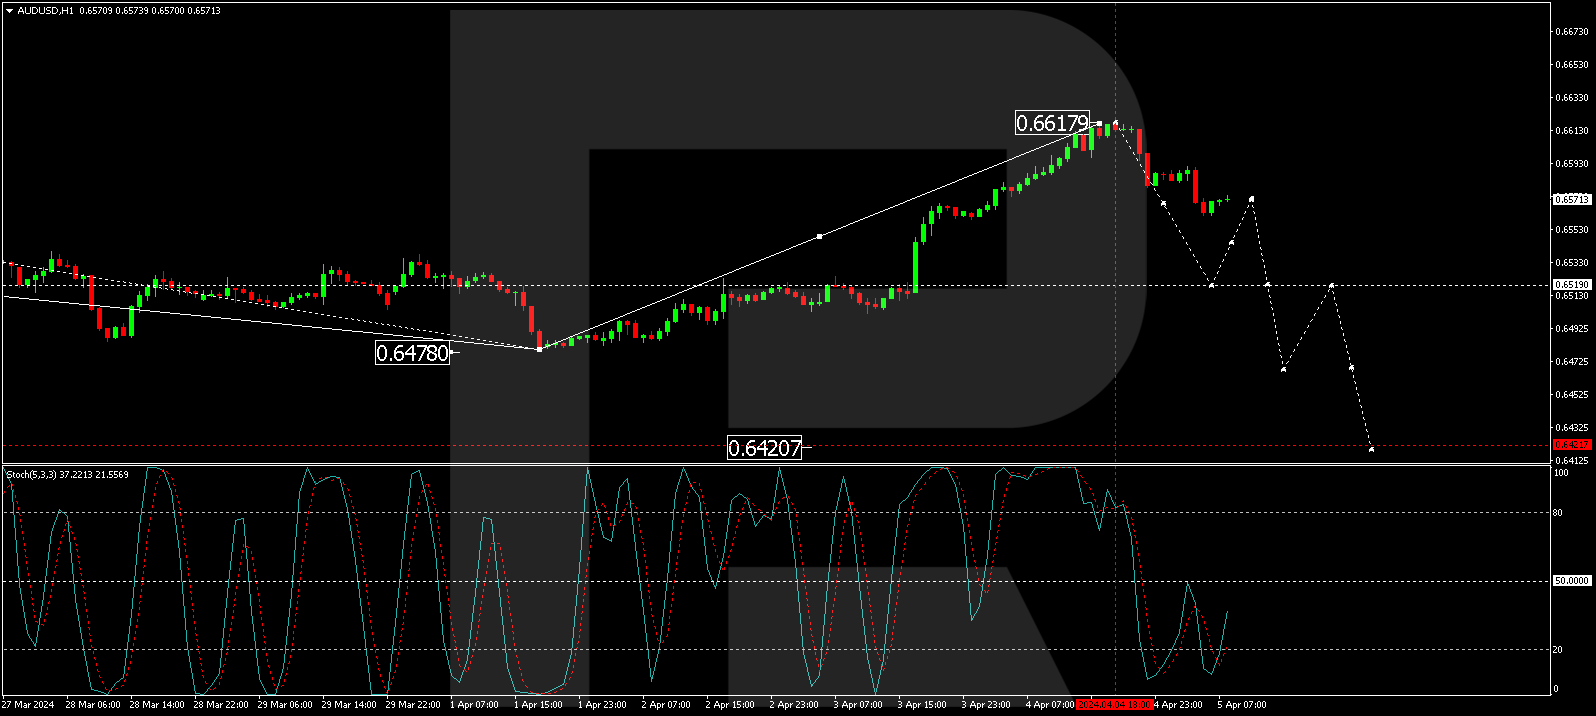
On the H4 chart of AUD/USD, a downward wave to 0.6480 and a correction to 0.6617 have been completed. We expect the start of a new decline to 0.6422. The first structure of the decline is forming today, targeting 0.6520. After completing this, we anticipate a consolidation range. Exiting this range downward could lead to a wave towards 0.6472, potentially extending the trend down to 0.6422. The MACD indicator, with its signal line below zero, supports this scenario, expecting new lows.
On the H1 chart of AUD/USD, a downward wave structure to 0.6520 is forming. Following this, a correction to 0.6572 is anticipated, and a decline to 0.6490, with the trend continuing to 0.6422, is expected. The Stochastic oscillator, with its signal line currently below 20 but poised to rise to 50, technically supports this scenario.
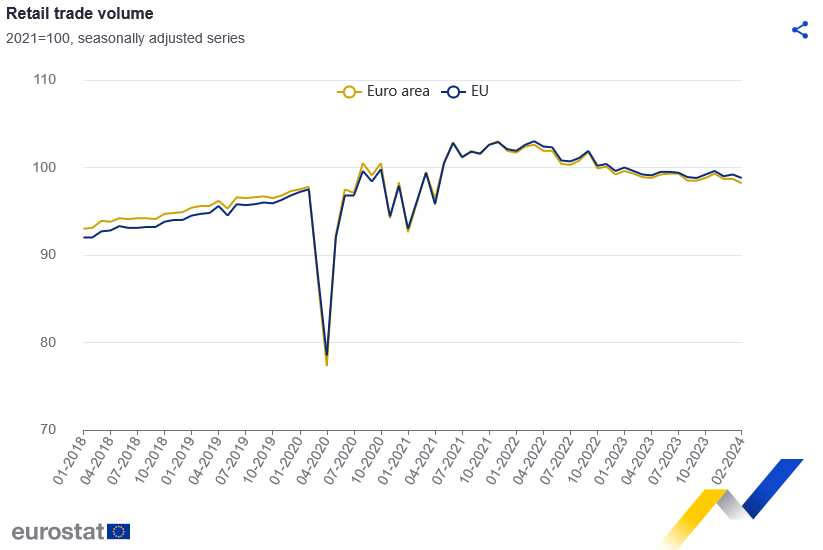
Eurozone retail sales falls -0.5% mom in Feb, EU down -0.4% mom
Eurozone retail sales volume fell -0.5% mom in February, worse than expectation of -0.3% mom. Volume of retail trade decreased for food, drinks, tobacco by -0.4% mom, non-food products (except automotive fuel) by -0.2% mom, automotive fuel in specialised stores by -1.4% mom.
EU retail sales fell volume -0.4% mom. Among Member States for which data are available, the largest monthly decreases in the total retail trade volume were recorded in Germany (-1.9%), Belgium (-1.8%) and Cyprus (-1.1%). The highest increases were observed in Poland (+1.4%), Croatia (+1.2%) and Estonia (+1.0%).
GBPJPY Trades Lower Ahead of Key Market Events
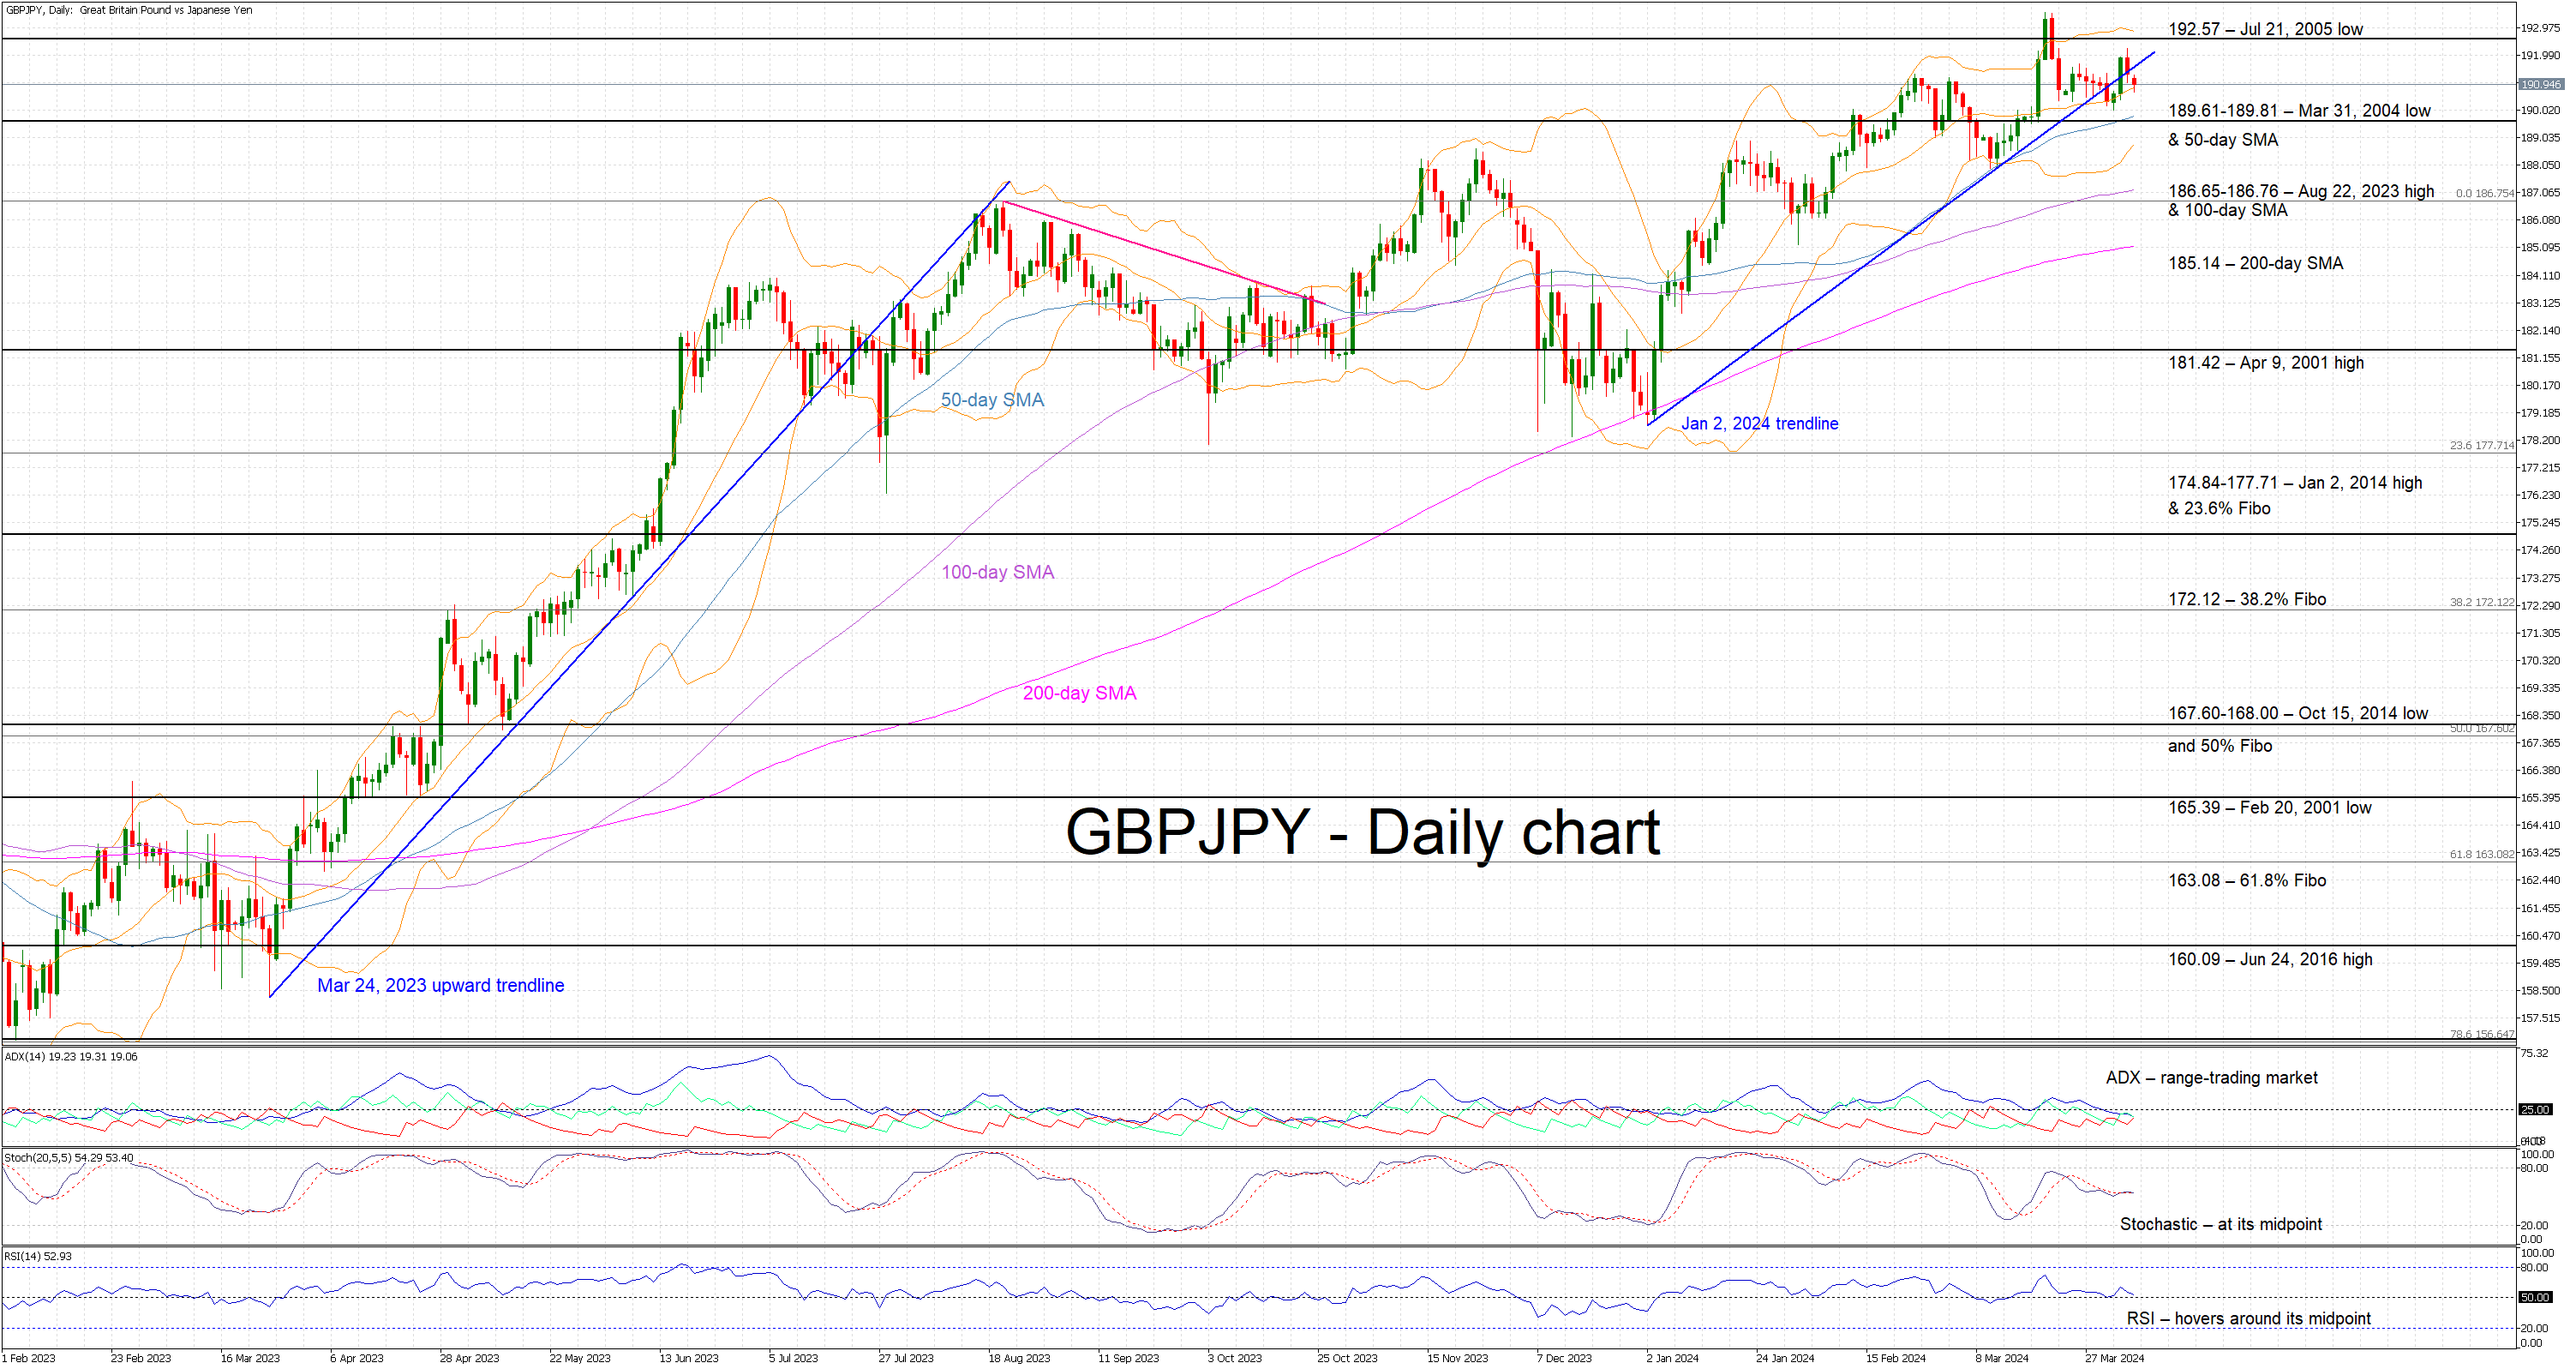
- GBPJPY is in the red again today, not far from its recent high
- It has dropped below the January 2, 2024 ascending trendline
- Momentum indicators are in waiting mode for the next key market events
GBPJPY is trading lower again today as the market is preparing for today’s US labour market report, which could play a key role in the Fed’s outlook. The move from the January 2, 2024 low has been aggressive despite the recent BoJ rate hike but the threat of intervention appears to have already borne fruit. However, the Japanese officials’ resolve could be really tested if another strong rally takes place soon.
In the meantime, the momentum indicators are clearly directionless and trendless. More specifically, the Average Directional Movement Index (ADX) remains stuck below its 25-threshold, signaling a range-trading market. Similarly, the RSI continues to hover around 50, confirming the current indecisiveness of market participants. More importantly, the stochastic oscillator is trading around its midpoint, pointing to a delicate balance in GBPJPY.
Should the bulls remain confident, they could try to lead GBPJPY back above the January 2, 2024 ascending trendline and test the resistance set by the July 21, 2005 low at 192.57. They could then have the chance to record a new 2024 high, above the current 193.52 high, with the next plausible target being in the 195.00 area.
On the other hand, the bears are desperate to regain market control and gradually push GBPJPY towards the 189.61-189.81 area, which is populated by the March 31, 2004 low and the 50-day simple moving average (SMA). If successful, they could then have a go at testing the support set by the busy 186.65-186.76 range that is defined by the August 22, 2023 high and the 100-day SMA.
To sum up, market participants are mostly on the sidelines ahead of the certain key market events with the GBPJPY bulls also trying to avoid further provoking the Japanese authorities.
USDCAD Ticks Higher Within Ascending Channel
- USDCAD bounces off 200-day SMA
- MACD and RSI are still weak
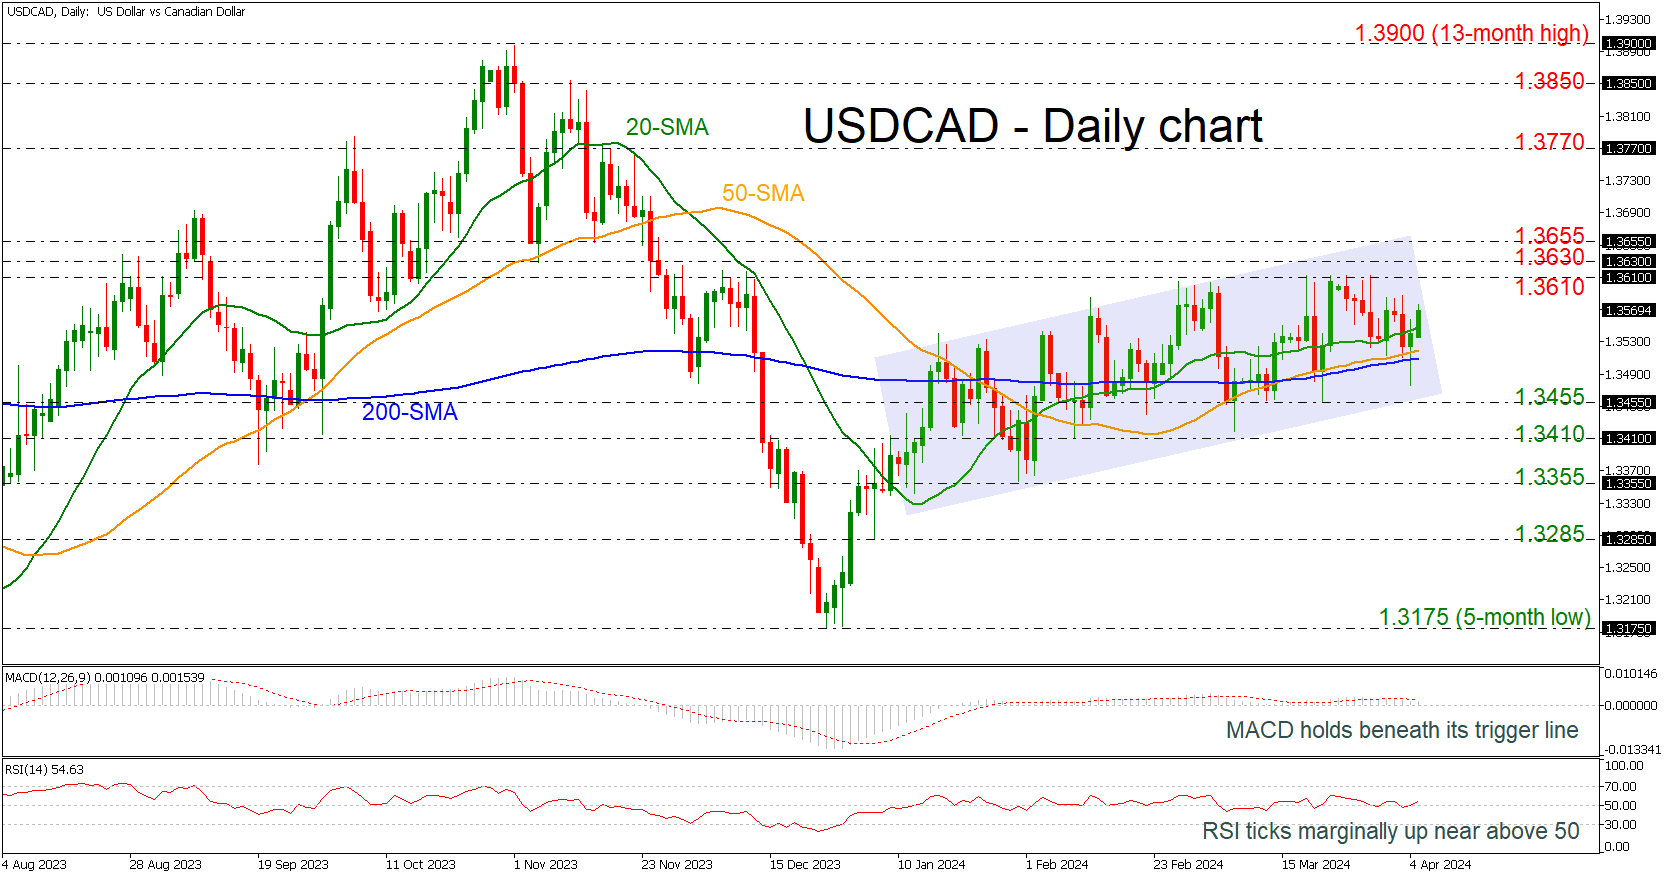
USDCAD is moving slightly higher following the rebound off the simple moving averages (SMAs), remaining within a short-term ascending channel.
Technically, the MACD oscillator is holding beneath its trigger line and near the zero level, weakening its momentum, while the RSI is pointing marginally up above the neutral threshold of 50.
If the market extends its advance higher, then the restrictive region within 1.3610-1.3655 could halt bullish actions. However, a successful climb higher could endorse the bullish outlook, meeting the 1.3770 resistance, taken from the peak on November 16.
On the other hand, if the bears take control and slip beneath the 200-day SMA the pair could pause its downward move at 1.3455 ahead of 1.3410. A decline below the five-month low of 1.3175 could also switch the bias to a bearish one.
To conclude, USDCAD has been in a steady upward movement since January 9 but needs more of a boost to have a clear bullish trend.
GBP/JPY Daily Outlook
Daily Pivots: (S1) 190.82; (P) 191.54; (R1) 192.05; More.....
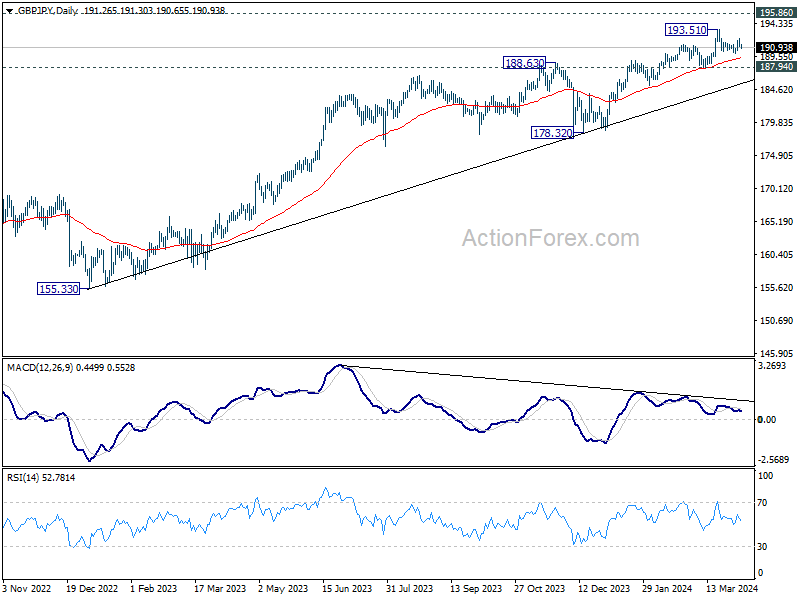
GBP/JPY retreated after brief rebound and intraday bias remains is turned neutral again. . For now, further rally is expected as long as 190.02 support holds, in case of retreat. Break of 193.51 will resume larger up trend.
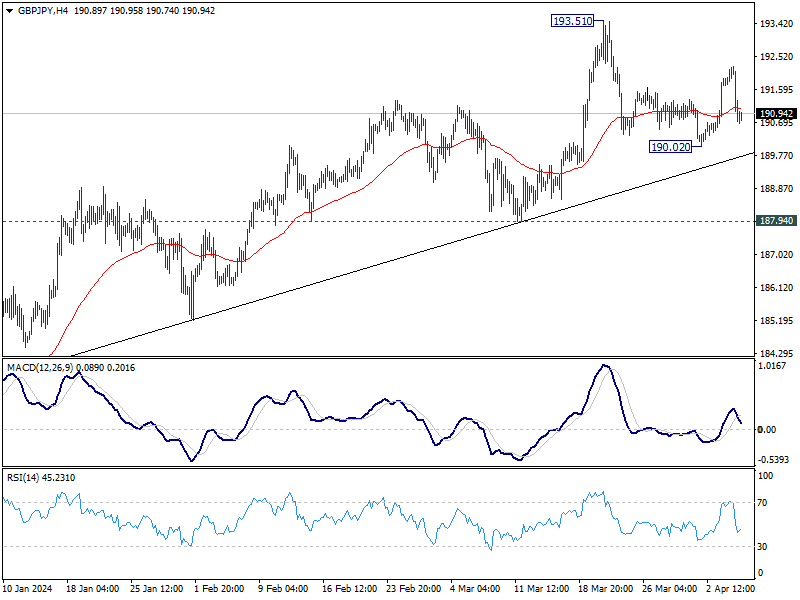
In the bigger picture, current rally is part of the up trend from 123.94 (2020 low), and is in progress for long term resistance (2015 high). Break of 187.94 support is needed to be the first sign of medium term topping. Otherwise, outlook will remain bullish in case of retreat.
EUR/JPY Daily Outlook
Daily Pivots: (S1) 163.56; (P) 164.24; (R1) 164.69; More...
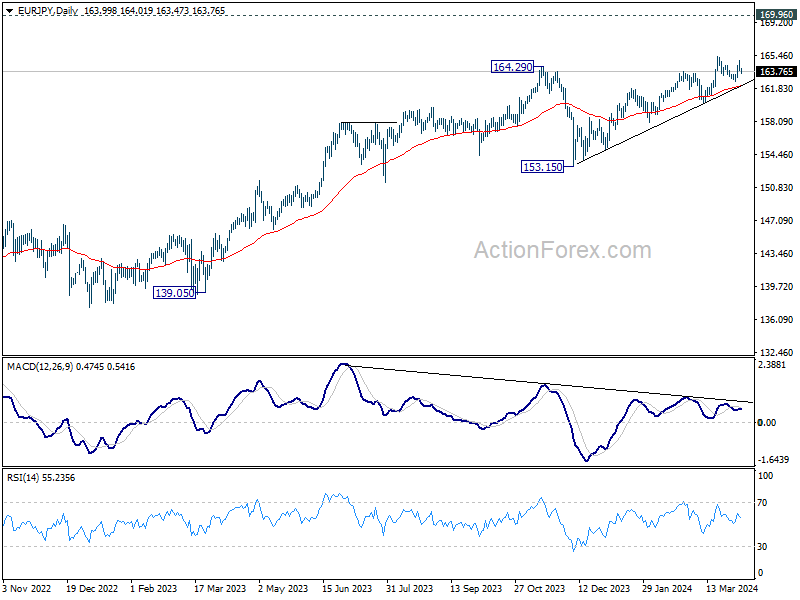
Intraday bias in EUR/JPY as turned neutral again as it retreated ahead of 165.33 resistance. Further rally will remain in favor as long as 162.59 support holds, in case of retreat. Break of 165.33 will resume larger up trend.
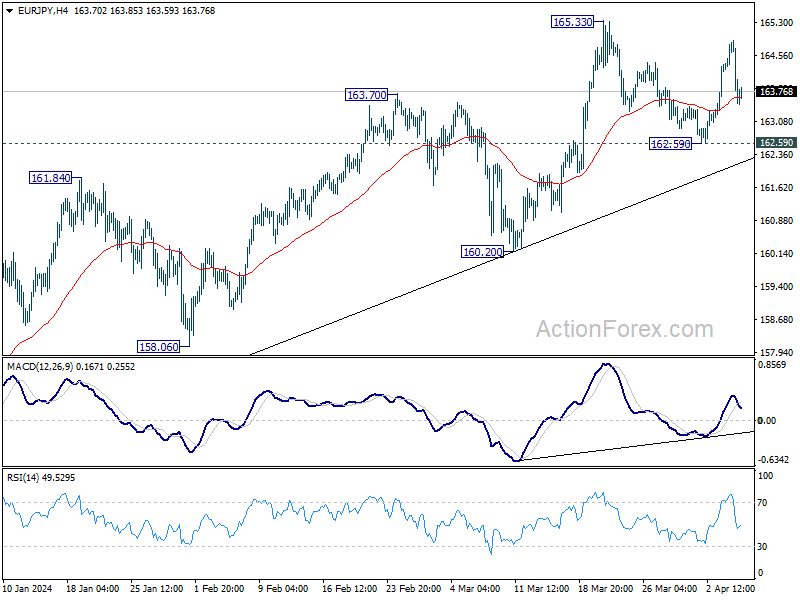
In the bigger picture, current rally is part of the up trend from 114.42 (2020 low), which is still in progress. Next target is 169.96 (2008 high). Break of 160.20 support is needed to be the first sign of medium term topping. Otherwise, outlook will stay bullish in case of retreat.
EUR/GBP Daily Outlook
Daily Pivots: (S1) 0.8562; (P) 0.8572; (R1) 0.8581; More...
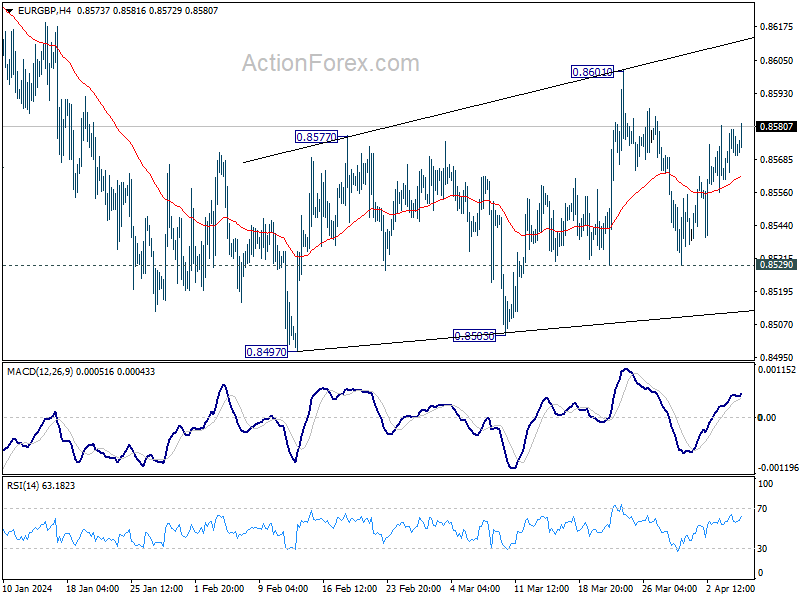
EUR/GBP is still bounded in range below 0.8601 and intraday bias remains neutral. On the downside, firm break of 0.8529 support will argue that the corrective recovery from 0.8497 has completed at 0.8601. Intraday bias will be back on the downside for retesting 0.8497 low next. On the upside, break of 0.8601 will resume the rebound instead.
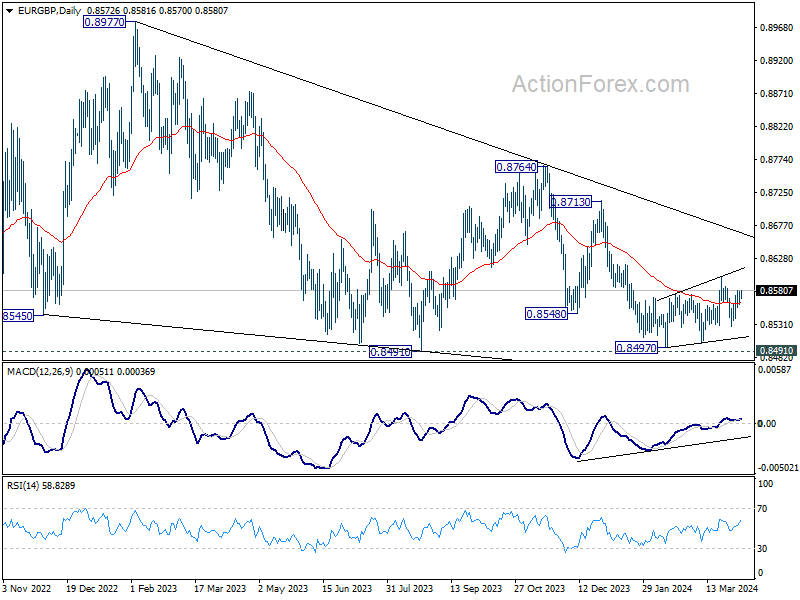
In the bigger picture, there is no clear sign that down trend from 0.9267 has completed, despite loss of downside momentum as seen in D MACD. As long as 0.8713 resistance holds, the down trend will remain in favor to resume through 0.8491 low at la later stage.
EUR/AUD Daily Outlook
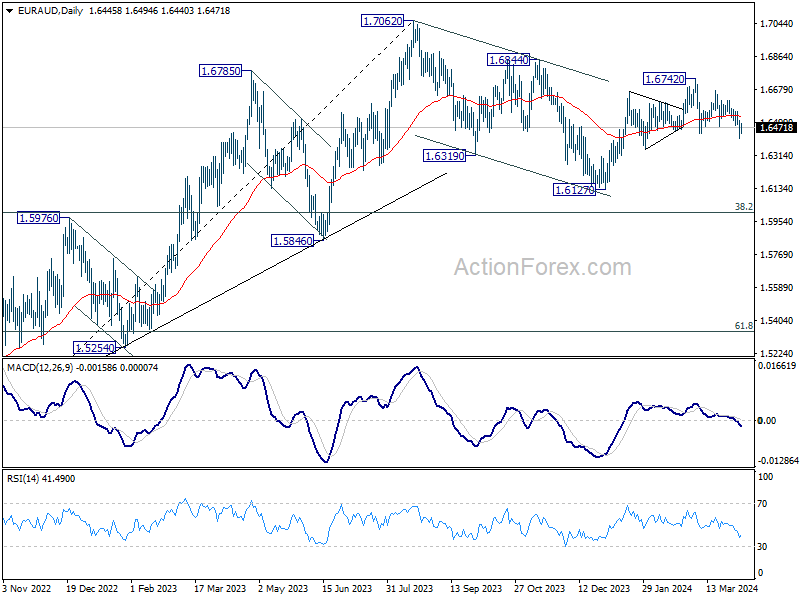
Daily Pivots: (S1) 1.6404; (P) 1.6460; (R1) 1.6506; More..
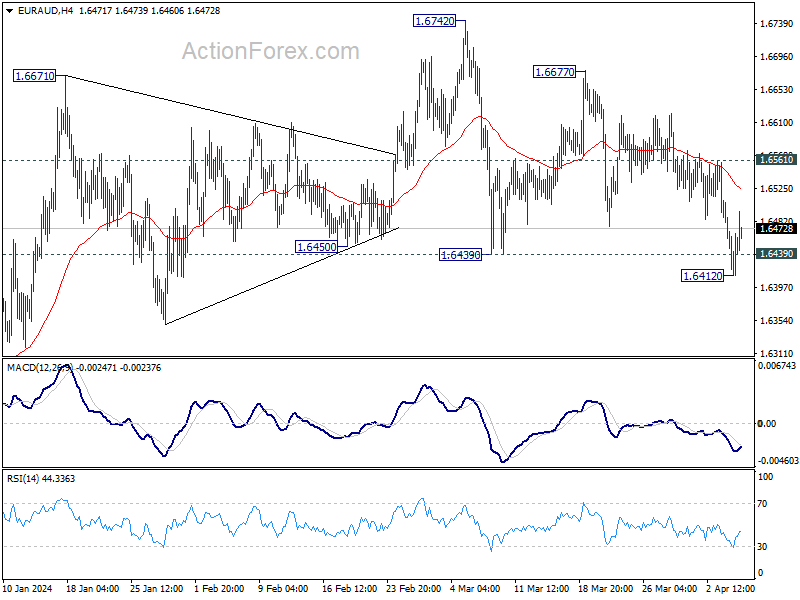
EUR/AUD recovered after dipping to 1.6412 briefly and intraday bias stays neutral. On the downside, break of 1.6412 and sustained trading below 1.6439 support will argue that whole rebound from 1.6127 has completed, and turn near term outlook bearish for this support again. Nevertheless, strong rebound from current level, followed by break of 1.6561 minor resistance, will turn bias back to the upside for retesting 1.6742.
In the bigger picture, fall from 1.7062 medium term top is seen as a correction to the up trend from 1.4281 (2022 low). Break of 1.6844 resistance will argue that this up trend is ready to resume through 1.7062 high. In case of another fall, strong support should be seen around 1.5846 and 38.2% retracement of 1.4281 to 1.7062 at 1.6000 to bring rebound.