Sample Category Title
EUR/CHF Daily Outlook
Daily Pivots: (S1) 0.9572; (P) 0.9588; (R1) 0.9597; More...
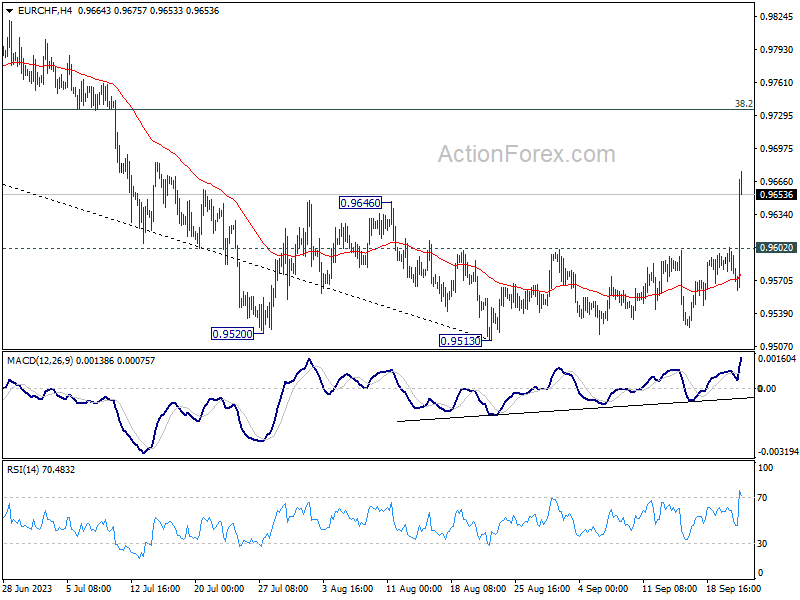
EUR/CHF's strong rally today and break of 0.9646 resistance confirms short term bottoming at 0.9513. Considering bullish convergence conditiom in D MACD, the down trend from 1.0095 might have completed too. Intraday bias is back on the upside for 38.2% retracement of 1.0095 to 0.9513 at 0.9735. Sustained break there will affirm this bullish case and target 61.8% retracement at 0.9873. On the downside, below 0.9602 minor support will turn intraday bias neutral first.
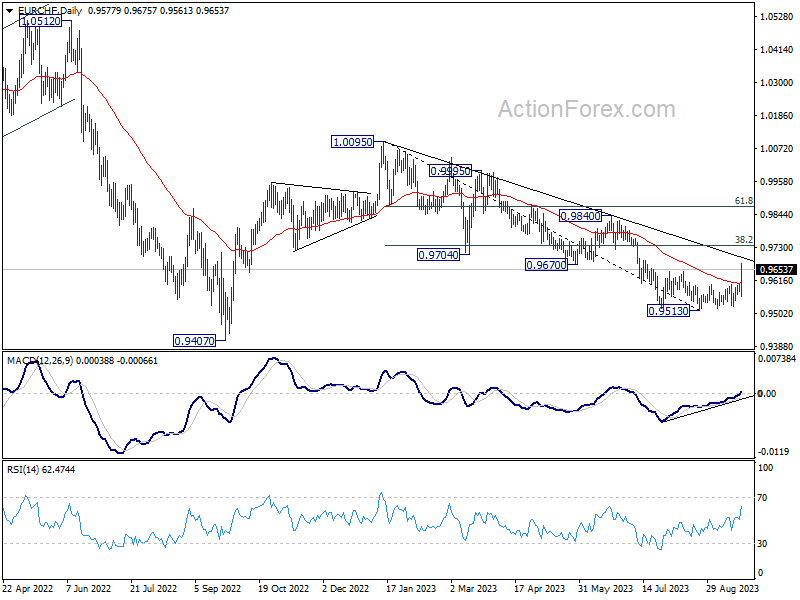
In the bigger picture, medium term outlook is staying bearish as the cross is capped well below falling 55 W EMA (now at 0.9804). Down trend from 1.2004 (2018 high) could still resume through 0.9407 (2022 low). However, sustained trading above the 55 W EMA will raise the chance that 0.9470 is already a long term bottom. Further rise would then be seen to 1.0095 resistance to confirm bullish trend reversal.
EUR/GBP Daily Outlook
Daily Pivots: (S1) 0.8615; (P) 0.8637; (R1) 0.8659; More....
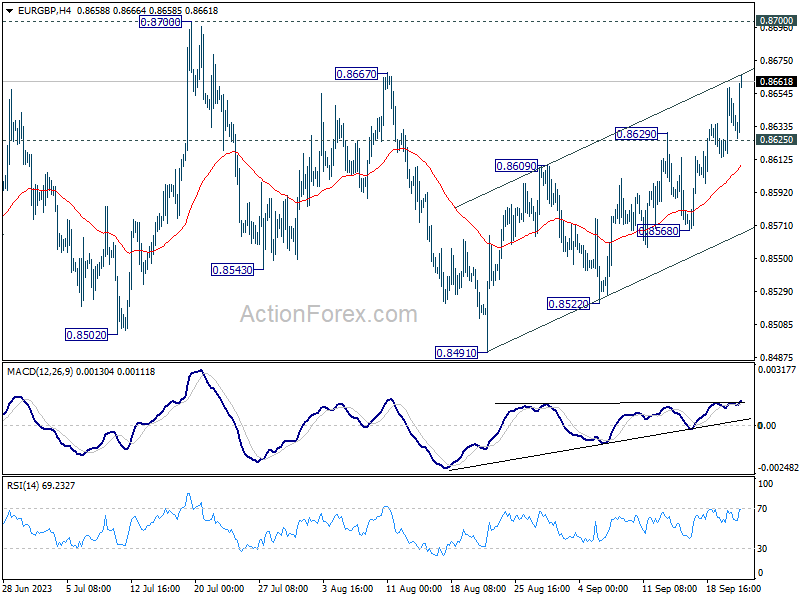
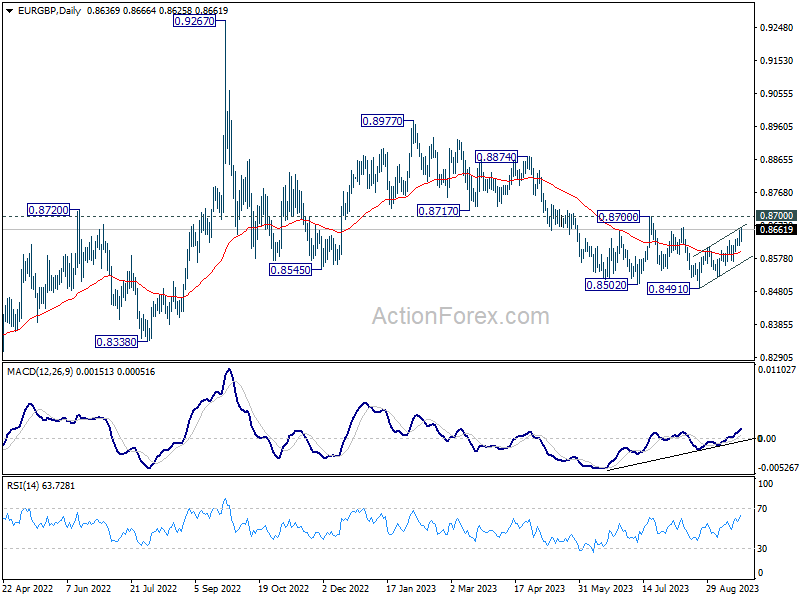
EUR/GBP's rise from 0.8491 is continuing today and intraday bias stays on the upside. As noted before, this rise is seen as the third leg of the corrective pattern from 0.8502. Upside should be limited by 0.8667/8700 resistance zone. On the downside, below 0.8625 minor support will turn intraday bias neutral first. Further break of 0.8568 support will turn bias back to the downside for retesting 0.8491 low.
In the bigger picture, the down trend from 0.9267 (2022 high) is seen as part of the long term range pattern from 0.9499 (2020 high). Fall from 0.8977 is seen as the third leg. As long as 0.8700 resistance holds, further decline is still expected. Break of 0.8491 will resume the fall towards 0.8201 (2022 low). Nevertheless, firm break of 0.8700 will now be a sign of bullish reversal.
EUR/AUD Daily Outlook
Daily Pivots: (S1) 1.6487; (P) 1.6526; (R1) 1.6572; More...
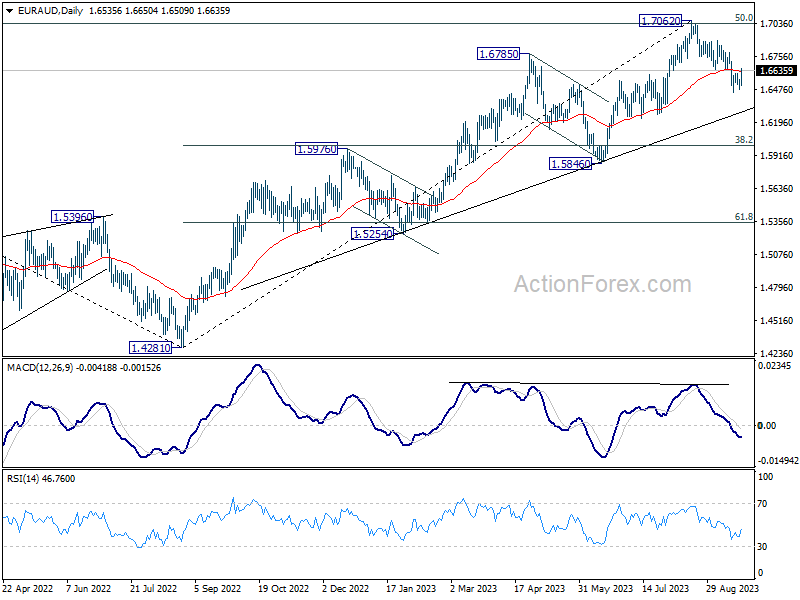
EUR/AUD is extending the consolidation from 1.6452 and intraday bias remains neutral. Further decline is expected with 1.6793 resistance intact. Fall from 1.7062 is seen as a larger scale correction. Below 1.6452 will target 1.6000 fibonacci level. Nevertheless, firm break of 1.6793 will dampen this view and bring retest of 1.7062 instead.
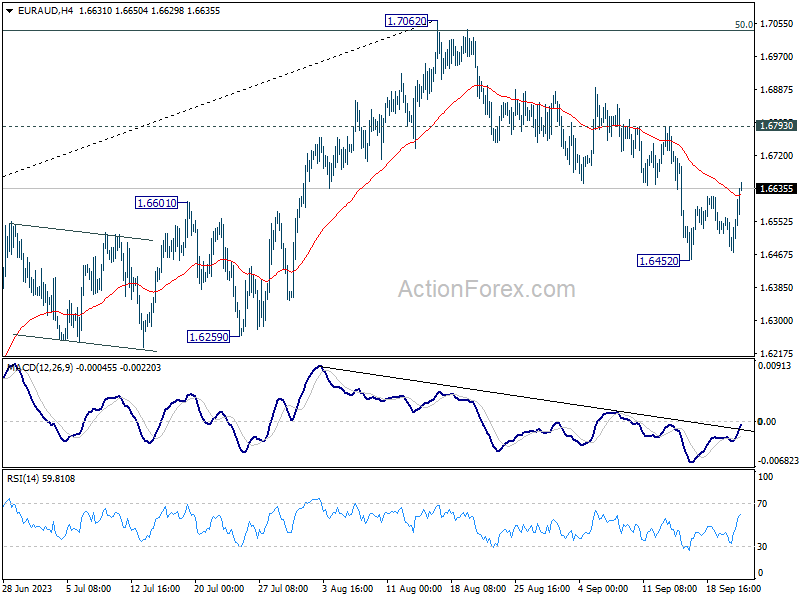
In the bigger picture, current development argues that fall from 1.7062 is probably correcting whole up trend from 1.4281. Deeper decline would be seen to 38.2% retracement of 1.4281 to 1.7062 at 1.6000. Strong support should be seen there to bring rebound, at least on first attempt.
EUR/JPY Daily Outlook
Daily Pivots: (S1) 157.80; (P) 158.12; (R1) 158.48; More....
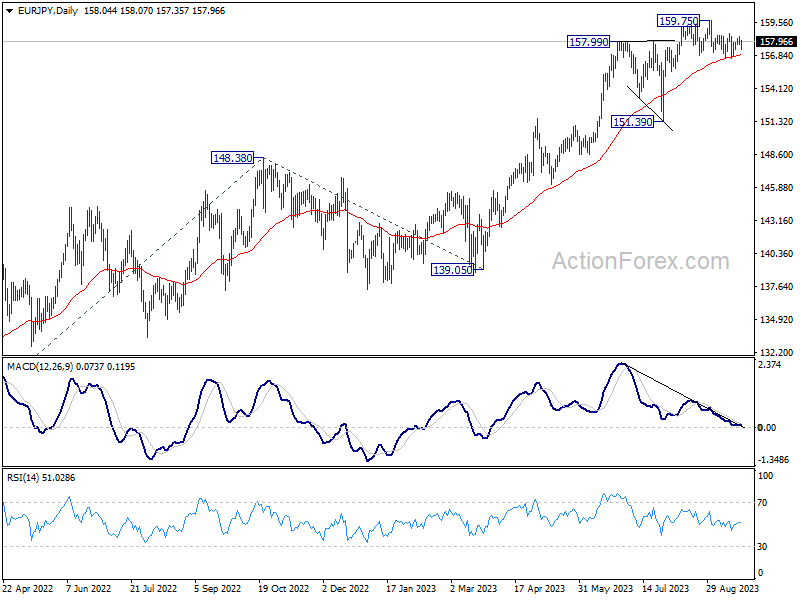
No change in EUR/JPY's outlook as range trading continues. Intraday bias stays neutral. Risk will be mildly on the downside as long as 158.64 resistance holds. Break of 156.57 support, and sustained trading below 55 D EMA (now at 156.80) will argue that fall from 159.75 is a larger scale correction. Deeper decline would be seen back towards 151.39 support. Nevertheless, above 158.64 would bring retest of 159.75 high instead.
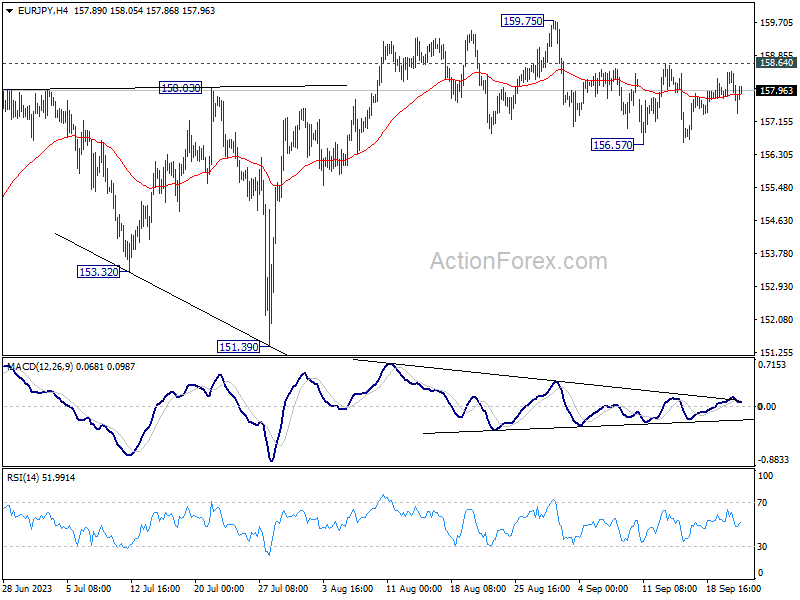
In the bigger picture, as long as 151.39 support holds, rise from 114.42 is still expected to continue. Next target is 100% projection of 124.37 to 148.38 from 139.05 at 163.06. Sustained break there will pave the way to retest long term resistance at 169.96.
GBP/JPY Daily Outlook
Daily Pivots: (S1) 182.62; (P) 182.98; (R1) 183.50; More...
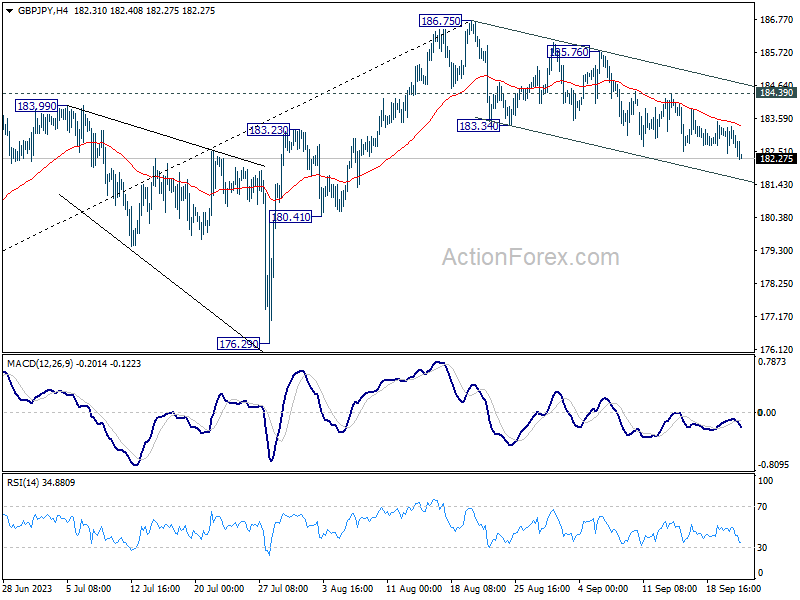
GBP/JPY's fall from 186.75 is in progress and intraday bias stays on the downside. Sustained trading below 55 D EMA (now at 182.49) will argue that it's already in a larger scale correction and target 176.29 support next. On the upside, break of 184.39 resistance will argue that the pull back from 186.75 has completed. Intraday bias will be turned back to the upside for 185.76 resistance next.
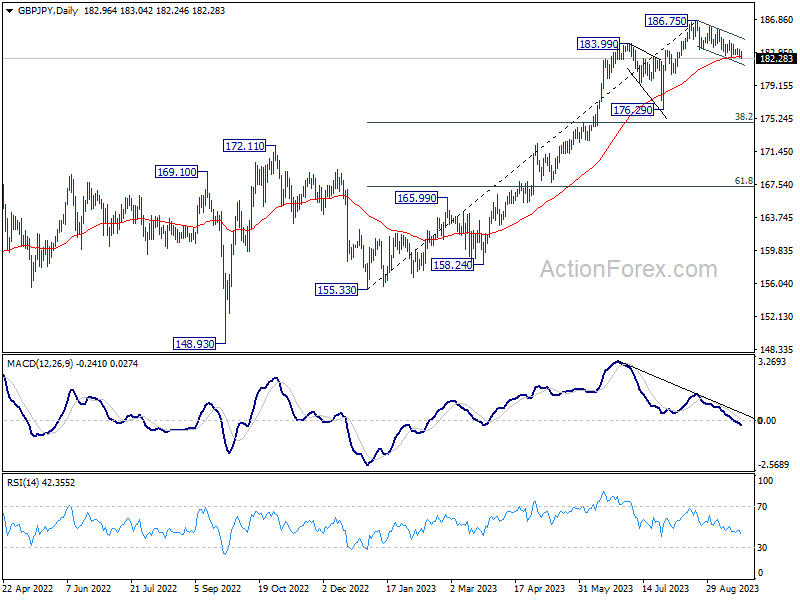
In the bigger picture, as long as 176.29 support holds, larger up trend from 123.94 (202 low) should still be in progress. Break of 186.75 will target 195.86 (2015 high). Nevertheless, firm break of 176.29 will confirm medium term topping, and turn outlook neutral for lengthier and deeper consolidations.
USD/CAD Daily Outlook
Daily Pivots: (S1) 1.3412; (P) 1.3446; (R1) 1.3495; More....
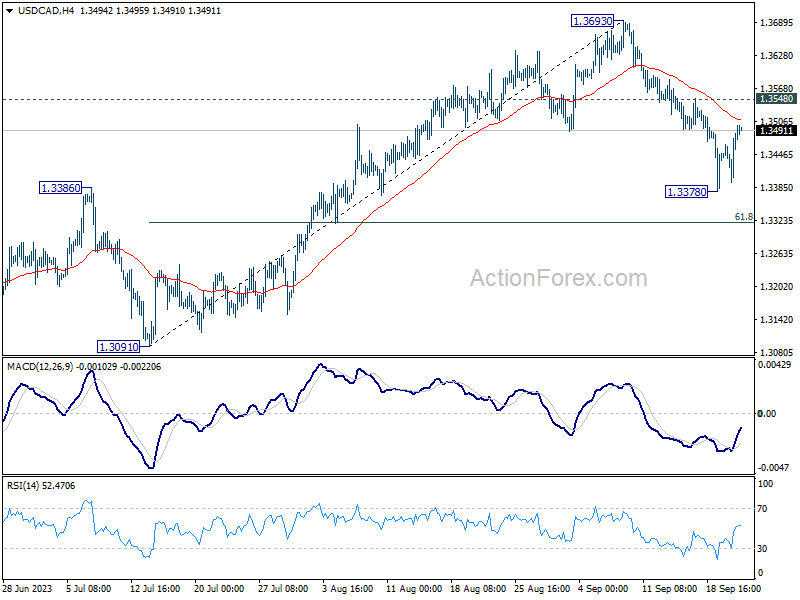
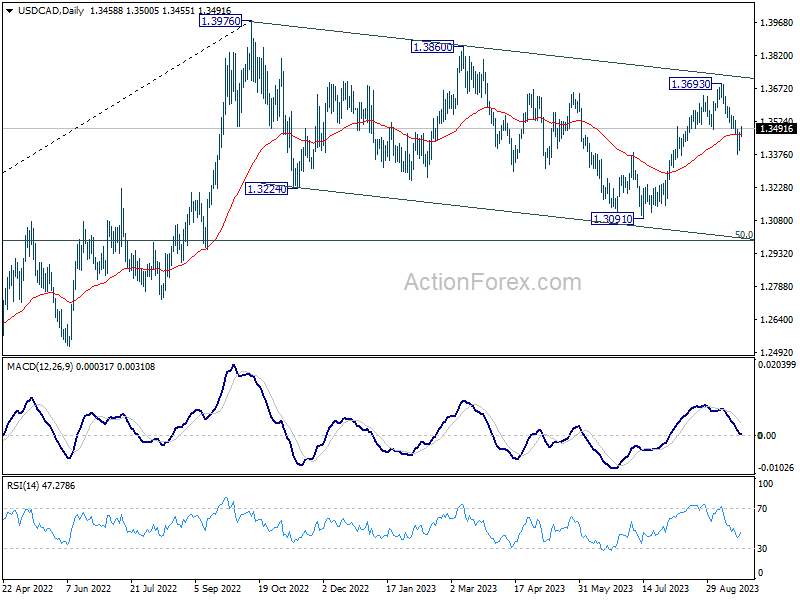
Intraday bias in USD/CAD is turned neutral for now, as it recovered after dipping to 1.3378. Some consolidations are expected by another fall is in favor. Below 1.3378 will target 61.8% retracement of 1.3091 to 1.3693 at 1.3321. Sustained break there will target 1.3091 support next. Nevertheless, break of 1.3548 resistance will turn bias back to the upside for 1.3693 resistance instead.
In the bigger picture, price actions from 1.3976 are viewed as a corrective pattern to the up trend from 1.2005 (2021 low). Deeper decline could be seen as the pattern is now extending. But downside should be contained by 50% retracement of 1.2005 to 1.3796 at 1.2991. Rise from 1.2005 is still expected to resume after the correction completes.
AUD/USD Daily Report
Daily Pivots: (S1) 0.6422; (P) 0.6466; (R1) 0.6493; More...
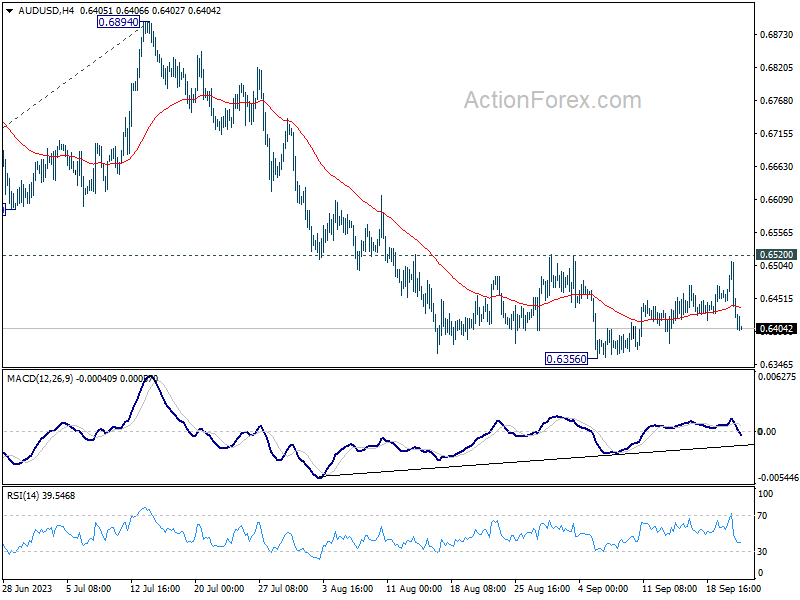
AUD/USD is holding in range of 0.6356/6520 despite near term volatility. Intraday bias stays neutral for the moment. Outlook stays bearish with 0.6520 resistance intact. On the downside, break of 0.6356 will resume larger down trend to 100% projection of 0.7156 to 0.6457 from 0.6894 at 0.6195.
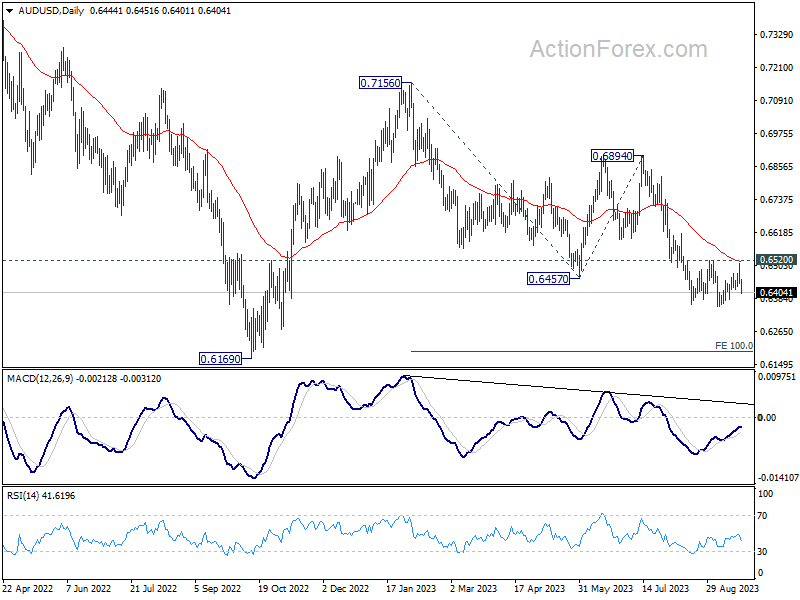
In the bigger picture, down trend from 0.8006 (2021 high) is possibly still in progress. Decisive break of 0.6169 will target 61.8% projection of 0.8006 to 0.6169 to 0.7156 at 0.6021. This will now remain the favored case as long as 0.6894, in case of strong rebound.
ECB’s Nagel uncertain if rate plateau is reached
ECB Governing Council, Joachim Nagel, Bundesbank head, posed a crucial question in his speech in Frankfurt, "Have we reached the plateau" on interest rates? He answered by stating that it "cannot yet be clearly predicted". He continued, elaborating that "the forecasts still only show a slow decline toward the target level of 2%."
Nagel's comments hinted at the continuous monitoring of economic indicators, suggesting that while borrowing costs are expected to "remain at a sufficiently high level for a sufficiently long time," the exact interpretation hinges on the incoming data.
Addressing concerns about Germany's economic health, he remarked that characterizing Germany as the 'sick man' "seems exaggerated." He attributed the present sluggish growth to specific influences such as the global economic deceleration, Russia's conflict with Ukraine, and reduced public expenditure. Offering a silver lining, Nagel projected, "Once we get past the worst of these special factors, the weak growth should also ease. We expect the economy to grow again in 2024."
On the other hand, Latvia's central bank chief, Martins Kazaks, highlighted the structural nature of recent oil price hikes. He pointed out, "The recent oil price increase in my view is not a temporary or transitory, it's very much a structural issue." Such dynamics, according to Kazaks, present heightened inflation risks. Regarding the anticipated rate cuts, he expressed skepticism about their timing, asserting, "I think expecting rate cuts mid next year is somewhat too early."
AUDUSD Edges Lower, Bearish Sentiment Lingers
- AUDUSD is edging lower today, reacting to yesterday’s key event
- The pair remains very close to the new 2023 low registered on September 6
- The momentum indicators appear to support the downleg at this juncture
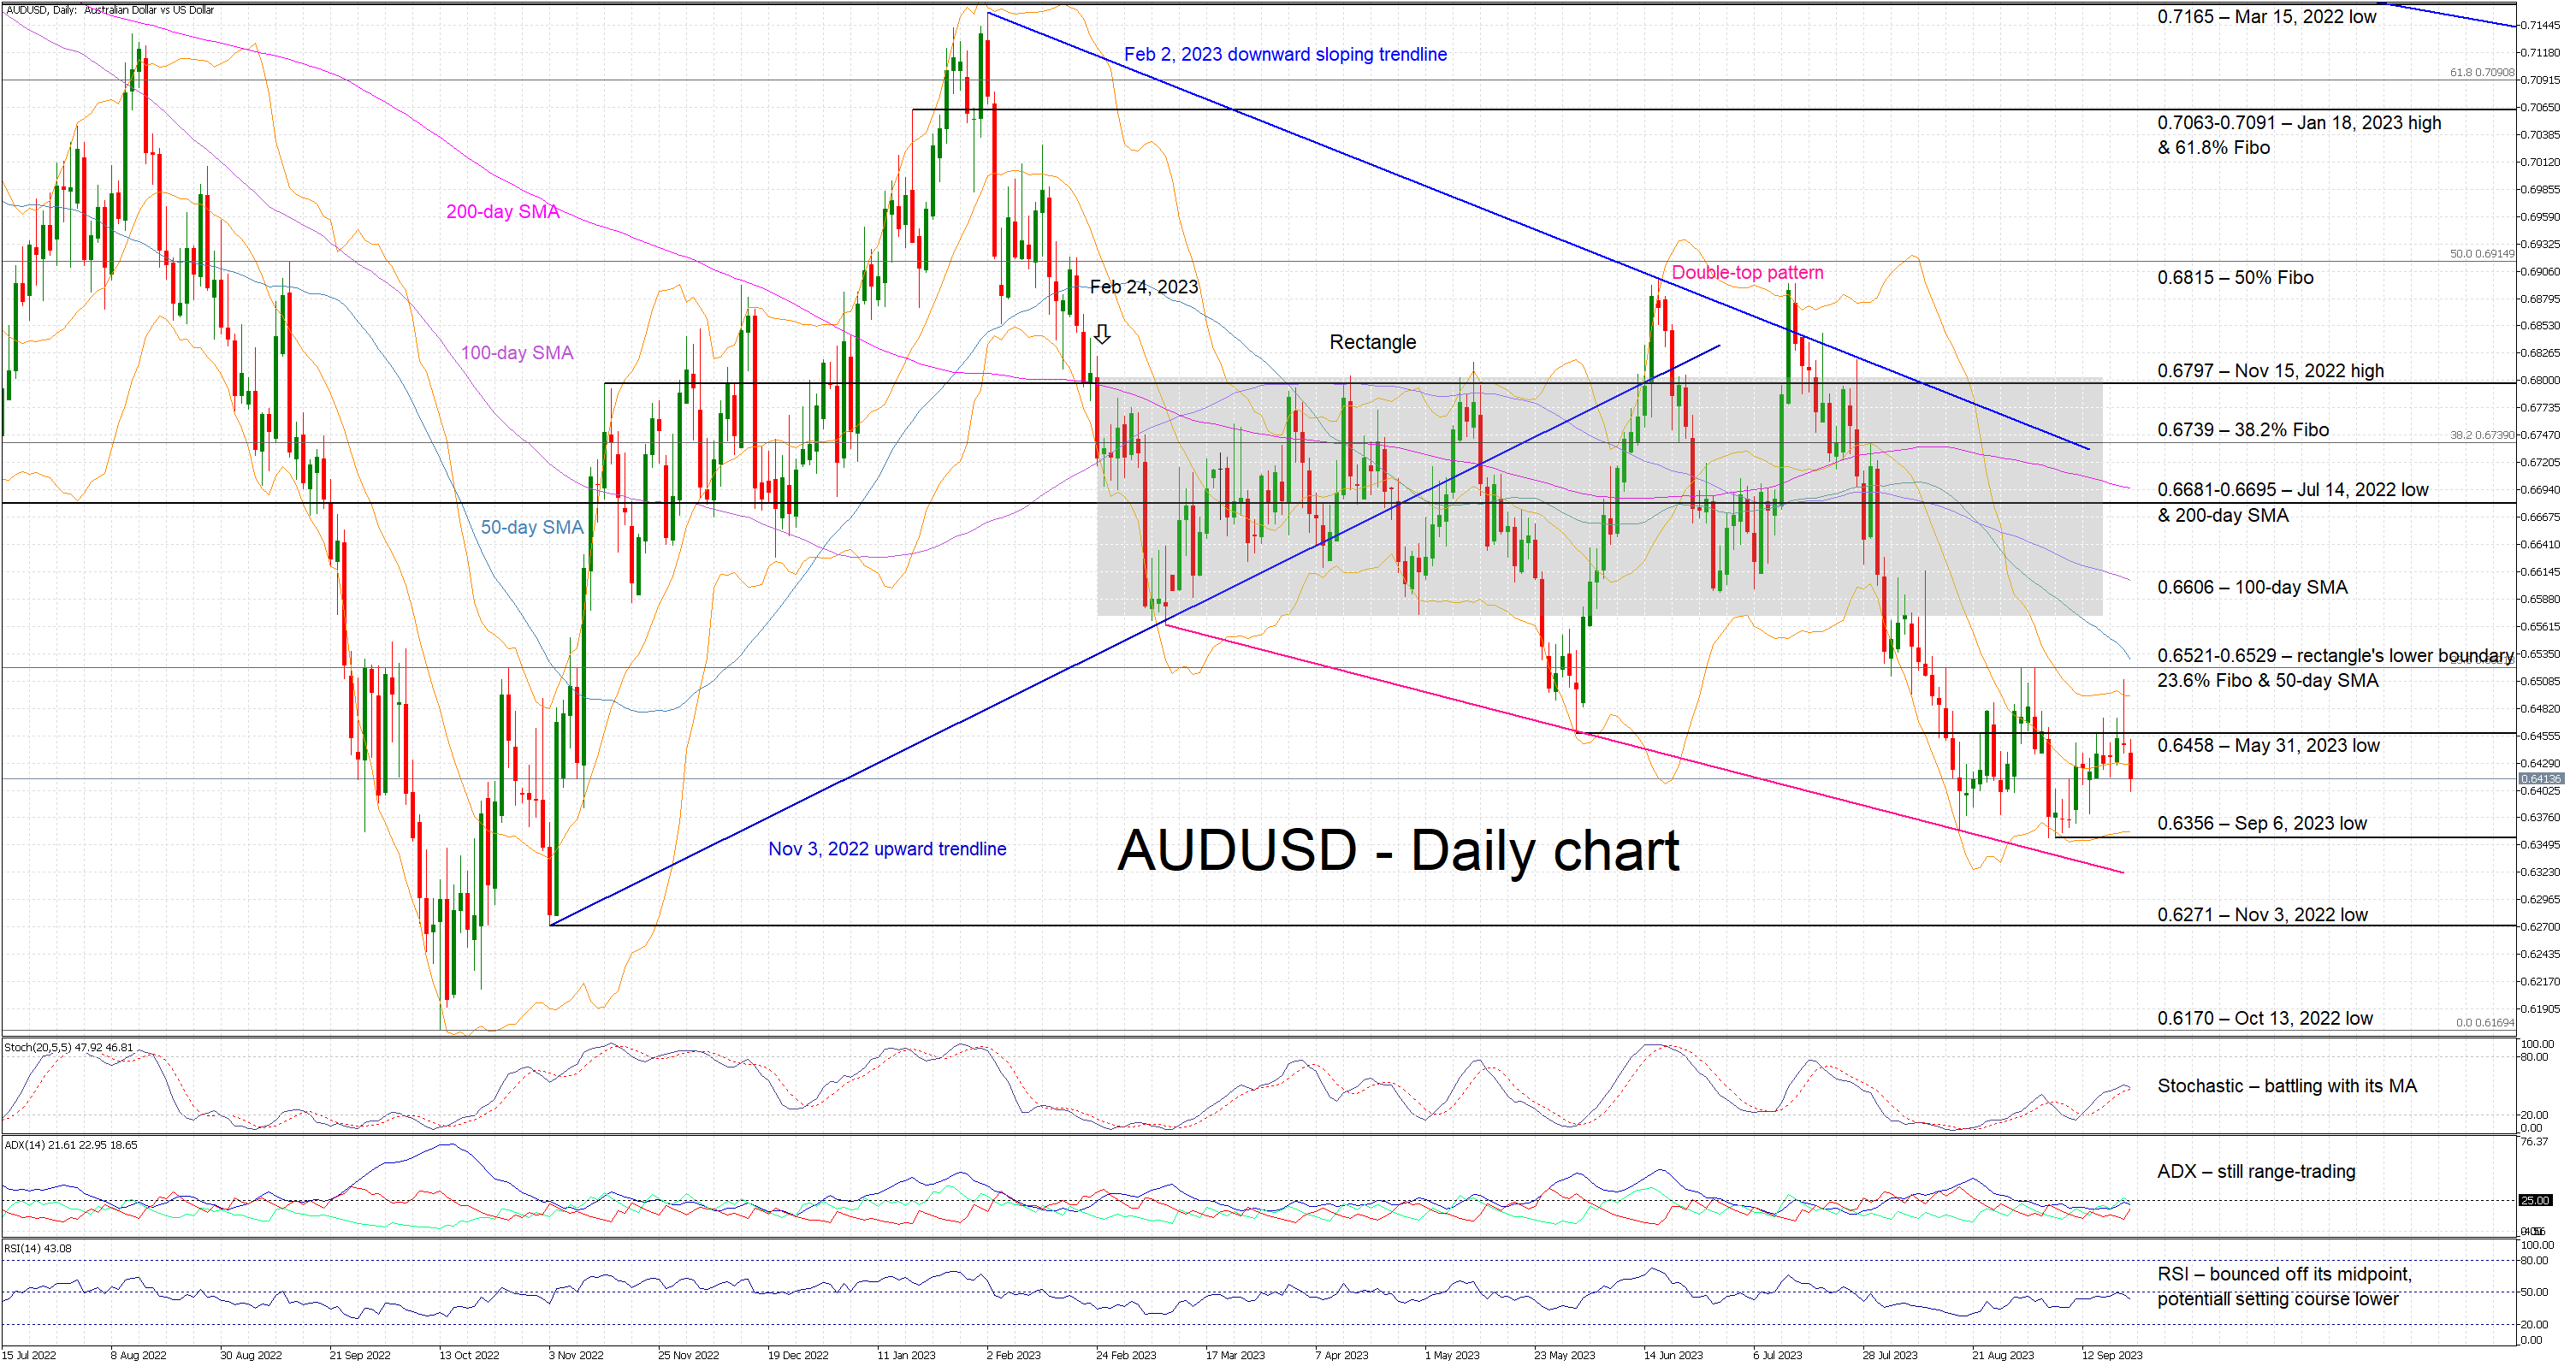
AUDUSD is experiencing its second straight red candle, canceling out most of the upleg recorded since the September 6 low. The overall sentiment remains bearish despite the aggressive sell-off that took place after the formation of the double top pattern in July. Therefore, all eyes are on the momentum indicators at this stage for any clues on the next likely leg in AUDUSD.
In more detail, the RSI continues to hover below its 50-midpoint and now appears to be heading lower. More interestingly, the stochastic oscillator is currently battling with its moving average. The outcome of this battle could play a key role in the next AUDUSD move. On the other hand, the Average Directional Movement Index (ADX) seems uninterested in the recent price action and is stuck below its 25-threshold.
Mixing up the technical picture, an inverse head-and-shoulders pattern appears to be forming with the neckline set at the 0.6521 region. However, a move above this level is necessary for this bullish pattern to become valid.
Should the bulls decide to react to the current pullback, they would try to overcome the May 31, 2023 low at 0.6458, and then set course for the 0.6521-0.6529 region. This is populated by the 23.6% Fibonacci retracement level of the April 5, 2022 – October 13, 2022 downtrend, the rectangle’s lower boundary and the 50-day simple moving average (SMA). Even higher, the 100-day SMA stands at 0.6606.
On the flip side, the bears probably want to capitalize on the current move and gradually test the September 6, 2023 low at 0.6356. They could then possibly set sail for the November 3, 2022 low at 0.6271, with the main target being the October 13, 2022 low at 0.6170.
To sum up, the renewed bearish pressure supported by most momentum indicators appears to bear fruits for the bears but the battle for the next move in AUDUSD has just begun.
BTCUSD Rebound Tested by 50-day SMA
- BTCUSD remains perky after bouncing off 25,000 support
- But 50-SMA proving to be a difficult obstacle to overcome
- Can Bitcoin maintain its recovery?
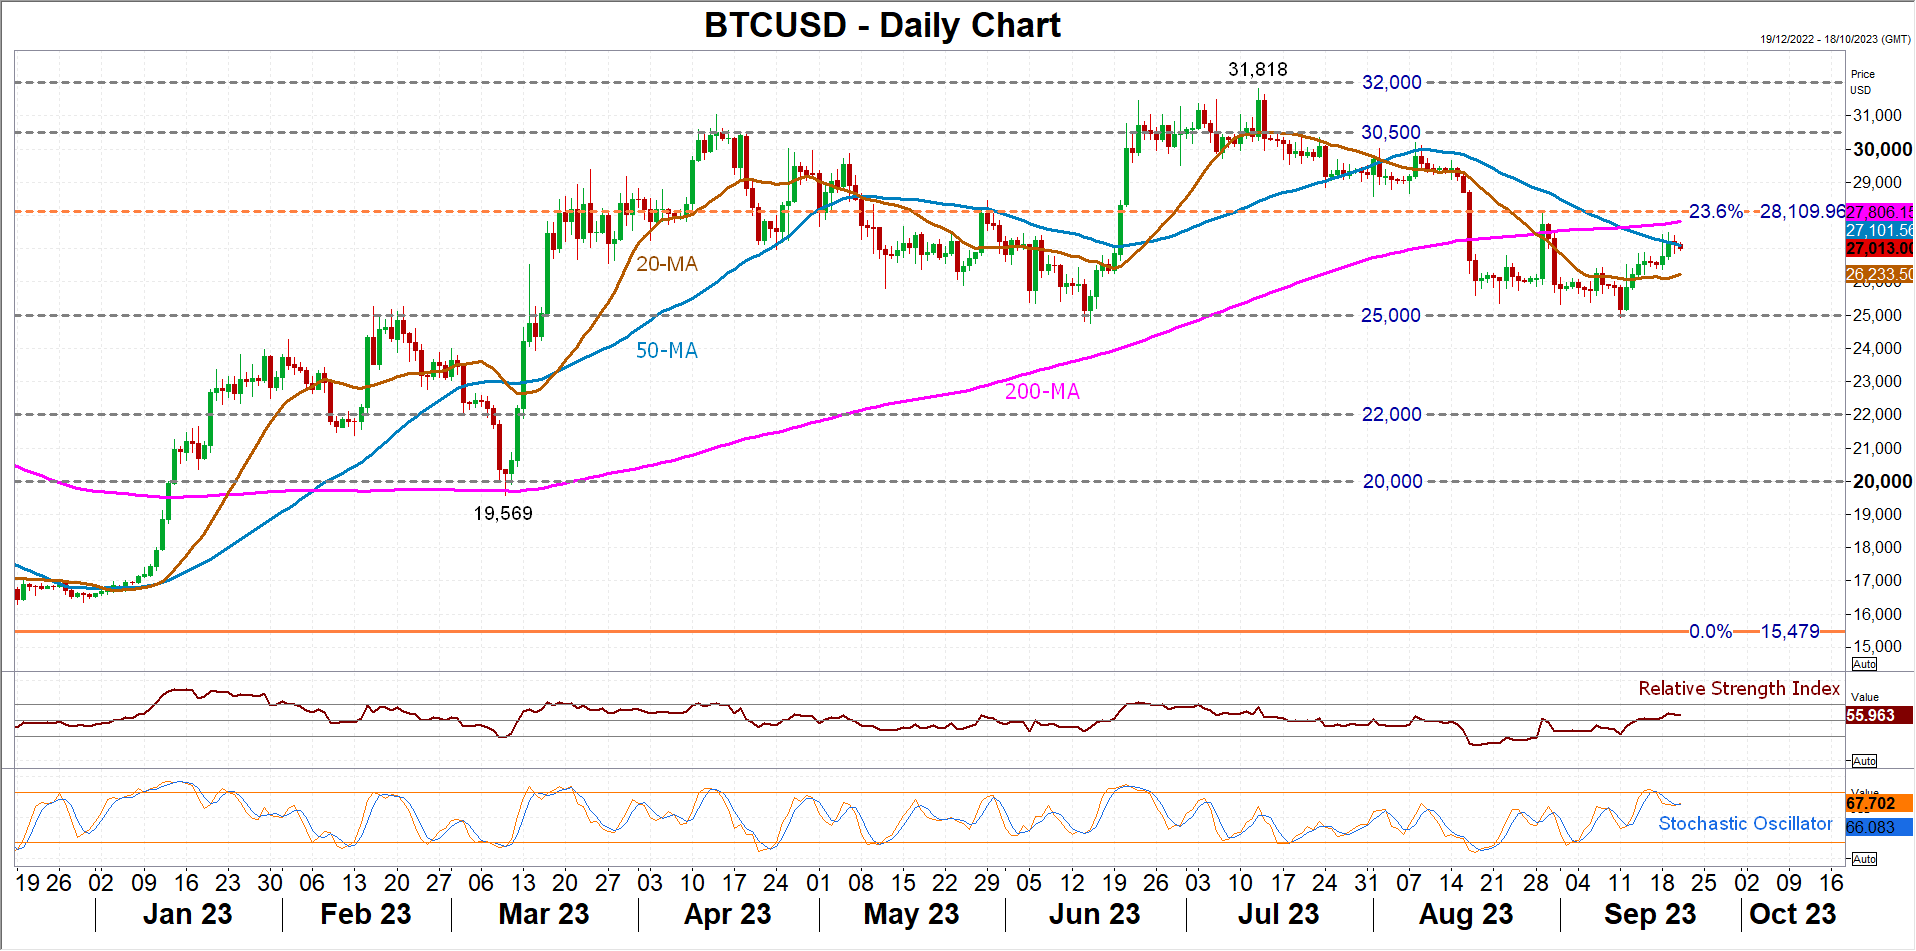
BTCUSD (Bitcoin) has extended its rebound from the September 11 low of 24,920. However, the upside pressure has started to wane after coming into contact with its 50-day simple moving average.
The momentum indicators are in the bullish zone but are pointing to some deterioration in the positive bias in the near term. The RSI has started to edge lower, though it remains above the 50-neutral mark for now, while the stochastic oscillator has eased back after briefly entering the overbought region.
If BTCUSD is to stage a sustained recovery, it is critical that it not only conquers the 50-day SMA near 27,100, but also the 200-day SMA just above the 27,800 level, as well as the 23.6% Fibonacci retracement of the November 2021-November 2022 downtrend at 28,110. A break above this strong resistance area would pave the way for the July top of 31,818, although there might be some friction around 30,500 too.
However, if the bullish momentum subsides further and the price turns lower, immediate support should be provided by the 20-day SMA at 26,234. Failing to halt the decline, Bitcoin could then head back towards the 25,000 level. If breached, there could be some support around 22,000. Otherwise, a revisit of the March low of 19,569 would become inevitable.
In brief, there are a number of hurdles standing in the way of Bitcoin’s latest rebound attempt. Only a climb above the July peak of 31,818 would shift the neutral medium-term outlook to a bullish one, while a drop below the 20-day SMA would turn the focus back to the downside.