

Sample Category Title
EUR/USD Daily Outlook
Daily Pivots: (S1) 1.0628; (P) 1.0683; (R1) 1.0715; More...
EUR/USD's decline resumes and intraday bias is back on the downside. Sustained break of 1.0609/34 support zone will carry larger bearish implication. Fall from 1.1274 should then target target 1.0515 support next. Nevertheless, strong strong rebound from current level, followed by break of 1.0767 resistance, should confirm short term bottoming. Intraday bias will be back on the upside for 1.0944 resistance.
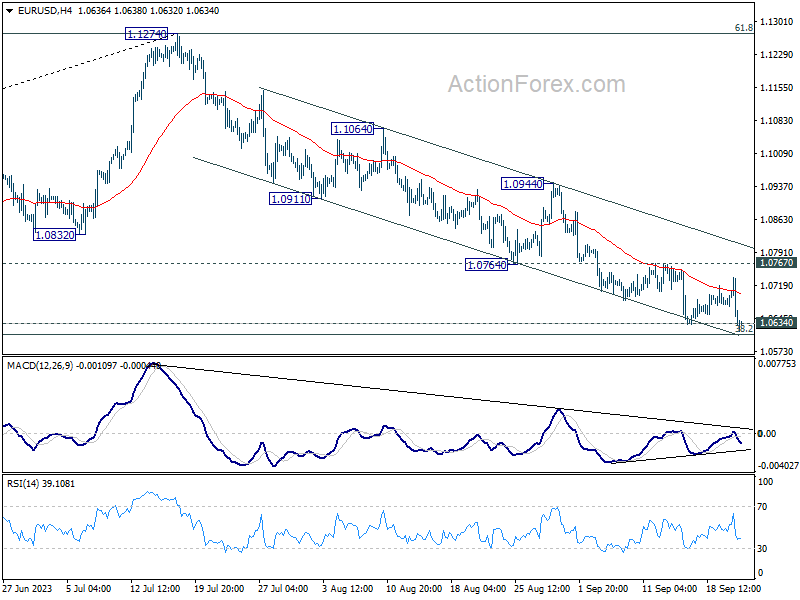
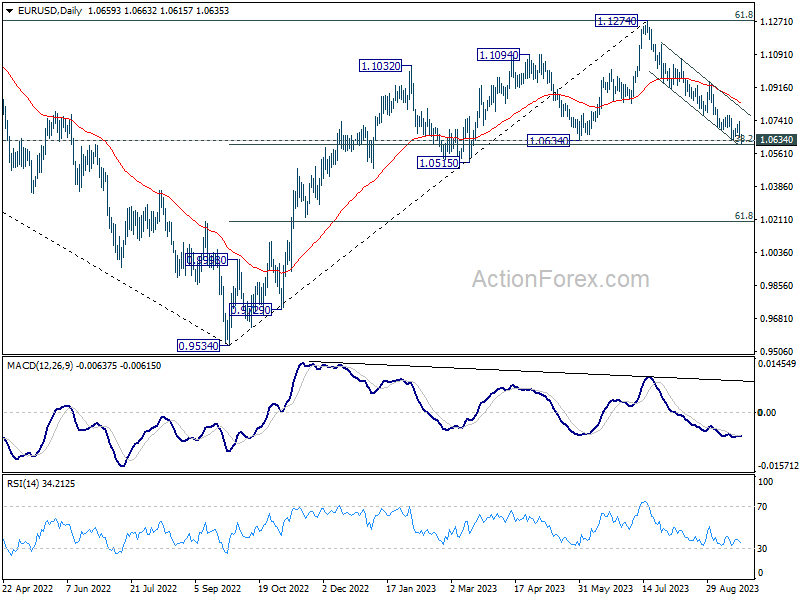
In the bigger picture, fall from 1.1274 medium term top is seen as a correction to up trend from 0.9534 (2022 low). Strong support could be seen from 1.0634 cluster support (38.2% retracement of 0.9534 to 1.1274 at 1.0609) to bring rebound, at least on first attempt. However, sustained break of 1.0609/0634 will raise the chance of bearish trend reversal, and target 61.8% retracement at 1.0199.
Hawkish Fed Spurs Dollar and Yield Surge, SNB and BoE Next
Fed's decisively hawkish stance overnight propelled both Dollar and yields upwards, albeit dampening the stock market. Majority of FOMC members maintained projections of another interest rate hike within the year, with a tempered pace of rate cuts anticipated for the forthcoming year.
Fed's message resounded in the markets as we witnessed a significant leap in two-year yield to levels unseen since 2006 and ten-year yield reaching its highest since 2007. Conversely, equity markets displayed vulnerability, with major US stock indices shutting shop in the red, a sentiment echoing into Asian.
Despite Dollar's vigorous performance, it is only standing as the week's third strongest currency, trailing behind Canadian and New Zealand Dollars, the latter buoyed by impressive GDP results from New
In contrast, Sterling grapples with uncertainty, with looming BoE rate decision casting a shadow on its performance. The fate of the Pound hangs in balance, with potential downward pressure irrespective of whether BoE adopts a hawkish hold or dovish hike.
Meanwhile, risk-averse sentiments have doused Australian Dollar, relegating it to the second-last position. Both Euro and Swiss Franc oscillate with mixed sentiments, with eyes keenly set on the impending SNB rate decision.
The market's gaze is also fixed on USD/JPY, heightened by Japan's Chief Cabinet Secretary Hirokazu Matsuno's forewarning of a government-led response to necessary forex movements, fostering speculation on intervention — either verbal or actionable — or a policy shift to be unveiled in BoJ's decision tomorrow.
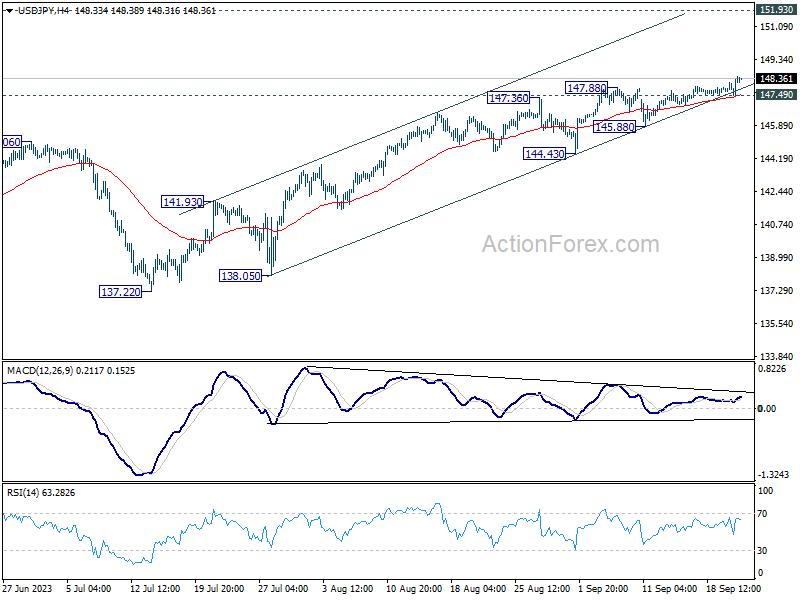
Technically, USD/JPY has clearly been losing upside momentum as seen in 4H MACD. But for now, there is not sign of topping as long as 147.49 minor support holds. Current rally is still in progress for retesting 151.93 high.
In Asia, at the time of writing, Nikkei is down -1.34%. Hong Kong HSI is down -1.24%. China Shanghai SSE is down -0.60%. Singapore Strait Times is down -1.16%. Japan 10-year JGB yield is up 0.021 at 0.746. Overnight, DOW fell -0.22%. S&P 500 fell -0.94%. NASDAQ fell -1.53%. 10-year yield dropped -0.016 to 4.349.
S&P 500 dips on Fed's definitive hawkish stance
US equities ended their trading session in the red, following a definitive hawkish stance from Fed, even though interest rate was kept unchanged as expected. Fed sent a clear signal that another rate hike is still on the cards this year, and interest rate is going to stay higher for longer. Fed Chair Jerome Powell confirmed in the post meeting press conference, "We're in a position to proceed carefully in determining the extent of additional policy firming."
The new batch of economic projections divulged a prevailing sentiment among 12 of 19 Fed officials in favor of one more rate hike within this year. Investors were taken by surprise not by the rate hike anticipation but by the foreseeing of lesser rate cuts in 2024, a strategic shift attributed largely to the resilient labor market.
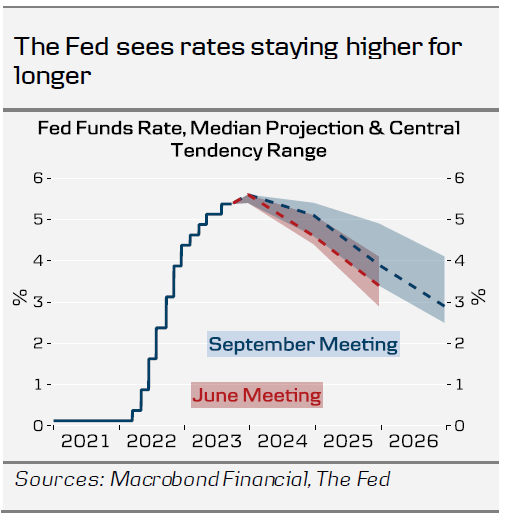
Furthermore, the projections hinted at a steeper path for interest rates in the years ahead. Median outlook for federal funds rate was adjusted upwards, settling at 5.1% for 2024, from a prior 4.6%, and 3.9% for 2025, up from 3.4%. This suggests that monetary policy will lean on the tighter side stretching into 2026. A 2.9% funds rate is projected for 2026, marking a divergence from the long-run neutral rate, which remains pegged at 2.5%.
More on Fed:
- Fed Review: Upbeat on Growth
- Message from FOMC Meeting: Higher for Longer
- Fed React: Dollar Pares Earlier Losses after Fed's Attempt of a Hawkish Skip
- Fed stands part, 12 members see one more hike
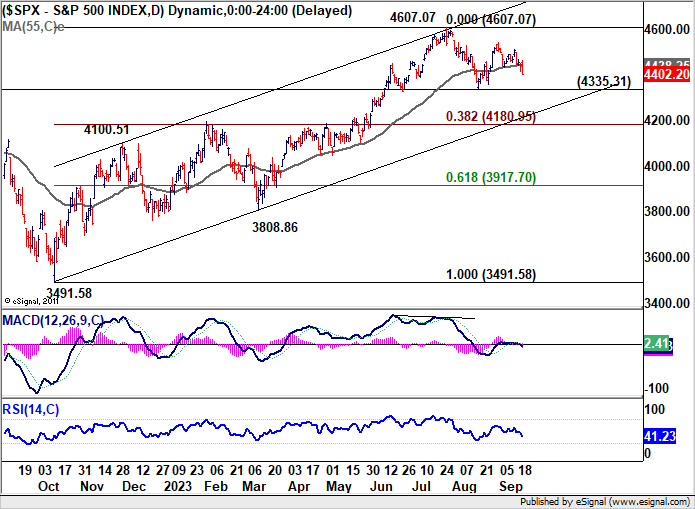
Reflecting these developments, S&P 500 took a dip, shedding -0.94% or -41.75 points to conclude at 4402.20. In a technical context, S&P 500's movements stemming from 4607.07 are perceived a correction pattern. D deeper slide is on the cards to 4335.31 or even lower.
However, robust support levels are anticipated around the 38.2% retracement of 3491.58 to 4607.07 at 4180.95. This is expected to limit further losses, at least at first attempt. Meanwhile, a close above 55 D EMA (now at 4438.25) will neutralize the bearish outlook.
New Zealand's Q2 GDP outperforms expectations with 0.9% qoq growth
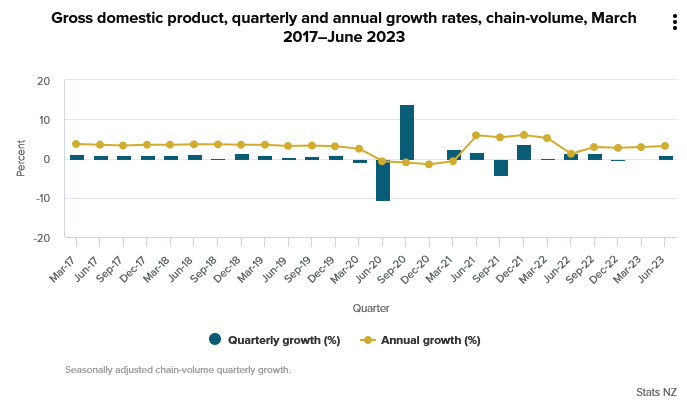
New Zealand's GDP surged by 0.90% qoq in Q2, doubling the expected growth rate of 0.4%. This notable growth is significantly attributed to substantial boost in the business services sector, specifically within the realm of computer system design.
Despite a setback in the primary industries, which contracted by 1.9%, goods-producing industries and service sectors pulled their weight, recording a growth of 0.7% and 1.0% respectively. The service sector emerged as a strong pillar of economic advancement.
The quarter also saw manufacturing sector shake off its lethargy, reversing a trend of decline sustained over five consecutive quarters to contribute positively to the economic pie.
BoE and SNB looms as GBP/CHF awaits Clarity
Today, all eyes are firmly fixed on BoE and SNB rate decisions, which are poised to offer directional cues for the GBP/CHF, hopefully. The pair has been bounded in a constrained range for some time, hungry for a catalyst to redefine its movement.
On one hand, BoE is grappling with the aftermath of lackluster UK inflation data, leaving its imminent rate decision hanging in a delicate balance. The central bank faces two potential paths: embracing a hawkish hold akin to Fed, hence deferring a rate hike while keeping it in the future playbook, or mirroring ECB's strategy with a dovish hike, signaling a peak in the tightening cycle. This undetermined stance has metamorphosed the rate decision into somewhat of a coin toss.
Meanwhile, the consensus among analysts is leaning towards a 25bps hike by SNB, setting the interest rate at a neat 2.00%, thereby drawing the current cycle to a close. This perspective, held by a substantial majority of economists surveyed by Bloomberg, finds reinforcement in the upward revision of the 2024 inflation forecasts tabled by SECO yesterday.
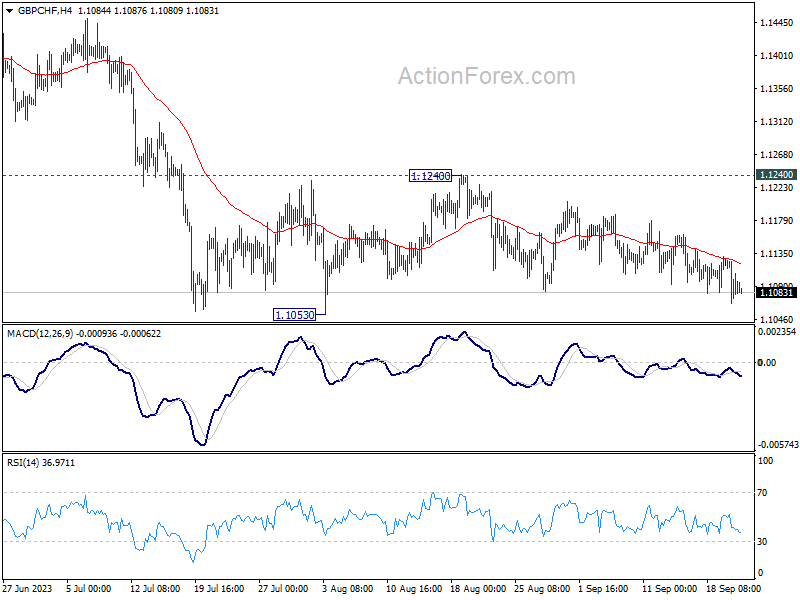
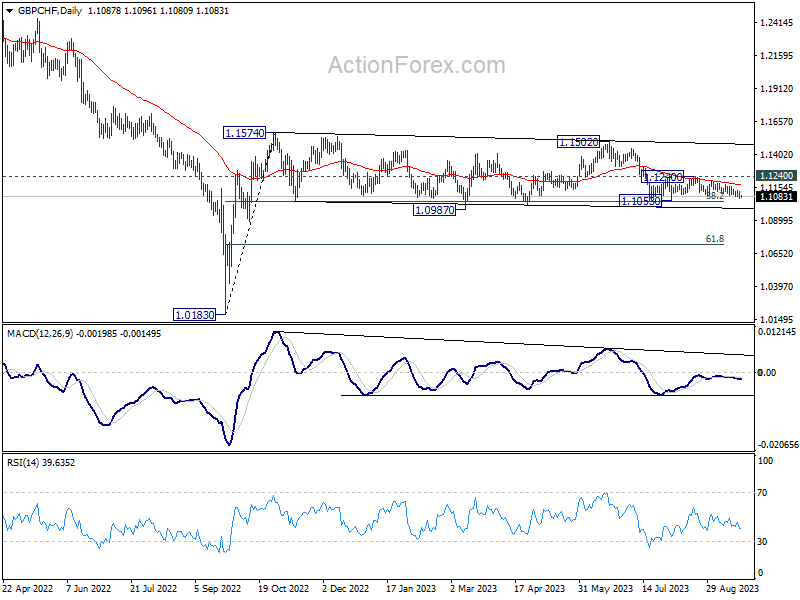
Casting an eye on GBP/CHF, it is currently oscillating within a short-term range between 1.1053 and 1.1240. Presently, its trajectory is hard to pin down. The bearish sentiment is palpable with the pair capped below by 55 D EMA at 1.1709. However, this is offset by the steadfast support at 38.2% retracement of 1.0183 to 1.1574 at 1.1043.
For a clear bearish momentum to materialize, the cross would need to break the 1.1053 support, and then ensuring it sustainably trades below 1.1043 – a weekly close below this fibonacci level would solidify this stance. Yet, a spike lower, followed a substantial rebound could indicate a bullish reversal, hinting at a potential rise past 1.1240 resistance later, to extend the medium term range trading from 1.1574.
Elsewhere
Canada will release new housing price index. US will release jobless claims, Philly Fed survey and existing home sales.
EUR/USD Daily Outlook
Daily Pivots: (S1) 1.0628; (P) 1.0683; (R1) 1.0715; More...
EUR/USD's decline resumes and intraday bias is back on the downside. Sustained break of 1.0609/34 support zone will carry larger bearish implication. Fall from 1.1274 should then target target 1.0515 support next. Nevertheless, strong strong rebound from current level, followed by break of 1.0767 resistance, should confirm short term bottoming. Intraday bias will be back on the upside for 1.0944 resistance.
In the bigger picture, fall from 1.1274 medium term top is seen as a correction to up trend from 0.9534 (2022 low). Strong support could be seen from 1.0634 cluster support (38.2% retracement of 0.9534 to 1.1274 at 1.0609) to bring rebound, at least on first attempt. However, sustained break of 1.0609/0634 will raise the chance of bearish trend reversal, and target 61.8% retracement at 1.0199.
Economic Indicators Update
| GMT | Ccy | Events | Actual | Forecast | Previous | Revised |
|---|---|---|---|---|---|---|
| 22:45 | NZD | GDP Q/Q Q2 | 0.90% | 0.40% | -0.10% | 0.00% |
| 06:00 | GBP | Public Sector Net Borrowing (GBP) Aug | 9.8B | 3.5B | ||
| 07:30 | CHF | SNB Interest Rate Decision | 2.00% | 1.75% | ||
| 11:00 | GBP | BoE Interest Rate Decision | 5.50% | 5.25% | ||
| 11:00 | GBP | MPC Official Bank Rate Votes | 8--0--1 | 8--0--1 | ||
| 12:30 | CAD | New Housing Price Index M/M Aug | 0.00% | -0.10% | ||
| 12:30 | USD | Initial Jobless Claims (Sep 15) | 222K | 220K | ||
| 12:30 | USD | Philadelphia Fed Survey Sep | -0.7 | 12 | ||
| 12:30 | USD | Current Account (USD) Q2 | -220B | -219B | ||
| 14:00 | USD | Existing Home Sales Aug | 4.10M | 4.07M | ||
| 14:00 | EUR | Eurozone Consumer Confidence Sep P | -16.5 | -16 | ||
| 14:30 | USD | Natural Gas Storage | 65B | 57B |
Technical Outlook and Review
DXY:
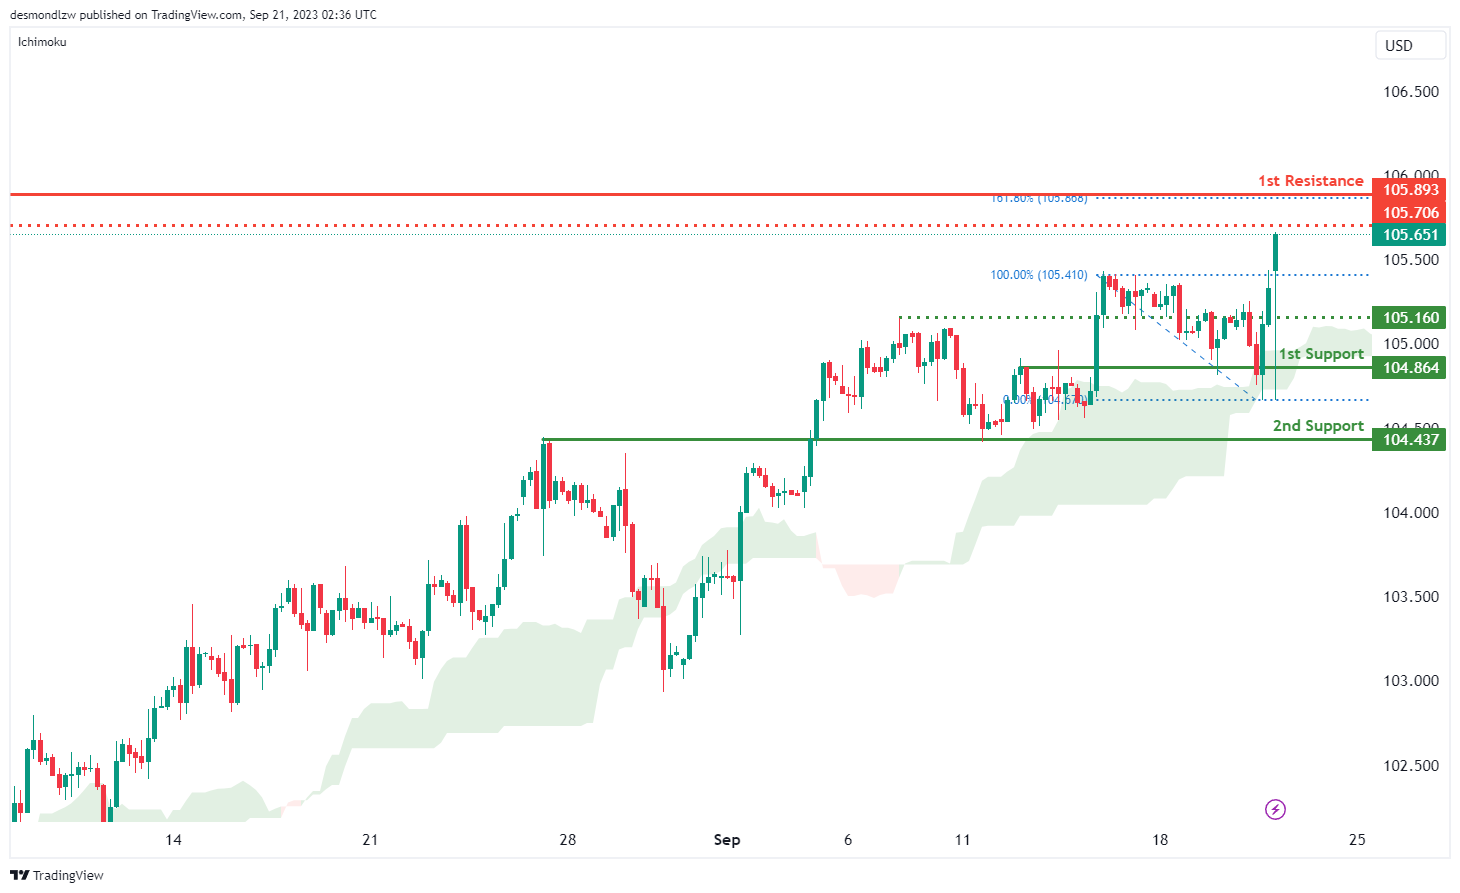
The DXY (US Dollar Index) chart currently exhibits a bullish overall momentum, with several factors contributing to its upward trajectory. A significant factor in this bullish sentiment is the price’s position above the bullish Ichimoku cloud, indicating the potential for further bullish movement.
In this context, there’s a plausible scenario where the price may experience a bullish continuation towards the 1st resistance level at 105.89.
The 1st support at 104.86 is of notable importance, characterized as an overlap support, signifying its historical relevance as a potential strong support zone. Similarly, the 2nd support at 104.43 is identified as an overlap support, further reinforcing its role as a key support level.
On the resistance side, the 1st resistance at 105.89 assumes a pivotal role, categorized as a swing high resistance, and it aligns with the presence of the 161.80% Fibonacci Extension, highlighting its potential as a point of resistance. Additionally, there’s an intermediate resistance level at 105.65, marked as a swing high resistance, further emphasizing its significance.
EUR/USD:
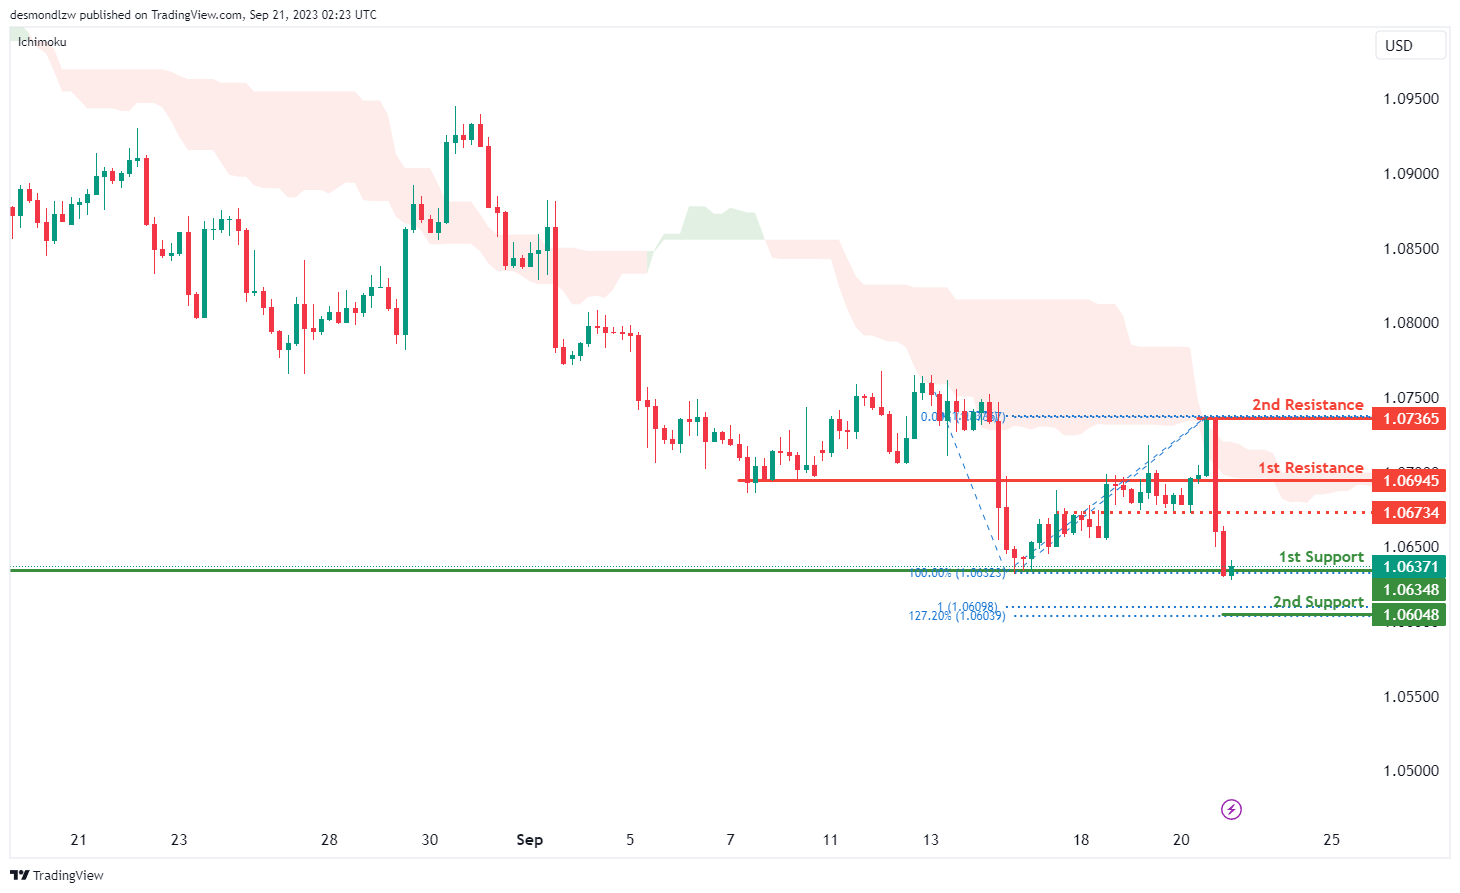
The EUR/USD chart currently maintains a bearish overall momentum, with several factors contributing to its downward trajectory. One key factor influencing this bearish sentiment is the price’s position below the bearish Ichimoku cloud, indicating the presence of bearish market conditions.
However, there’s a potential scenario where the price may experience a short-term rise towards the 1st resistance level at 1.0694 before reversing and heading downwards towards the 1st support at 1.0634.
The 1st support at 1.0634 is of significant importance, identified as a multi-swing low support, and it aligns with the presence of the 127.20% Fibonacci Extension, underscoring its role as a strong support zone. Similarly, the 2nd support at 1.0604 is characterized as an overlap support, further emphasizing its potential as a key support level. This support level also aligns with the presence of the 161.80% Fibonacci Extension and the 100% Fibonacci Projection, indicating a high degree of Fibonacci confluence.
On the resistance side, the 1st resistance at 1.0694 plays a pivotal role, categorized as a pullback resistance, and it may serve as a point of resistance in the short term. Beyond the 1st resistance, the 2nd resistance at 1.0736 is identified as a swing high resistance, further highlighting its significance. Additionally, there’s an intermediate resistance level at 1.0673, marked as a pullback resistance.
EUR/JPY:
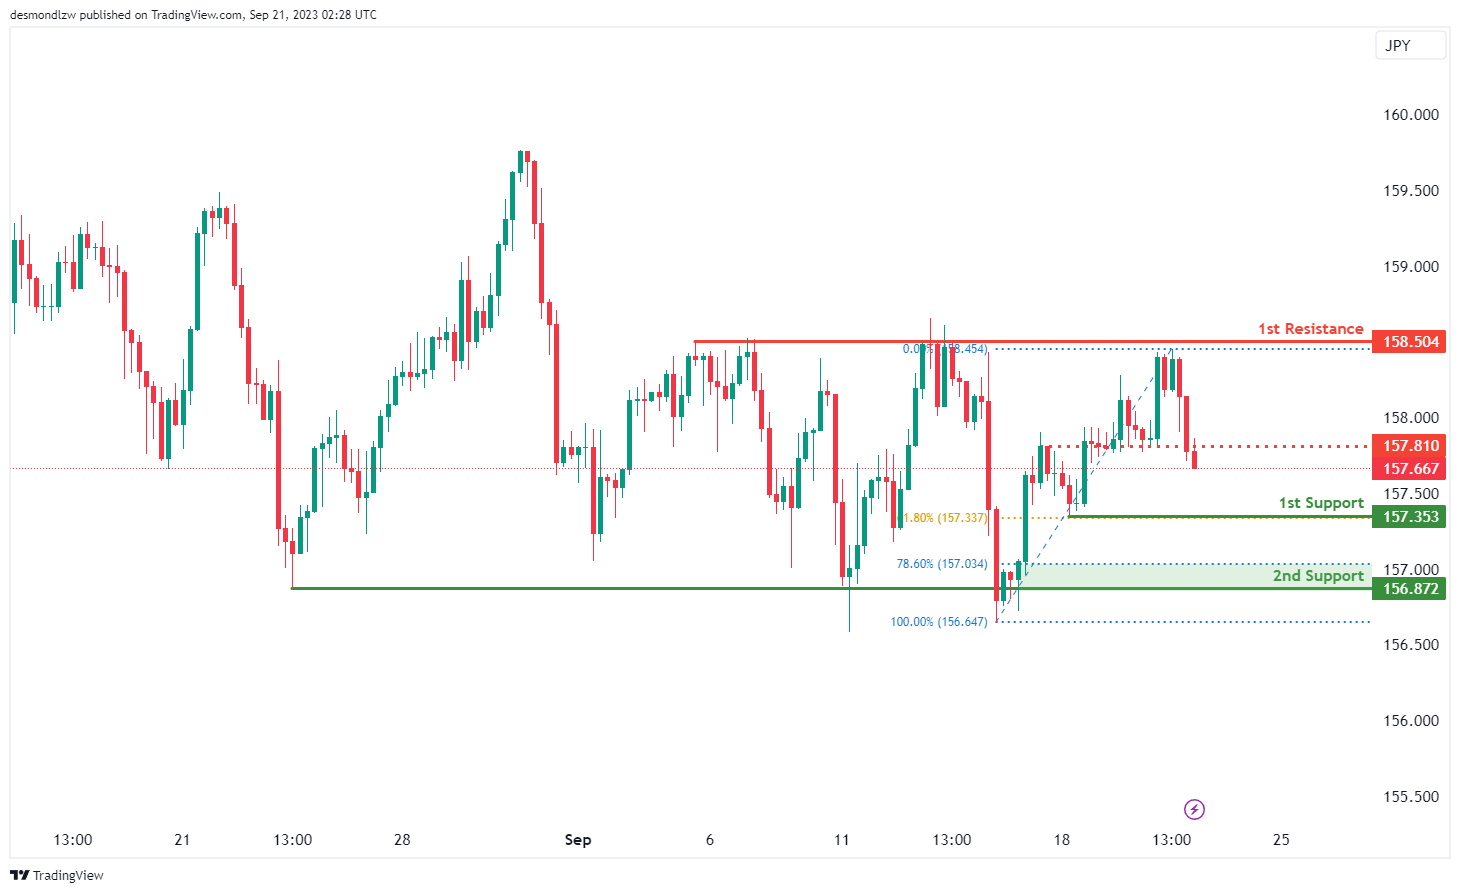
The EUR/JPY chart currently exhibits a bearish overall momentum, with several technical factors contributing to this downward sentiment. Based on the analysis, there is a potential scenario where the price could continue its bearish movement towards the 1st support level.
The 1st support level, located at 157.35, is considered a strong potential support zone. This support level is reinforced by the presence of the 61.80% Fibonacci Retracement, indicating its significance as a potential area where price might find support. Additionally, the 2nd support at 156.87 is identified as a multi-swing low support and is further supported by the 78.60% Fibonacci Retracement, highlighting its potential importance as a support level.
On the resistance side, the 1st resistance level at 158.50 is categorized as a multi-swing high resistance. Traders and investors should monitor this level closely, as it may act as a point of resistance within the ongoing bearish trend. Additionally, the intermediate resistance at 157.81 is marked as a pullback resistance, further emphasizing its potential significance.
EUR/GBP:
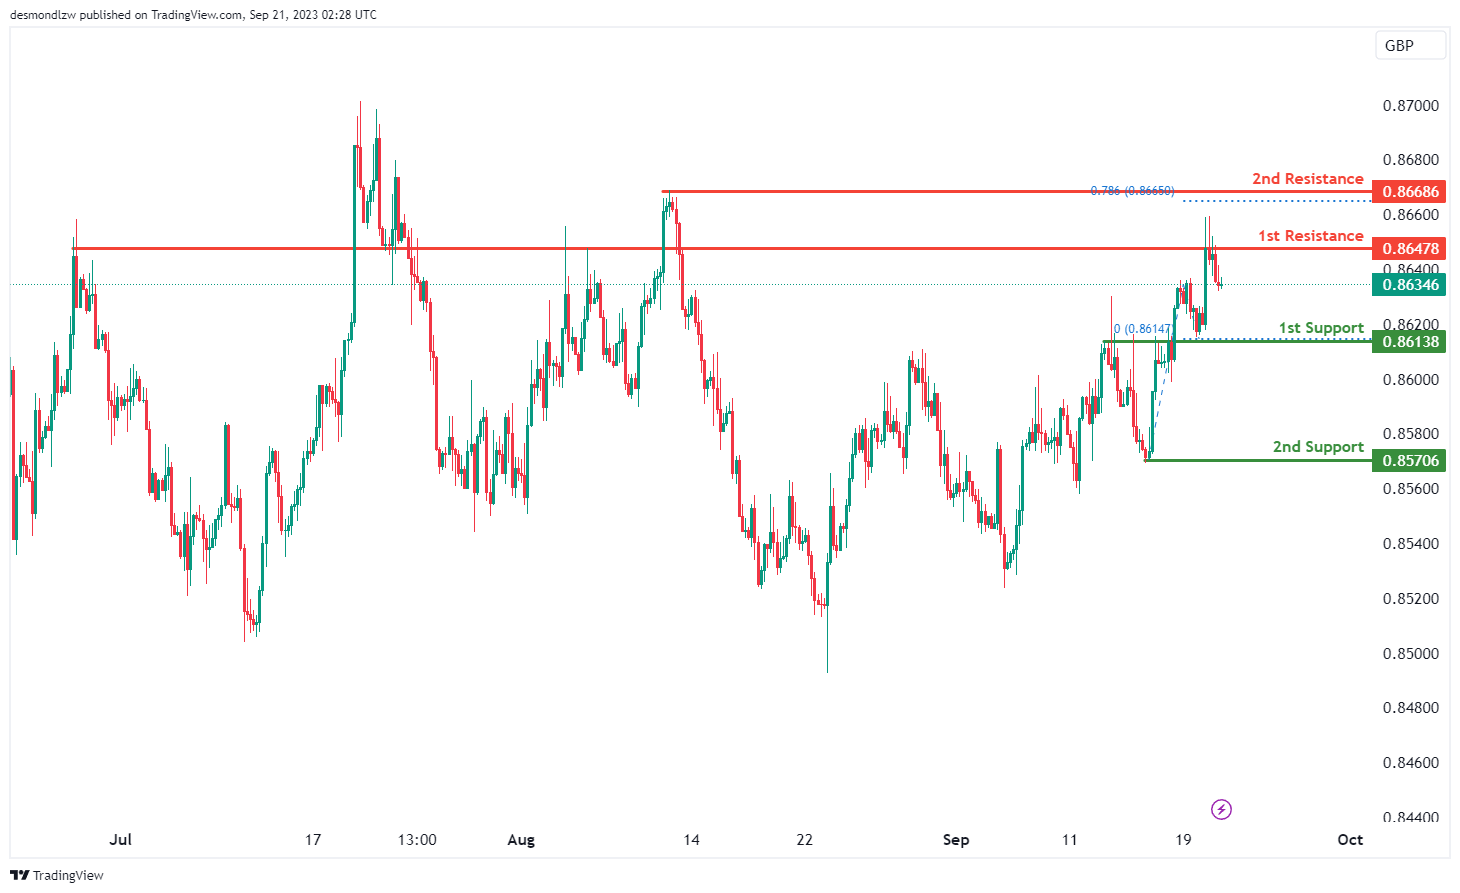
The EUR/GBP chart currently reflects a bearish overall momentum, with several factors contributing to this downward sentiment. Based on the technical analysis, there’s a potential scenario where the price could experience a bearish reaction off the 1st resistance level, potentially leading to a drop towards the 1st support.
The 1st support level, situated at 0.8613, is identified as a significant potential support zone. This level is classified as an overlap support, indicating its importance as a potential area where price might find support. Additionally, the 2nd support at 0.8570 is noted as a swing low support, further emphasizing its role as a potential support level.
On the resistance side, the 1st resistance level at 0.8647 is categorized as an overlap resistance. Traders and investors should pay attention to this level, as it may act as a point of resistance within the ongoing bearish trend. Beyond the 1st resistance, the 2nd resistance at 0.8668 is identified as a swing high resistance, signifying its potential significance as a point of reversal or resistance.
GBP/USD:
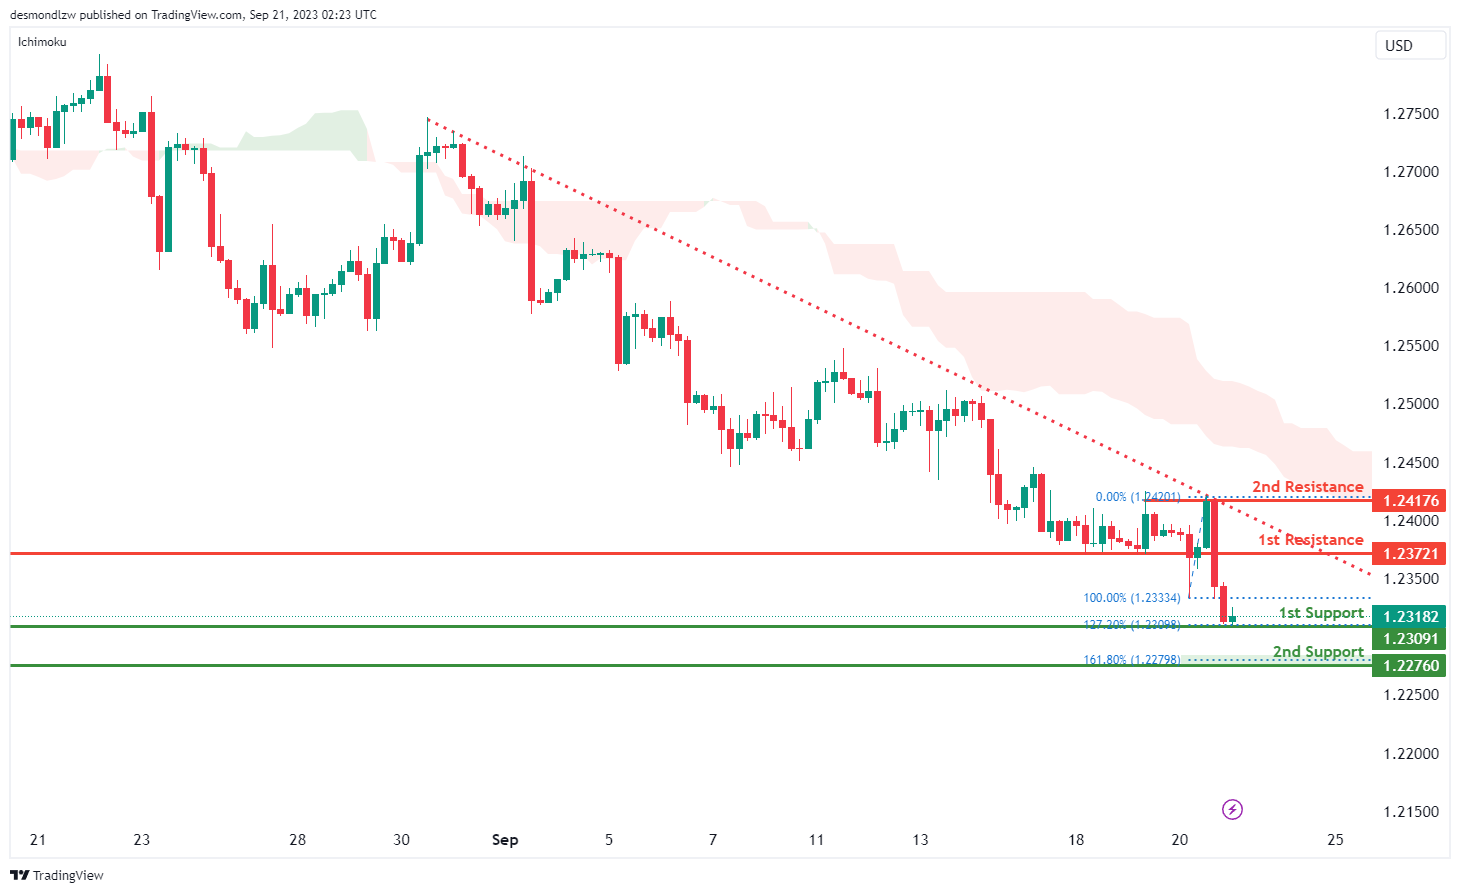
The GBP/USD chart currently maintains a bearish overall momentum, with key factors contributing to its downward trajectory. One significant factor influencing this bearish sentiment is the price’s position below a major descending trend line, which serves as a resistance and suggests the presence of bearish momentum.
In this context, there’s a plausible scenario where the price may experience a short-term rise towards the 1st resistance level at 1.2372 before reversing and heading downwards towards the 1st support at 1.2309.
The 1st support at 1.2309 is identified as a swing low support, and it aligns with the presence of the 127.20% Fibonacci Extension, indicating its role as a strong support zone. Similarly, the 2nd support at 1.2276 is characterized as a swing low support and aligns with the presence of the 161.80% Fibonacci Extension, further emphasizing its potential as a key support level.
On the resistance side, the 1st resistance at 1.2372 assumes a pivotal role, categorized as a pullback resistance, and it may serve as a point of resistance in the short term. Beyond the 1st resistance, the 2nd resistance at 1.2417 is identified as a multi-swing high resistance, underlining its significance.
GBP/JPY:
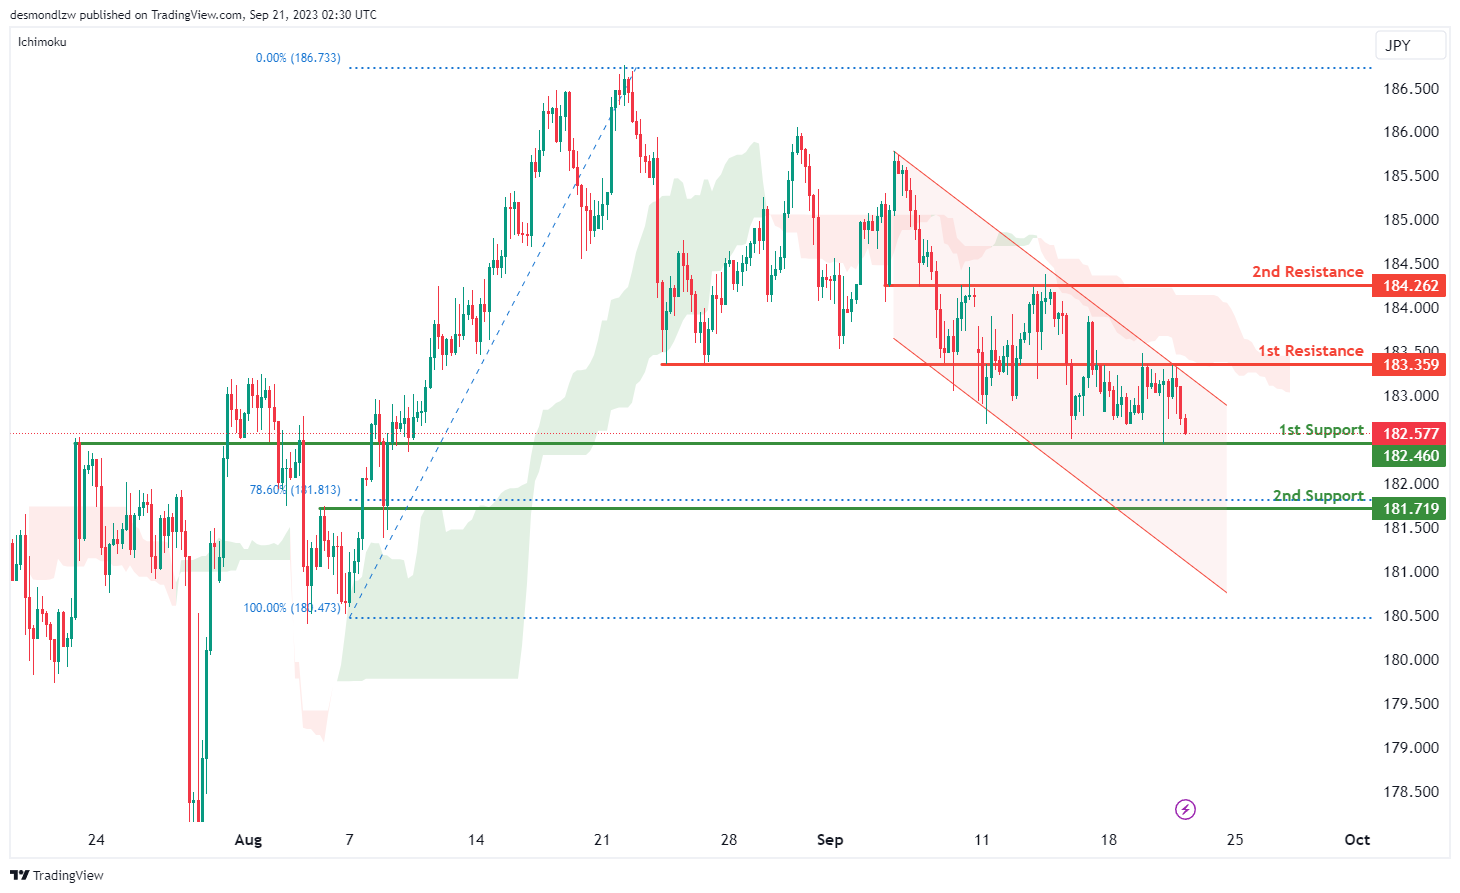
The GBP/JPY chart currently exhibits a bearish overall momentum, with several factors contributing to this downward sentiment. Price analysis reveals that the market conditions are conducive to a bearish continuation, particularly towards the 1st support level.
The 1st support level, situated at 182.52, is identified as a robust potential support zone. This level is classified as an overlap support, emphasizing its significance as a potential area where price could find support. Additionally, the 2nd support at 181.71 adds further weight to the potential support zone, as it aligns with the 78.60% Fibonacci Retracement. This confluence of technical indicators underscores the importance of these support levels in the context of the bearish trend.
On the resistance side, the 1st resistance at 183.35 is categorized as an overlap resistance. This level may act as a point of resistance within the ongoing bearish trend. Beyond the 1st resistance, the 2nd resistance at 184.26 is also identified as an overlap resistance, further reinforcing its significance as a potential resistance level.
The bearish Ichimoku cloud and the presence of a bearish descending channel are key factors contributing to the overall bearish momentum in the GBP/JPY chart
USD/CHF:
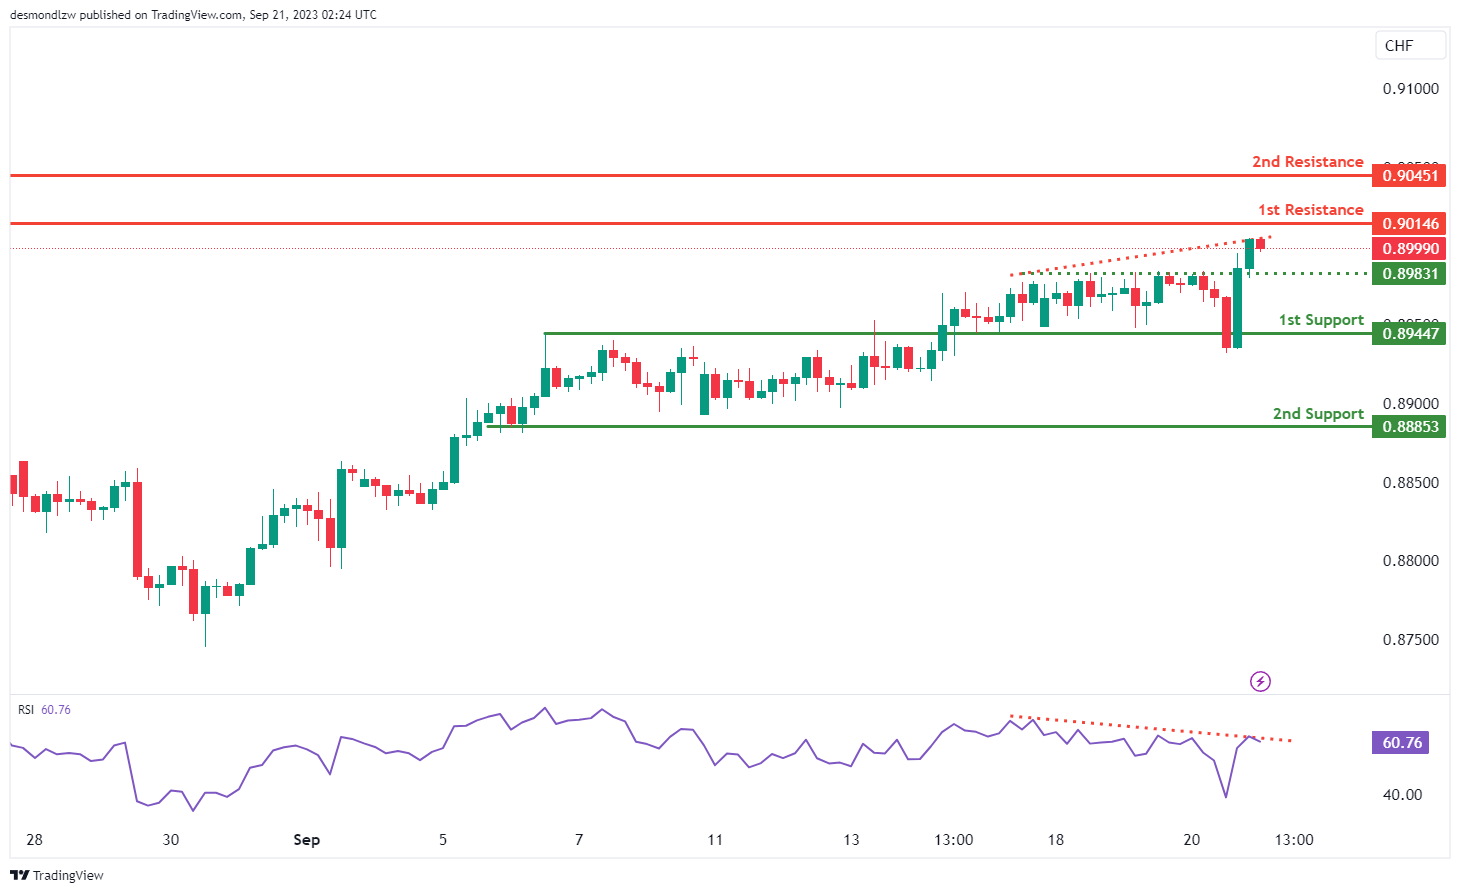
The USD/CHF chart currently exhibits a bearish overall momentum, with the potential for a bearish reaction upon reaching the 1st resistance level at 0.9014, followed by a decline towards the 1st support at 0.8944.
The 1st support at 0.8944 holds significant importance, characterized as an overlap support, signifying its historical relevance as a potential strong support zone. Similarly, the 2nd support at 0.8885 is identified as a multi-swing low support, further reinforcing its role as a key support level.
On the resistance side, the 1st resistance at 0.9014 plays a pivotal role, categorized as a multi-swing high resistance, indicating its potential as a point of resistance. Beyond the 1st resistance, the 2nd resistance at 0.9045 is characterized as an overlap resistance, further highlighting its significance.
Additionally, it’s worth noting that the Relative Strength Index (RSI) is displaying bearish divergence versus price, suggesting the possibility of a reversal occurring soon. This divergence adds to the overall bearish sentiment in the market.
USD/JPY:
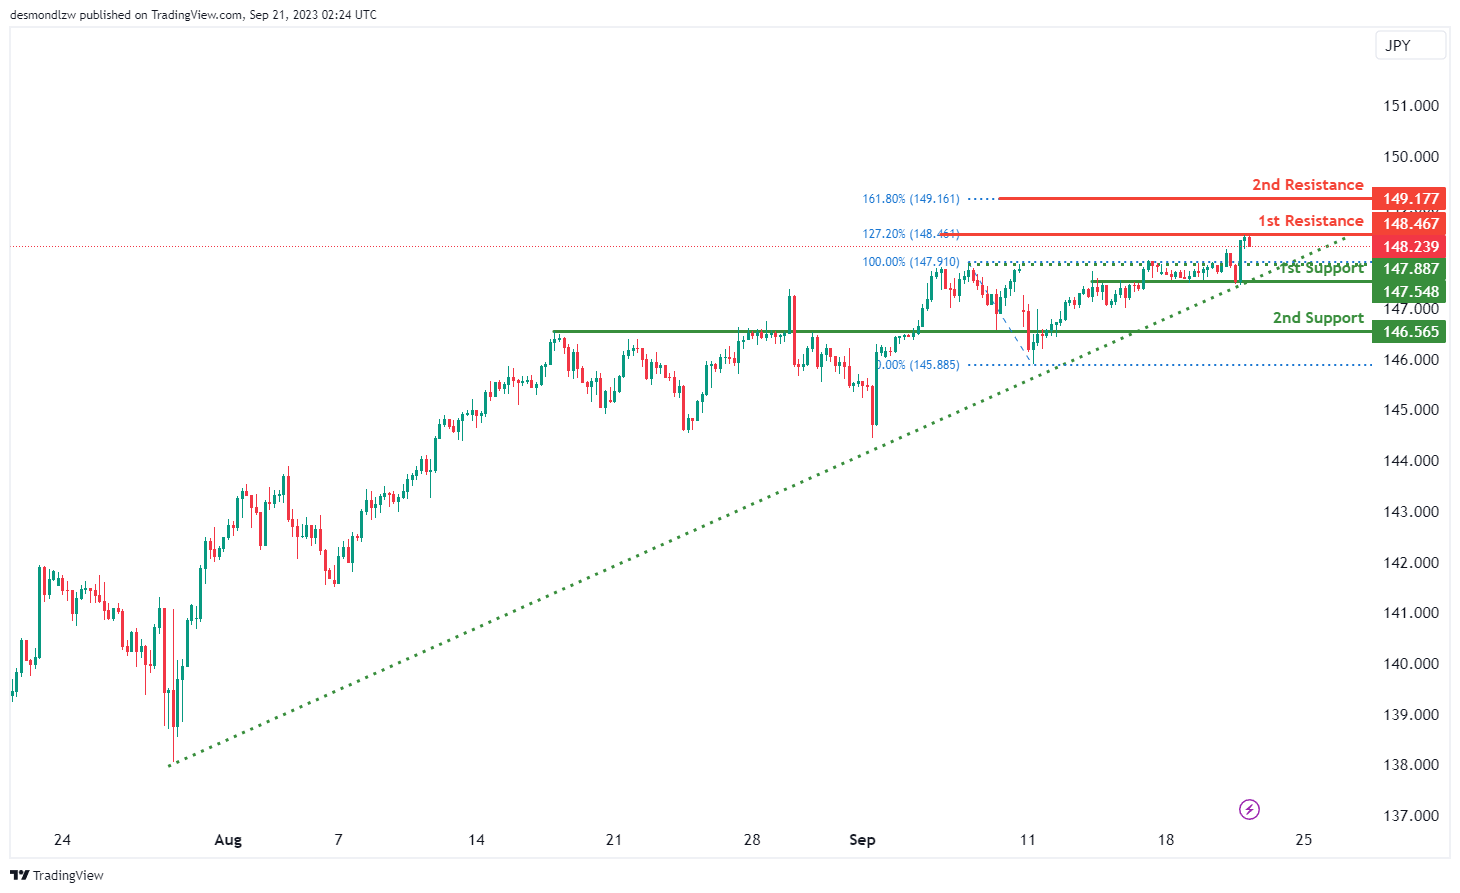
The USD/JPY chart currently maintains a bullish overall momentum, with several factors contributing to its upward trajectory. A significant factor in this bullish sentiment is the price’s position above a major ascending trend line, suggesting the potential for further bullish movement.
However, there’s a plausible scenario where the price may experience a short-term drop towards the 1st support level at 147.54 before bouncing from there and rising towards the 1st resistance at 148.46.
The 1st support at 147.54 is identified as an overlap support, signifying its historical relevance as a potential strong support zone. Similarly, the 2nd support at 146.56 is characterized as an overlap support, further reinforcing its role as a key support level.
On the resistance side, the 1st resistance at 148.46 is noted as a point of significance and is associated with the presence of the 127.20% Fibonacci Extension, highlighting its potential as a point of resistance. Beyond the 1st resistance, the 2nd resistance at 149.17 is also important and corresponds to the presence of the 161.80% Fibonacci Extension, further emphasizing its significance.
USD/CAD:
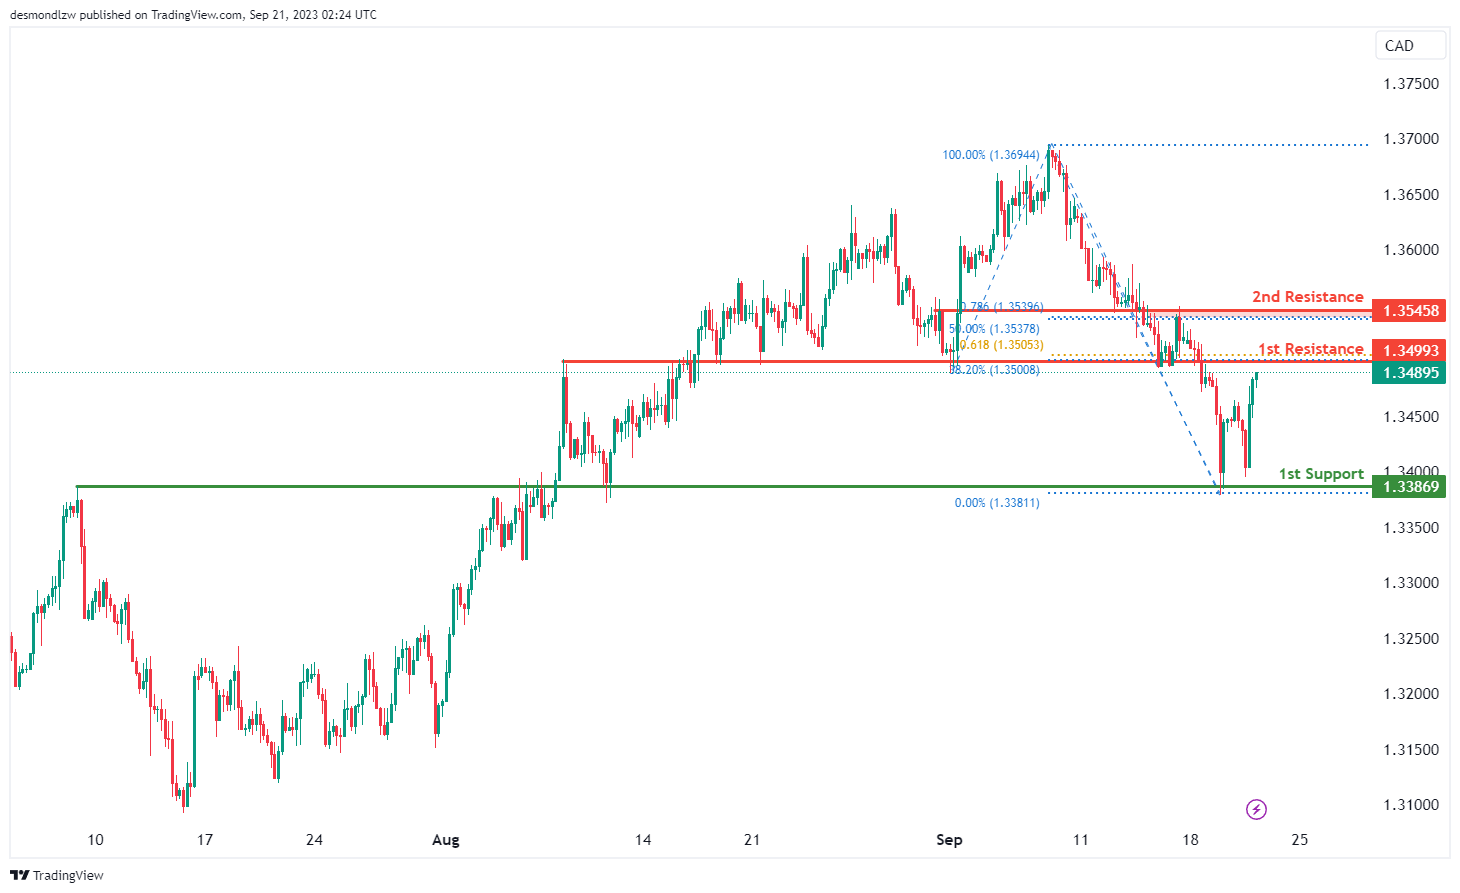
The USD/CAD chart is currently exhibiting an overall bullish momentum, indicating an upward trend with price making a bullish continuation towards the 1st resistance level.
The 1st resistance level at 1.3499 is identified as an overlap resistance that aligns with a confluence of Fibonacci levels i.e. the 38.20% retracement and the 61.80% projection levels. Higher up, the 2nd resistance level at 1.3549 is marked as a pullback resistance that also aligns with a confluence of Fibonacci levels i.e. the 50% retracement and the 78.60% projection levels.
To the downside, the 1st support level at 1.3387 is identified as an overlap support, indicating that it has previously acted as a strong support zone.
AUD/USD:
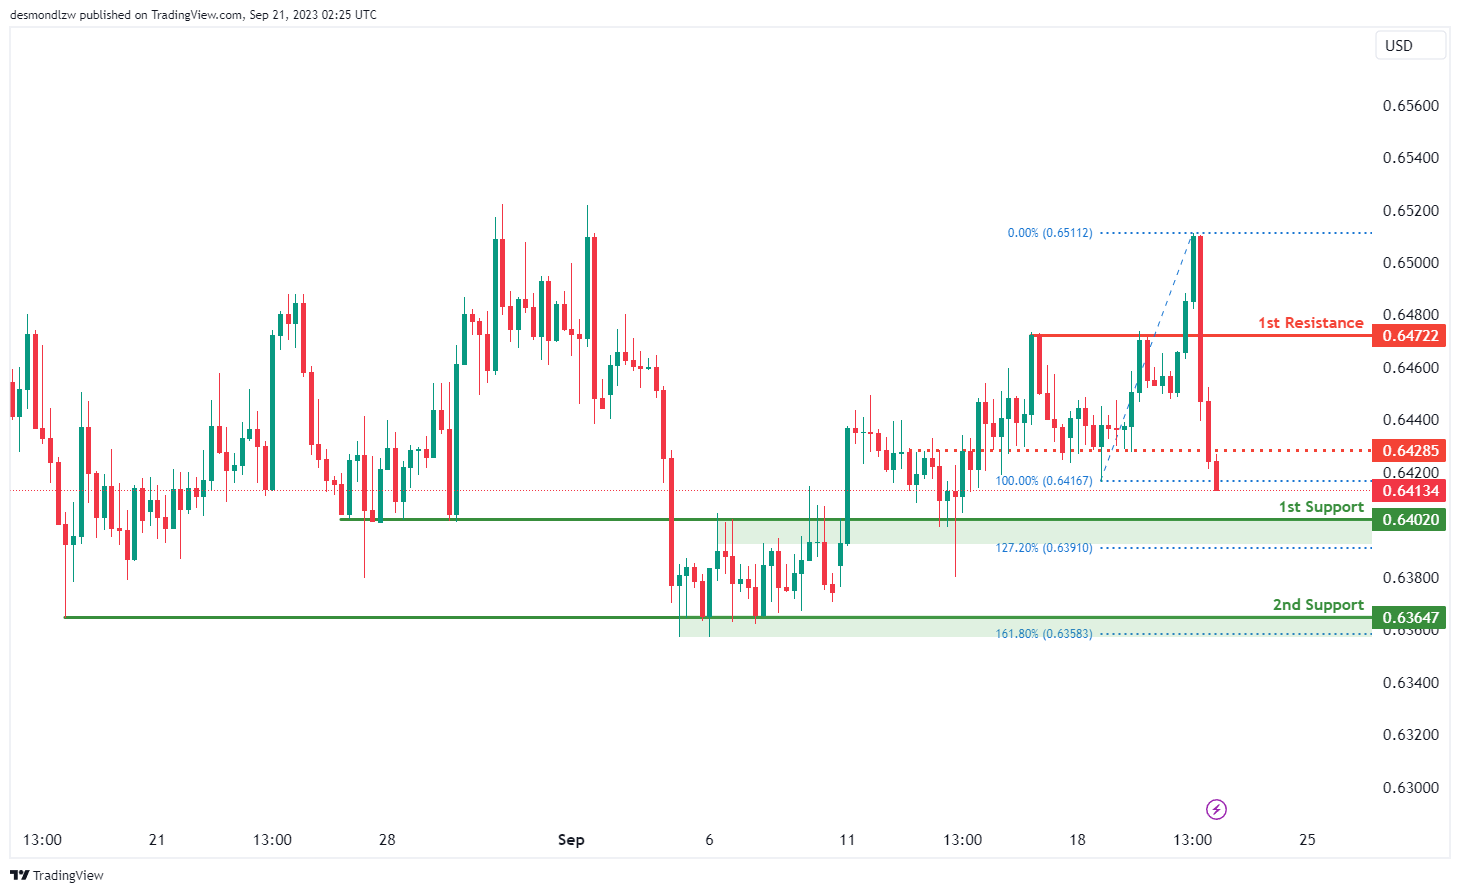
The AUD/USD chart is currently displaying an overall bearish momentum, suggesting a bearish continuation towards the 1st support level.
The 1st support level at 0.6402 is identified as an overlap support that aligns close to the 127.20% Fibonacci extension level while the 2nd support level at 0.6365 is identified as a pullback support.
To the upside, the intermediate support level at 0.6429 is identified as an overlap resistance while the 1st resistance level at 0.6472 is identified as a pullback resistance.
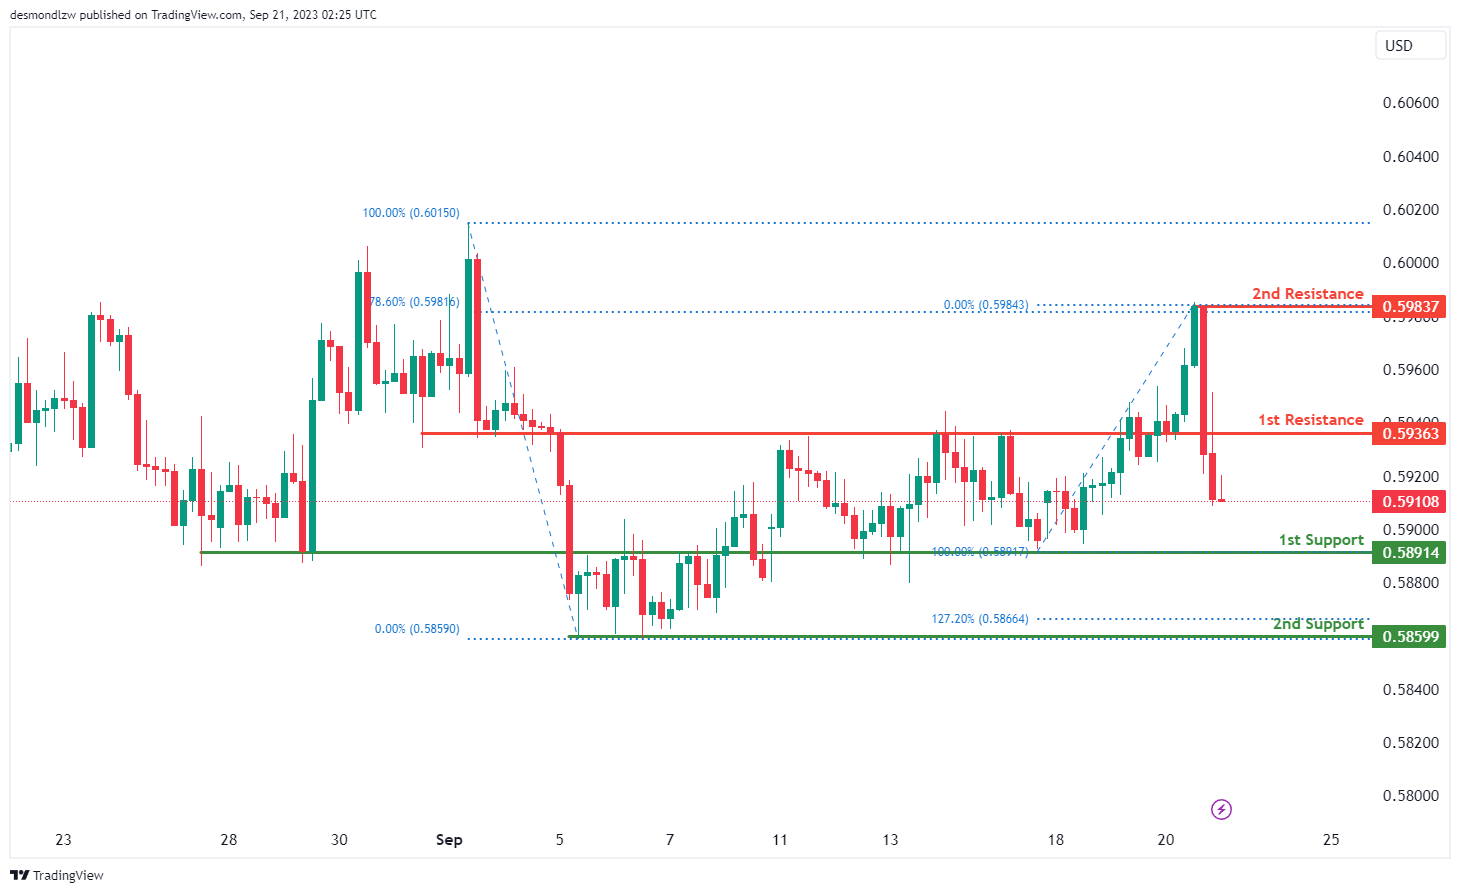
NZD/USD
The NZD/USD chart is currently displaying an overall bearish momentum, suggesting a bearish continuation towards the 1st support level.
The 1st support level at 0.5891 is identified as an overlap support while the 2nd support level at 0.5859 is marked as pullback support that aligns close to the 127.20% Fibonacci extension level.
To the upside, the 1st resistance level at 0.5936 is identified as an overlap resistance. Further up, the 2nd resistance level at 0.2984 is marked as a swing-high resistance that aligns with the 78.60% Fibonacci retracement level.
DJ30:
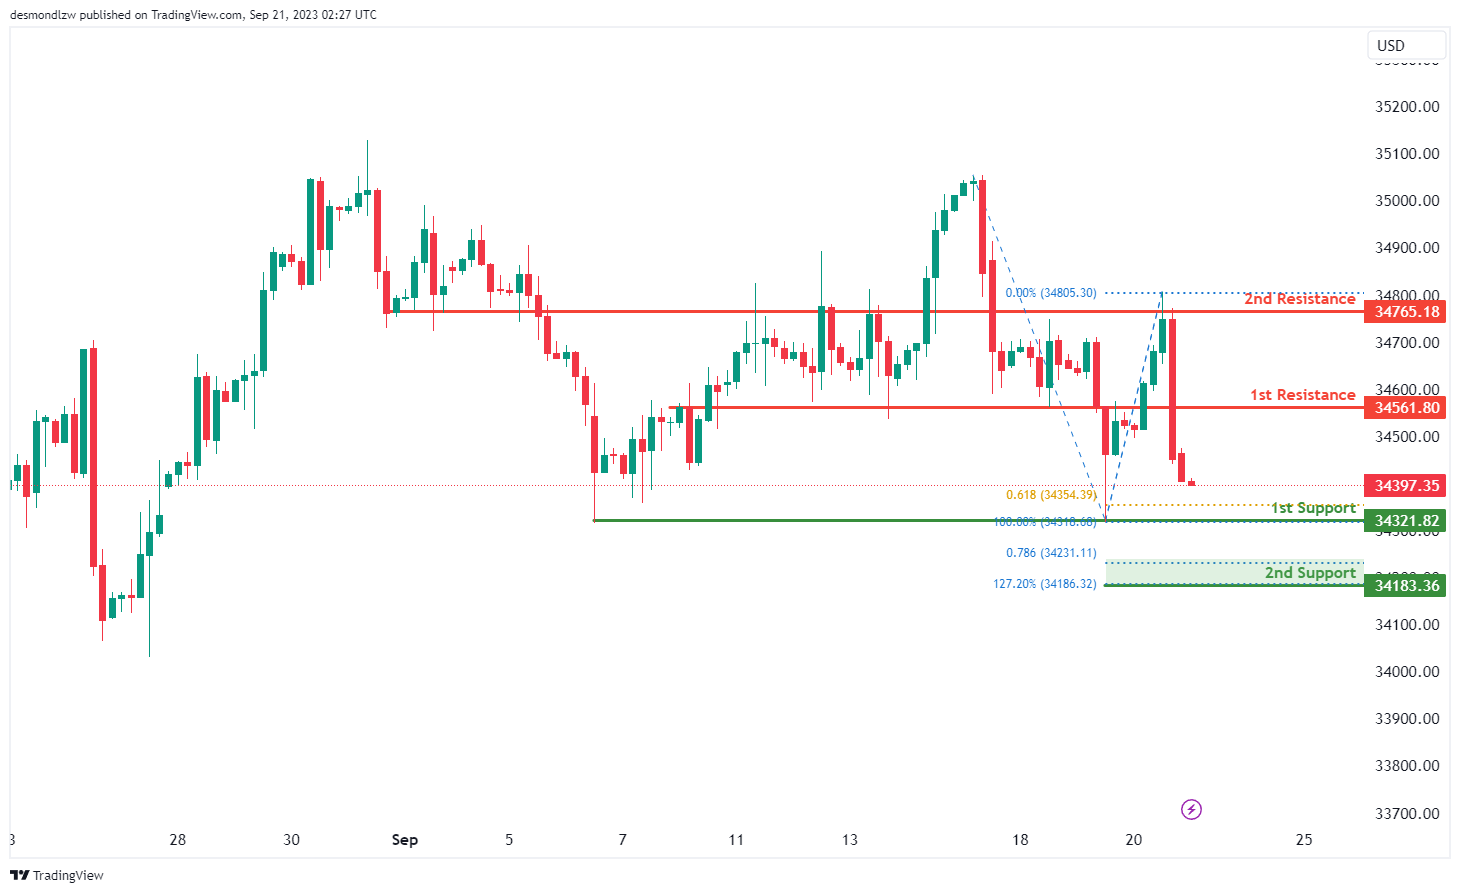
The DJ30 (Dow Jones Industrial Average) chart currently reflects a bearish overall momentum, indicating a prevailing downtrend in the market. Multiple factors contribute to this bearish sentiment.
There is a potential scenario where the price could continue its bearish movement towards the 1st support level at 34321.82. The 1st support level is characterized as a multi-swing low support, and it also aligns with a Fibonacci confluence, incorporating the 61.80% Fibonacci Projection. This confluence of technical indicators highlights the 1st support as a robust potential support zone within the current bearish trend.
Additionally, the 2nd support at 34183.36 is identified as a swing low support, and its significance is further reinforced by the presence of the 127.20% Fibonacci Extension and the 100% Fibonacci Projection, indicating a high degree of Fibonacci confluence. This emphasizes the importance of the 2nd support level as a key support zone.
On the resistance side, the 1st resistance at 34561.80 is categorized as a pullback resistance, suggesting its potential as a point of resistance within the ongoing bearish trend. Beyond the 1st resistance, the 2nd resistance at 34765.18 is characterized as an overlap resistance, further highlighting its significance as a potential resistance level.
GER30:
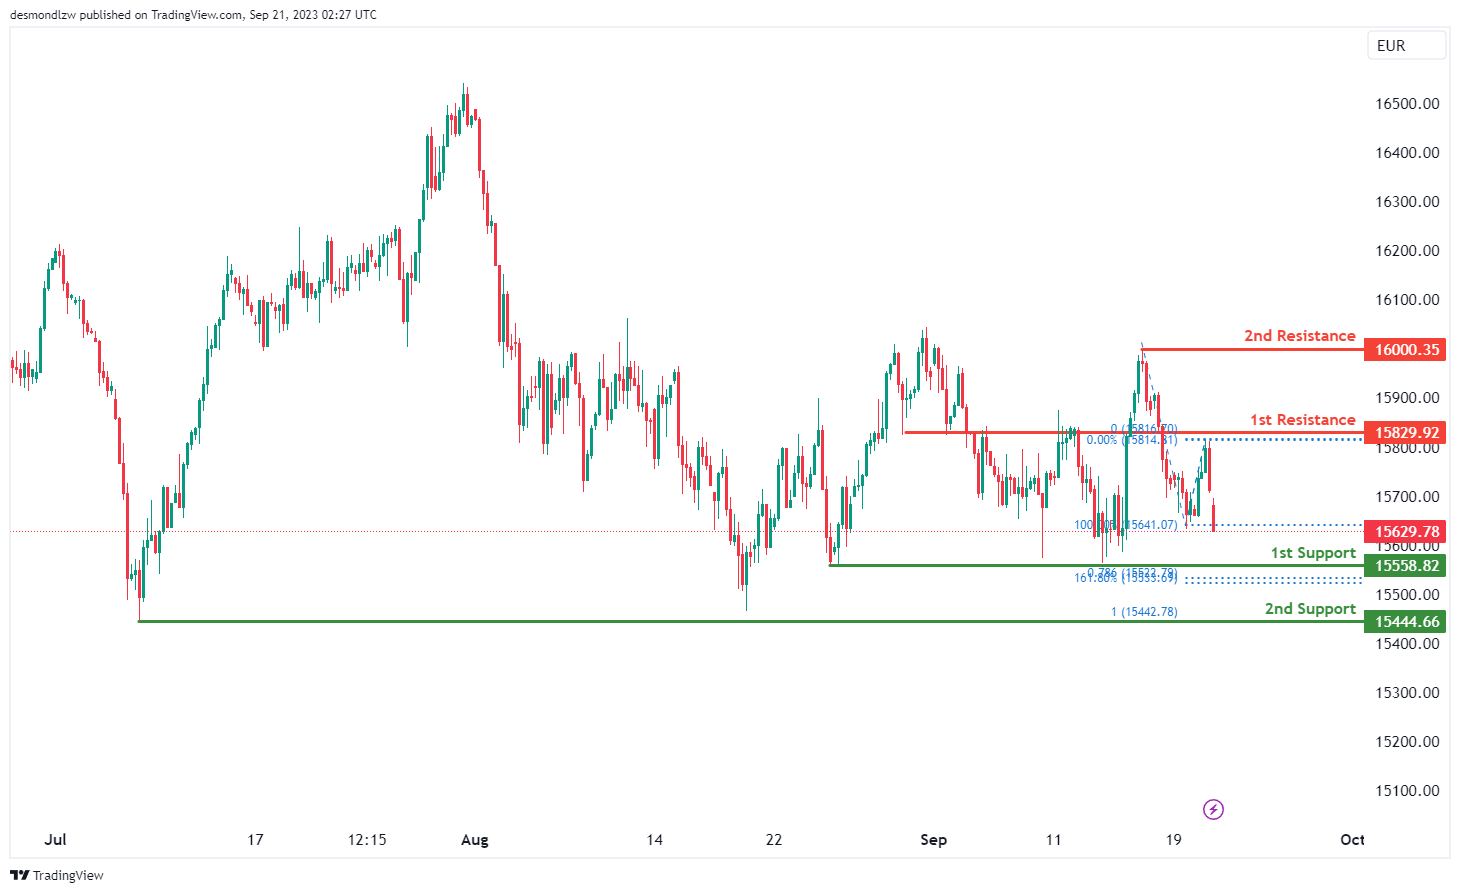
The GER30 (DAX) chart is currently exhibiting a bearish overall momentum, indicating a prevailing downtrend in the market. Several factors contribute to this bearish sentiment.
In this context, there’s a potential scenario where the price may continue its bearish movement towards the 1st support level at 15558.82. The 1st support is identified as a multi-swing low support, and it also coincides with a Fibonacci confluence, comprising the 78.60% Fibonacci Projection and the 161.80% Fibonacci Extension. This confluence of technical indicators suggests that the 1st support level holds significance as a strong potential support zone within the current bearish trend.
Furthermore, the 2nd support at 15444.66 is categorized as a swing low support and is reinforced by the presence of the 100% Fibonacci Projection, underlining its importance as a key support level.
On the resistance side, the 1st resistance at 15829.92 is characterized as an overlap resistance, signifying its potential as a point of resistance within the ongoing bearish trend. Beyond the 1st resistance, the 2nd resistance at 16000.35 is associated with a swing high resistance, highlighting its significance as a potential resistance level.
US500
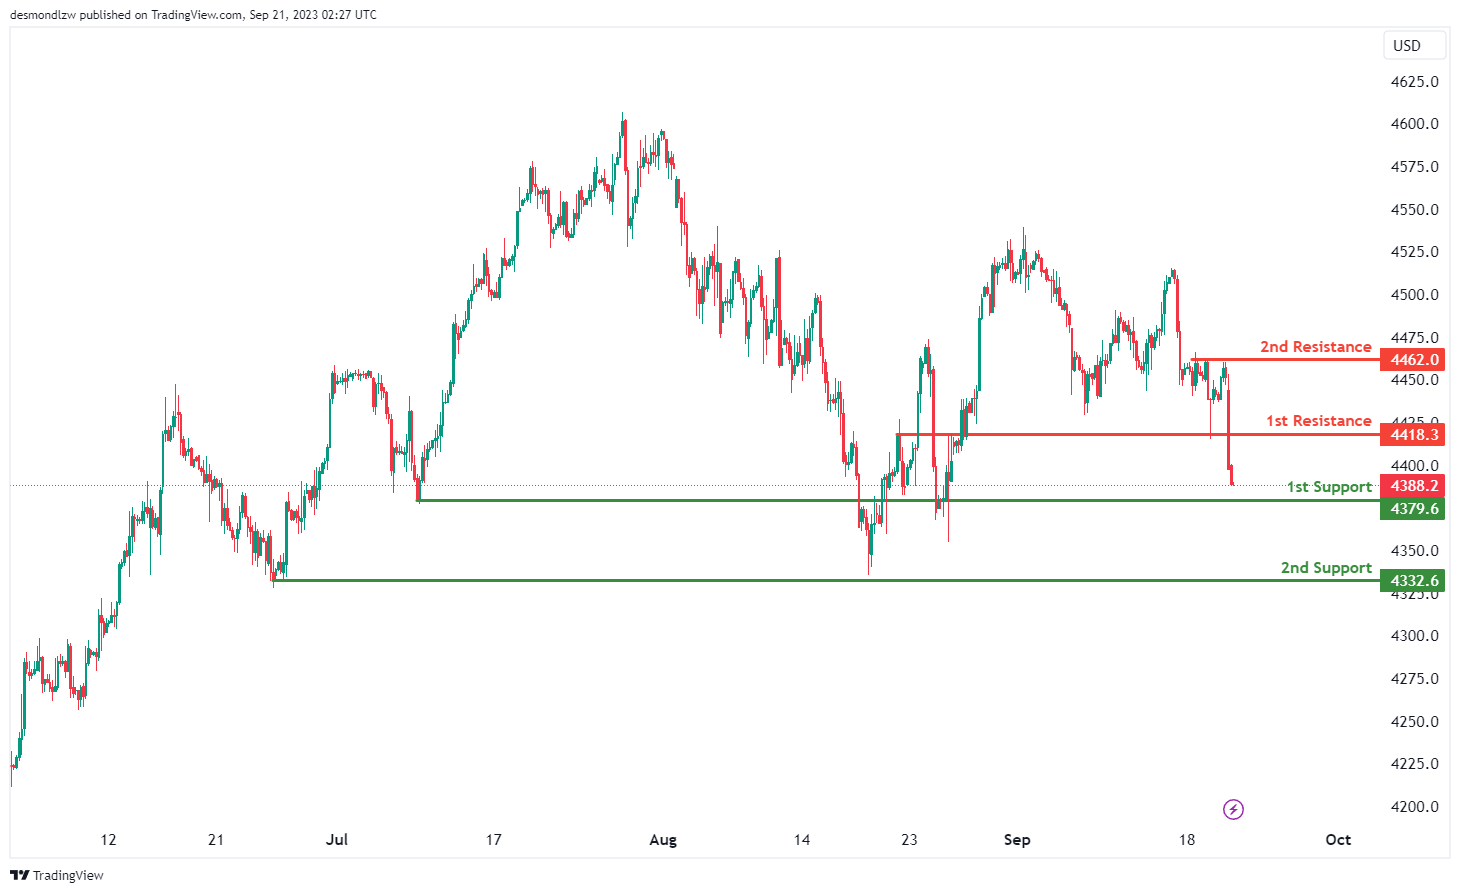
The US500 (S&P 500) chart currently exhibits a bearish overall momentum, suggesting a prevailing downward trend in the market. Several factors contribute to this bearish sentiment.
There’s a potential scenario where the price may continue its bearish movement towards the 1st support level at 4379.6. The 1st support is identified as an overlap support, indicating its potential as a strong support zone. Additionally, the 2nd support at 4332.6 is categorized as a multi-swing low support, further emphasizing its importance as a key support level within the current downtrend.
On the resistance side, the 1st resistance at 4418.3 is characterized as a pullback resistance, signifying its potential as a point of resistance within the ongoing bearish trend. Beyond the 1st resistance, the 2nd resistance at 4462.0 is associated with the presence of multi-swing high resistance, further highlighting its significance as a potential resistance level.
BTC/USD:
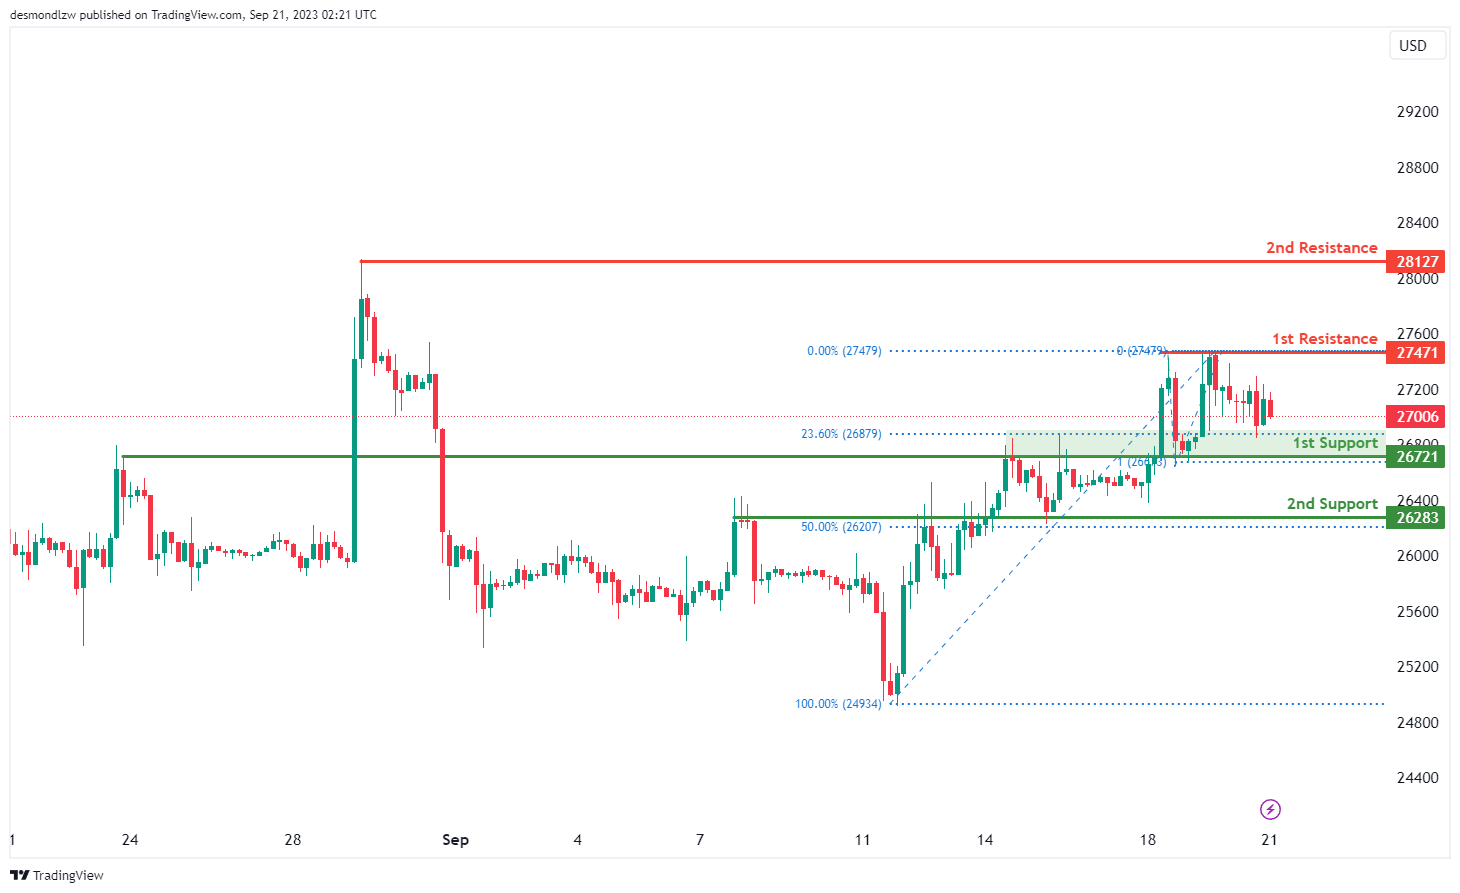
The BTC/USD chart currently exhibits a neutral overall momentum, indicating a lack of a clear directional bias in the market. Several factors contribute to this neutral sentiment.
In this context, there’s a possibility that the price may continue to fluctuate within the range defined by the 1st support and the 1st resistance levels. Traders should be prepared for potential price swings within this range while recognizing the absence of a strong bullish or bearish bias at this time.
The 1st support at 26,721 is identified as an overlap support and coincides with the presence of the 23.60% Fibonacci Retracement, signifying its potential as a key support zone. Similarly, the 2nd support at 26,283 is categorized as an overlap support, further emphasizing its importance as a potential strong support level.
On the resistance side, the 1st resistance at 27,471 is characterized as a multi-swing high resistance, indicating its potential as a point of resistance within the current range. Beyond the 1st resistance, the 2nd resistance at 28,127 is associated with the presence of a swing high resistance, further highlighting its significance.
ETH/USD:
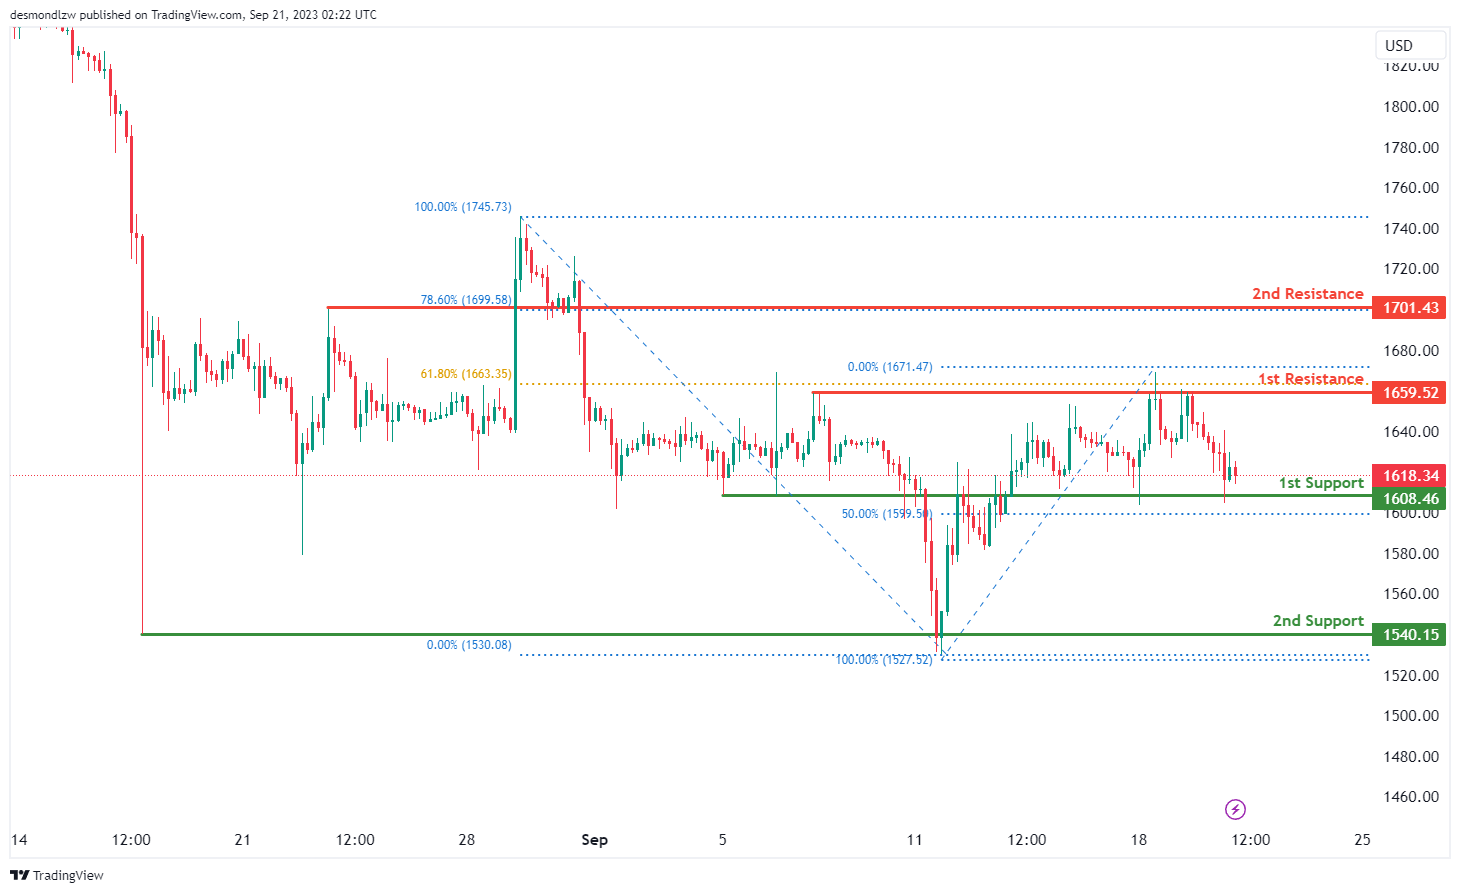
The ETH/USD chart currently maintains a neutral overall momentum, indicating a lack of a clear directional bias in the market. In this context, there’s a possibility that the price could continue to fluctuate within the range defined by the 1st support and the 1st resistance levels.
The 1st support at 1608.46 is identified as an overlap support, and it aligns with the presence of the 50% Fibonacci Retracement, suggesting its significance as a potential strong support zone. Similarly, the 2nd support at 1540.15 is categorized as a multi-swing low support, further reinforcing its role as a key support level.
On the resistance side, the 1st resistance at 1659.52 is characterized as a multi-swing high resistance, indicating its potential as a point of resistance within the current range. Beyond the 1st resistance, the 2nd resistance at 1701.43 is associated with the presence of the 78.60% Fibonacci Retracement, further emphasizing its importance as a potential resistance level.
WTI/USD:
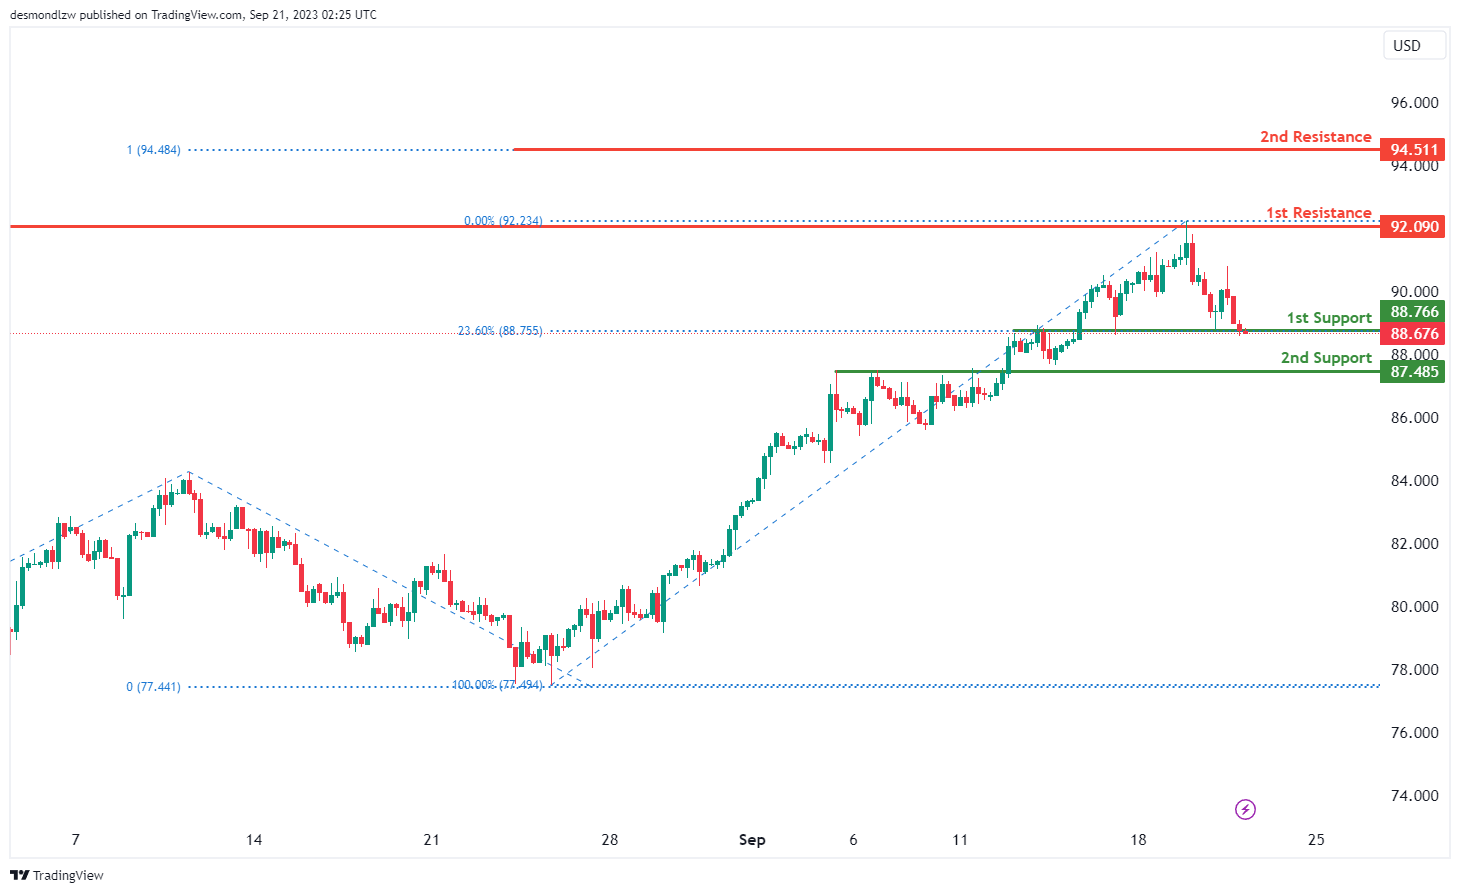
The WTI (West Texas Intermediate) chart currently exhibits an overall bearish momentum, suggesting a bearish break below the 1st support level with a potential continuation towards the 2nd support level.
The 1st support level at 88.77 is identified as an overlap support that aligns with the 23.60% Fibonacci retracement level while the 2nd support level at 87.49 is also marked as an overlap support.
To the upside, the 1st resistance level at 92.09 is identified as a multi-swing-high resistance. Further up, the 2nd resistance level at 94.51 is noted as a resistance that aligns with the 100.00% Fibonacci projection level.
XAU/USD (GOLD):
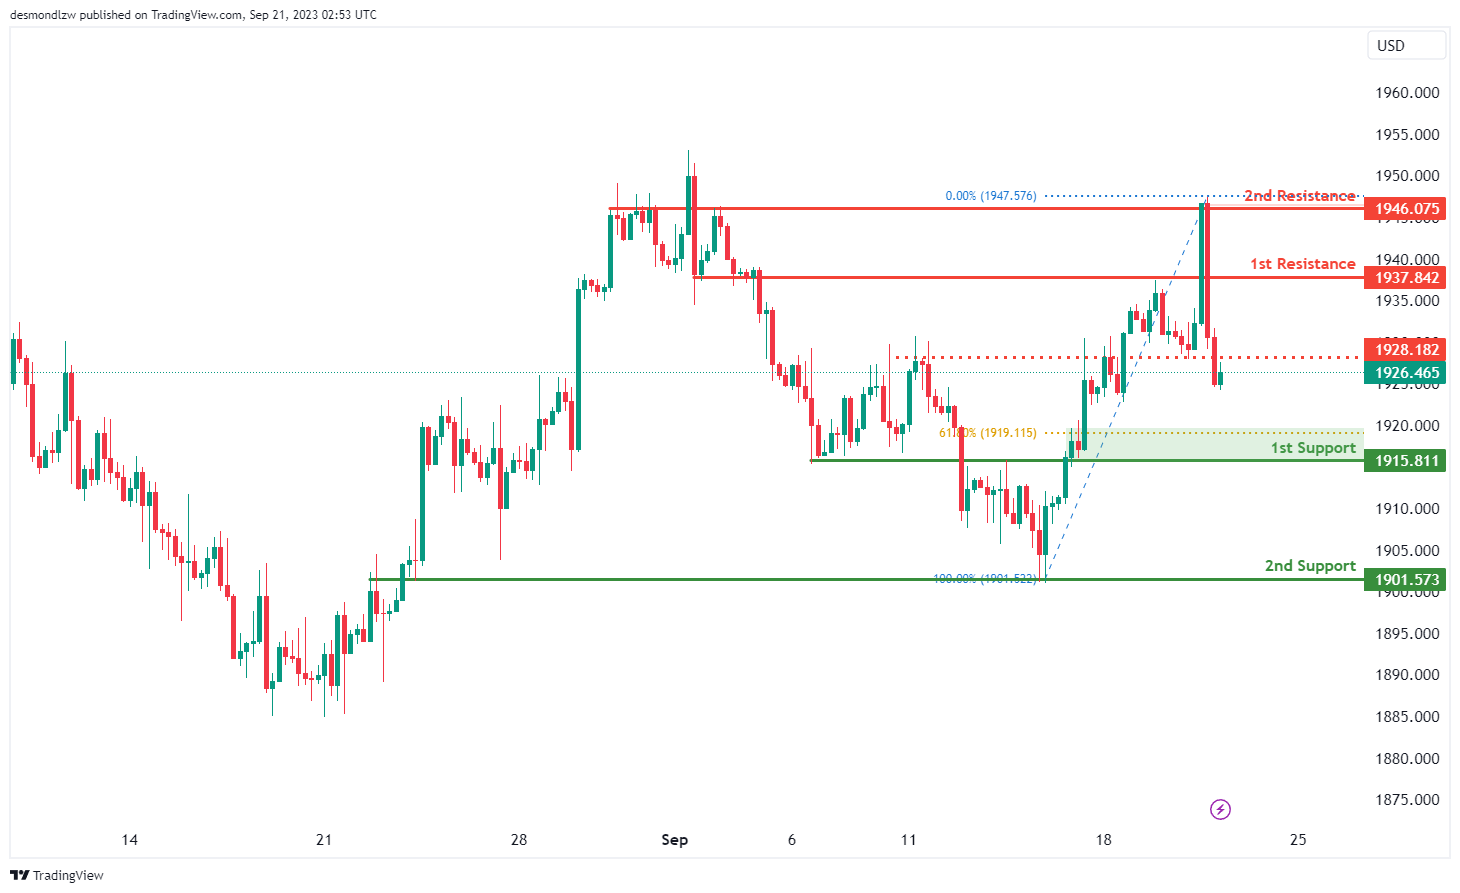
The XAU/USD chart currently exhibits a bearish overall momentum, with key factors contributing to its downward trajectory. In this context, there’s a potential scenario where the price may continue its bearish movement towards the 1st support level at 1915.81.
The 1st support at 1915.81 is identified as a pullback support, and it coincides with the presence of the 61.80% Fibonacci Retracement, signifying its importance as a significant support zone. Similarly, the 2nd support at 1901.57 is categorized as an overlap support, further emphasizing its potential significance as a key support level.
On the resistance side, the 1st resistance at 1937.84 is characterized as a pullback resistance and may serve as a point of resistance in the short term. Beyond the 1st resistance, the 2nd resistance at 1946.07 is identified as an overlap resistance, further highlighting its significance.
Additionally, there is an intermediate resistance level at 1028.18, categorized as a pullback resistance, which traders will monitor closely.
Elliott Wave View: Dollar Index (DXY) Should See Further Strength
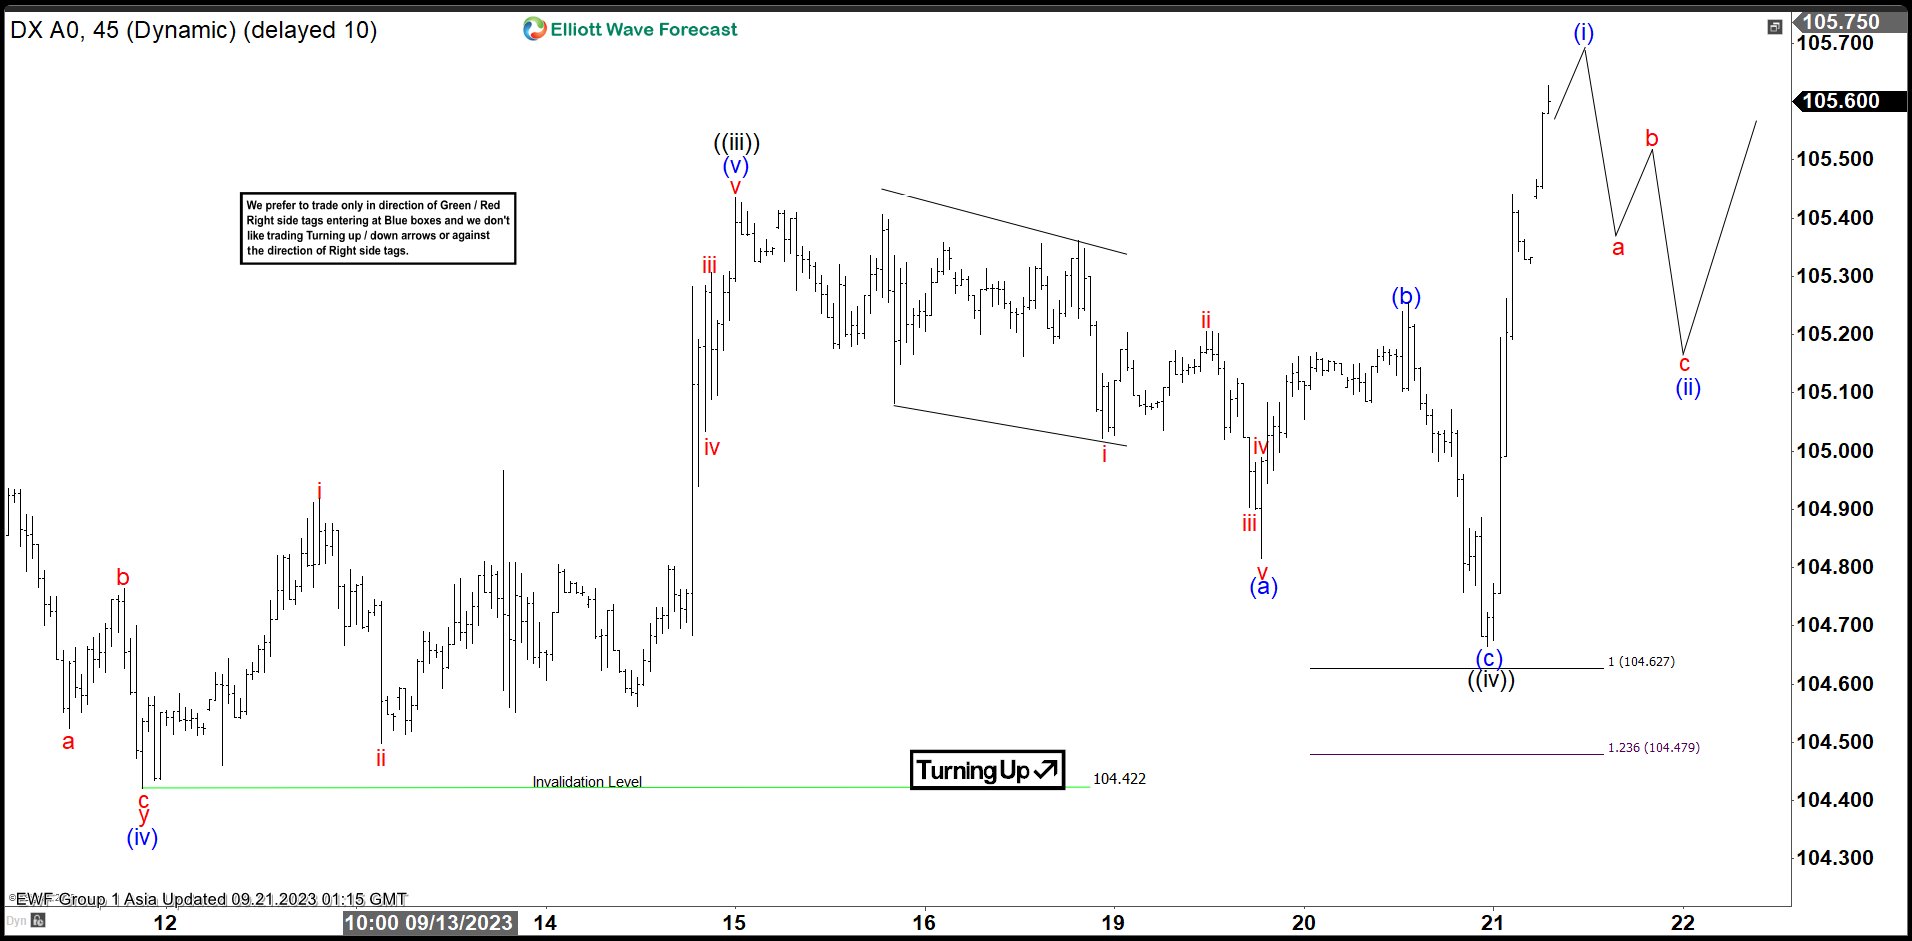
Short term Elliott Wave view suggests the USDX is correcting cycle from 9.28.2022 high in an expanded flat structure. Down from 9.28.2022 high, wave (A) ended at 100.82 and wave (B) is still ending a flat correction higher. Up from 100.82 wave A ended at 105.88. Then we saw 3 swings lower to end wave B at 99.58 and after that, the index rallied in wave C of (B). The dollar should be near to end wave (B) where market will turn lower in wave (C).
1 hour chart below shows wave ((iii)) of C ended at 105.43 high. Down from wave ((iii)), wave (a) ended at 104.82 and pullback in wave (b) ended at 105.25. Final leg higher wave (c) ended at 104.66 which completed wave ((iv)). Dollar index has resumed higher in wave ((v)). Currently, it is still developing wave (i) and once completed, the dollar should see 3, 7 or 11 swings lower to finish wave (ii) and rally again in wave (iii) of ((v)). The view is valid as stays above 104.66 low. A break below this level, open the possibility that wave ((v)) is ended and therefore wave C of (B).
USDX 60 Minutes Elliott Wave Chart
USDX Elliott Wave Video
https://www.youtube.com/watch?v=dPYNvBlh7DU
Crude Oil Price Remains In Uptrend Unless This Level Gives Way
Key Highlights
- Crude oil price rallied above the $90 and $92.50 resistance levels.
- A key bullish trend line is forming with support near $88.00 on the 4-hour chart.
- Gold prices failed to clear the $1,950 resistance.
- EUR/USD could recover if it clears the 1.0720 resistance.
Crude Oil Price Technical Analysis
Crude oil price started a fresh increase after a close above $88 against the US Dollar. The price rallied above the $90 and $90.50 resistance levels.
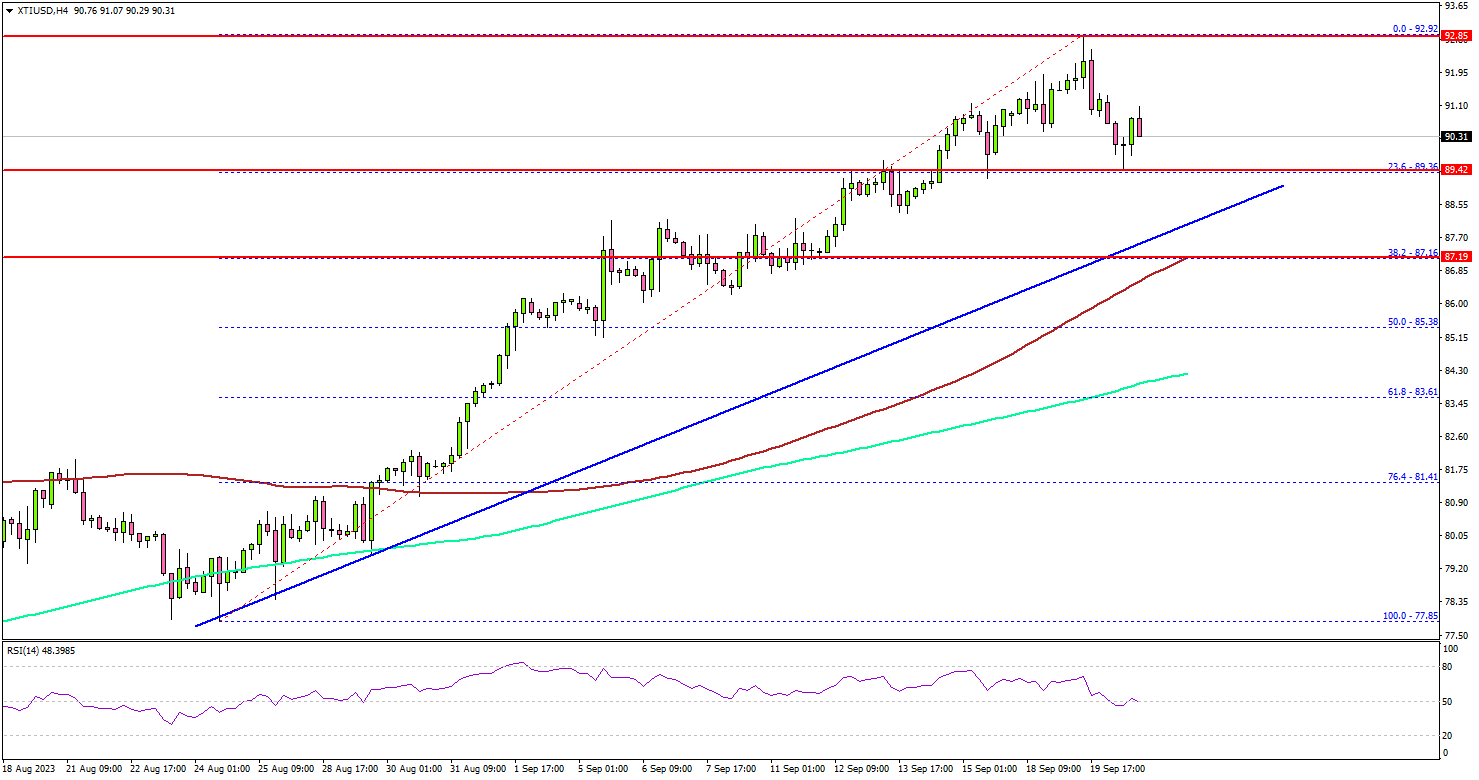
Looking at the 4-hour chart of XTI/USD, the price settled well above the $90 level, the 100 simple moving average (red, 4-hour) and the 200 simple moving average (green, 4-hour).
Finally, it traded to a new multi-week high at $92.92. Recently, there was a minor downside correction below the $91.20 level. However, the bulls seem to be active above the $89.40 level. The 23.6% Fib retracement level of the upward move from the $77.85 swing low to the $92.92 high is also near $89.40.
The next major support sits near the $88.00 zone. There is also a key bullish trend line forming with support near $88.00 on the same chart.
Any more losses might call for a test of the $87.15 support zone or a trend change and drop toward the $82.00 support zone.
On the upside, the price might face resistance near the $92.50 level. The next major resistance is near the $93.20 level, above which the price may perhaps accelerate higher. In the stated case, it could even visit the $95 resistance.
Looking at gold prices, there was a decent increase and the price was able to surpass the $1,935 resistance zone.
Economic Releases to Watch Today
- BoE Interest Rate Decision - Forecast 5.5%, versus 5.25% previous.
- US Initial Jobless Claims - Forecast 225K, versus 220K previous.
BoE and SNB looms as GBP/CHF awaits Clarity
Today, all eyes are firmly fixed on BoE and SNB rate decisions, which are poised to offer directional cues for the GBP/CHF, hopefully. The pair has been bounded in a constrained range for some time, hungry for a catalyst to redefine its movement.
On one hand, BoE is grappling with the aftermath of lackluster UK inflation data, leaving its imminent rate decision hanging in a delicate balance. The central bank faces two potential paths: embracing a hawkish hold akin to Fed, hence deferring a rate hike while keeping it in the future playbook, or mirroring ECB's strategy with a dovish hike, signaling a peak in the tightening cycle. This undetermined stance has metamorphosed the rate decision into somewhat of a coin toss.
Meanwhile, the consensus among analysts is leaning towards a 25bps hike by SNB, setting the interest rate at a neat 2.00%, thereby drawing the current cycle to a close. This perspective, held by a substantial majority of economists surveyed by Bloomberg, finds reinforcement in the upward revision of the 2024 inflation forecasts tabled by SECO yesterday.
Casting an eye on GBP/CHF, it is currently oscillating within a short-term range between 1.1053 and 1.1240. Presently, its trajectory is hard to pin down. The bearish sentiment is palpable with the pair capped below by 55 D EMA at 1.1709. However, this is offset by the steadfast support at 38.2% retracement of 1.0183 to 1.1574 at 1.1043.
For a clear bearish momentum to materialize, the cross would need to break the 1.1053 support, and then ensuring it sustainably trades below 1.1043 – a weekly close below this fibonacci level would solidify this stance. Yet, a spike lower, followed a substantial rebound could indicate a bullish reversal, hinting at a potential rise past 1.1240 resistance later, to extend the medium term range trading from 1.1574.
New Zealand’s Q2 GDP outperforms expectations with 0.9% qoq growth
New Zealand's GDP surged by 0.90% qoq in Q2, doubling the expected growth rate of 0.4%. This notable growth is significantly attributed to substantial boost in the business services sector, specifically within the realm of computer system design.
Despite a setback in the primary industries, which contracted by 1.9%, goods-producing industries and service sectors pulled their weight, recording a growth of 0.7% and 1.0% respectively. The service sector emerged as a strong pillar of economic advancement.
The quarter also saw manufacturing sector shake off its lethargy, reversing a trend of decline sustained over five consecutive quarters to contribute positively to the economic pie.
S&P 500 dips on Fed’s definitive hawkish stance
US equities ended their trading session in the red, following a definitive hawkish stance from Fed, even though interest rate was kept unchanged as expected. Fed sent a clear signal that another rate hike is still on the cards this year, and interest rate is going to stay higher for longer. Fed Chair Jerome Powell confirmed in the post meeting press conference, "We're in a position to proceed carefully in determining the extent of additional policy firming."
The new batch of economic projections divulged a prevailing sentiment among 12 of 19 Fed officials in favor of one more rate hike within this year. Investors were taken by surprise not by the rate hike anticipation but by the foreseeing of lesser rate cuts in 2024, a strategic shift attributed largely to the resilient labor market.
Furthermore, the projections hinted at a steeper path for interest rates in the years ahead. Median outlook for federal funds rate was adjusted upwards, settling at 5.1% for 2024, from a prior 4.6%, and 3.9% for 2025, up from 3.4%. This suggests that monetary policy will lean on the tighter side stretching into 2026. A 2.9% funds rate is projected for 2026, marking a divergence from the long-run neutral rate, which remains pegged at 2.5%.
More on Fed:
- Fed Review: Upbeat on Growth
- Message from FOMC Meeting: Higher for Longer
- Fed React: Dollar Pares Earlier Losses after Fed's Attempt of a Hawkish Skip
- Fed stands part, 12 members see one more hike
Reflecting these developments, S&P 500 took a dip, shedding -0.94% or -41.75 points to conclude at 4402.20. In a technical context, S&P 500's movements stemming from 4607.07 are perceived a correction pattern. D deeper slide is on the cards to 4335.31 or even lower.
However, robust support levels are anticipated around the 38.2% retracement of 3491.58 to 4607.07 at 4180.95. This is expected to limit further losses, at least at first attempt. Meanwhile, a close above 55 D EMA (now at 4438.25) will neutralize the bearish outlook.
NZ First Impressions: GDP June Quarter 2023
New Zealand's GDP rebounded 0.9% in the June quarter and there were small upward revisions to the prior two quarters. This suggests more pressure on resources than the RBNZ has been estimating.
NZ GDP, June quarter 2023
- Quarterly change: +0.9% (last: 0.0%, Westpac f/c: +0.8%, market f/c: 0.4%, RBNZ +0.5%)
- Annual change: +1.8% (Last +2.4%, Westpac f/c +1.5%, RBNZ +1.2%)
- Annual average change: +3.2% (Last: +2.9%)
As widely anticipated, New Zealand’s GDP rebounded in the June quarter. Indeed, Statistics NZ reported a 0.9% lift in production – an outcome was well above the market forecast of 0.4% and the Reserve Bank’s most recent forecast of 0.5%. However, it was just 0.1ppts firmer than Westpac’s top of the market estimate of 0.8%.
Adding to today’s surprise were small upward revisions to prior quarters, with the recent December and March quarters revised to -0.5% and 0.0% respectively from -0.7% and -0.1% previously (i.e., the technical recession has been revised away, at least for now). As a result, annual growth in the year through to June stands at 1.8%, which is 0.6ppts above the RBNZ’s forecast and 0.3ppts above our estimate. After allowing for all revisions, the overall size of the economy in the June quarter is 0.5% larger than the RBNZ had estimated in the August MPS.
A portion of that forecast error will likely feed into the RBNZ’s estimate of the output gap, at the margin lifting the Bank’s estimate of the degree of inflation pressure that remained in the economy during that quarter. Given the ongoing uncertainty surrounding these figures – including the likelihood of future revisions – we think that the RBNZ will also choose to draw inference from a wider array of economic indicators in assessing how excess demand and inflation pressures are evolving, including developments in the labour market. Even so, we think that today’s data adds to the likelihood that the RBNZ will, at some point, feel the need to act on the slight tightening bias that it indicated last month.
Stepping back from the recent volatility in quarterly GDP outcomes, momentum in the economy is slowing with annual growth of 1.8% in the year to June down from the (upwardly revised) 2.4% growth recorded in the year to March. The economy is growing at a below trend pace, as reflected in the gradual increase in the unemployment rate over the past year. While rapid population growth is supporting demand, it is also helping to boost the economy’s productive capacity, and over the past three quarters cumulative output has declined in per capita terms. So despite today’s data, with past monetary policy tightening steadily gaining traction as mortgages are refinanced, and low commodity prices now weighing on rural incomes, we expect the economy will continue to flirt with recession over the coming quarters. Indeed, the BNZ-BusinessNZ PMIs suggest that the economy may be contracting in the current quarter, and annual growth in the year to September is likely to be close to nil.
As a result, we expect that the unemployment rate will remain on an upward trajectory, contributing to a gradual easing of inflation pressures. However, especially after today’s release, it remains to be seen whether inflation pressures will dissipate quickly enough to satisfy the RBNZ. On that score, attention will now turn to the various cost and pricing indicators in next month’s QSBO business survey and in the September quarter CPI report.
Detail
There were no huge surprises in the industry detail of today’s GDP report, which was broadly in line with what had been signalled by the various partial indicators released in recent weeks. As we had expected growth was driven by the services sector, with especially strong growth recorded in the public administration and safety sector (+2.8%) and business services sector (+2.1%). The education and training sector, transport and storage, and utility sectors also reported strong growth this quarter.
On the negative side, as expected growth was weighed down by lower activity in the retail trade and accommodation (-1.0%) and wholesale trade (-0.5%) and sectors. There were also declines in the forestry, fishing and construction sectors.
The expenditure-based measure of GDP, which is a slightly more volatile measure of activity, increased 1.3% in the June quarter and 1.9% in the year to June. This measure indicated a strong rebound in exports and strong growth in business investment and government consumption spending.
Fed Review: Upbeat on Growth
- The Fed maintained Fed Funds Rate target unchanged at 5.25-5.50% as widely anticipated, but surprised hawkishly with clearly more optimistic projections.
- Median growth forecasts were revised higher for 2023-2024, warranting a 50bp upward revision to both 2024 & 2025 median rate projections.
- We remain more pessimistic on the economic outlook, and make no changes to our Fed call. We still expect no further rate hikes, and quarterly 25bp cuts starting from Q1 2024.
Powell delivered a 'hawkish hold', as the updated economic projections outlined an optimistic path towards soft(-er) landing. Real GDP forecasts were revised up to 2.1% (from 1.0%) for 2023 and 1.5% (from 1.1%) for 2024, while inflation forecasts only received minor adjustments. Median forecast for unemployment rate was also revised higher, with the peak now seen at only 4.1% in 2024-2025 (from 4.5%).
Powell underscored that the more optimistic growth outlook warrants rates remaining higher for longer, and the median 'dots' were revised up by 50bp for both 2024 (5.1%) and 2025 (3.9%). Markets erased some of the cuts priced in for 2024, with 2y UST yield rising some 12bp. Powell mentioned solid realized data and recovering real income growth as factors lifting the outlook, and while the looming government shutdown and UAW strike were seen as downside risks, they have not materially impacted the baseline view for now.
The FOMC statement was mostly unchanged, economic growth was described as 'solid' rather than 'moderate' while job gains were seen 'slowing' rather than 'robust'. Powell also maintained strong emphasis on data-dependency.
A key factor driving the renewed hawkish market reaction during the press conference was Powell's surprisingly open view regarding potentially higher neutral rate. While the longer-term Fed Funds Rate estimate was unchanged at 2.5%, Powell mentioned that it does not necessarily suggest that neutral rate could not be higher, which in turn would suggest monetary policy is not as restrictive as previously thought. While not our base case, we discussed the idea and potential drivers back in August, see Research US - Could investment boom pave the way for a soft landing?, 22 August.
In any case, the Fed anticipates that the economy is going to remain more resilient to the effects of restrictive monetary policy than we do. In our Fed preview, 15 September, we highlighted recent tightening in financial conditions and already restrictive level of real rates are key headwinds for the economy, and ever since the latest University of Michigan consumer survey confirmed a further decline in inflation expectations. Powell explicitly mentioned that higher real rates due to declining inflation could warrant earlier rate cuts, and we still stick to our view of quarterly 25bp cuts starting from Q1 2024.
Also, while the 'dots' were 7-12 in favour of one more rate hike later in the year, we doubt it will materialize. This would imply downward pressure on UST yields going forward, but if we will be proven too pessimistic on our macro outlook by incoming data, rates are likely to remain higher for longer than what we assume.
FX: Near-term USD tailwinds could be fading
EUR/USD moved lower around a half figure on the hawkish hold from the Fed. The outcome was about as hawkish as the Fed could have engineered without actually delivering a surprise hike. Despite the ongoing USD strength, we think there could be some potential for some EUR/USD tailwinds in the near-term. We think that peak policy rates, improving manufacturing sector relative to the service sector and/or easing pessimism priced on China could add some support to EUR/USD within the next month. On the longer horizon, however, we maintain our strategic case for a lower EUR/USD, expecting the cross at 1.03 in 12M.