Sample Category Title
UK public anticipates elevated inflation and ascending interest rates, BoE survey reveals
Bank of England/Ipsos Inflation Attitudes Survey for August has shed light on how the public perceives inflation trends and the likely moves by the central bank.
Interestingly, public's perception of current inflation rate seems to have moderated, with a median estimate of 8.6%. This is a full percentage point decline from 9.6% recorded in May. This suggests that the public may feel the worst of inflationary surge has passed.
However, expectations for inflation over the short to medium term are slightly more elevated. The median expectation for inflation over the next year stood at 3.6%, a modest uptick from 3.5% three months ago. Looking a bit further out, the 12-month period after next, expectations rose to 2.8% from 2.6% in the prior survey.
Regarding BoE's policy path, a significant 63% anticipate interest rate hike over the next year, marking an increase from 57% in May. Meanwhile, those expecting rates to remain stable accounted for 19%, a slight decrease from prior reading of 20%.
Full Bank of England/Ipsos Inflation Attitudes Survey release here.
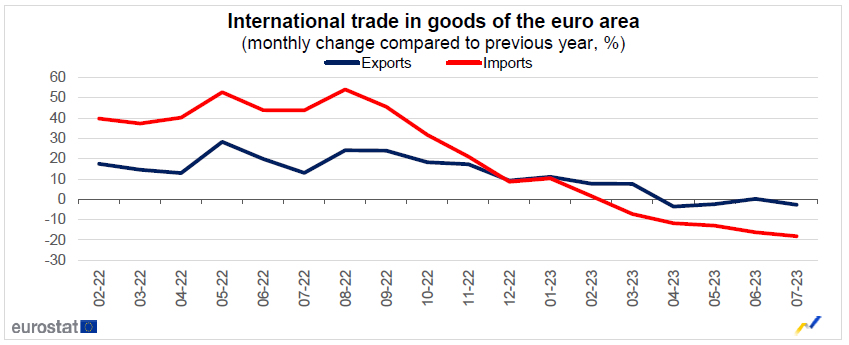
Eurozone goods expects down -2.7 yoy, imports fell -18.2% yoy
Eurozone exports of goods to the rest of the world dropped -2.7% yoy to EUR 227.8B in Jul. Imports fell -18.2% yoy to EUR 221.3B. Eurozone recorded EUR 6.5B trade surplus. Intra-Eurozone trade fell -7.9% yoy to EUR 211.8B.
In seasonally adjusted term, exports fell -1.7% mom to EUR 232.6B. Imports rose 0.7% mom to EUR 229.7B. Trade surplus narrowed from EUR 8.6B to EUR 2.9B, smaller than expectation of EUR 13.5B. Intra-Eurozone trade fell slightly from EUR 219.3B to EUR 218.7B.
Resilient Chinese Yuan Supporting Hong Kong Equities and Antipodean Currencies
- Yesterday’s significant US dollar up moves against the EUR, GBP, and CHF have not spread to the Chinese yuan and antipodean currencies.
- The choice of China’s central bank, PBoC latest monetary policy easing measure via a cut on the required reserves ratio and upbeat retail sales and industrial production have led to a short-term “K-shaped performance” seen in the FX market.
- Short-term bullish momentum elements are sighted in AUD/USD and NZD/USD supported by a weakening USD/CNH.
Despite the European Central Bank (ECB) hike of 25 basis points to bring its policy deposit rate to 4%, market participants have viewed that as a dovish hike that triggered a significant rally in the US dollar against the Euro that has also spilled over to other European currencies such as the UK pound and the Swiss franc.
The EUR/USD tumbled by 85 pips to close yesterday, 14 September US session at 1.0644 and breached below the recent closing level’s swing lows of 31 May and 6 June reinforced by the latest ECB’s economic forecast on the Eurozone which has painted a stagflation condition; 2024’s inflation projection is upgraded to 3.2% while GDP growth is being trimmed downwards to 1% for 2024.
Not all currencies are sucked into a USD’s bullish vacuum
Interestingly, the antipodean currencies (AUD and NZD), CAD, and JPY did not manage to get ramped down by the US dollar’s bulls inflicted on the European currencies. It is likely the resilient Chinese yuan is playing either a direct or indirect role in the short-term “K-shaped” performance seen in the FX market (see chart of figure 1).
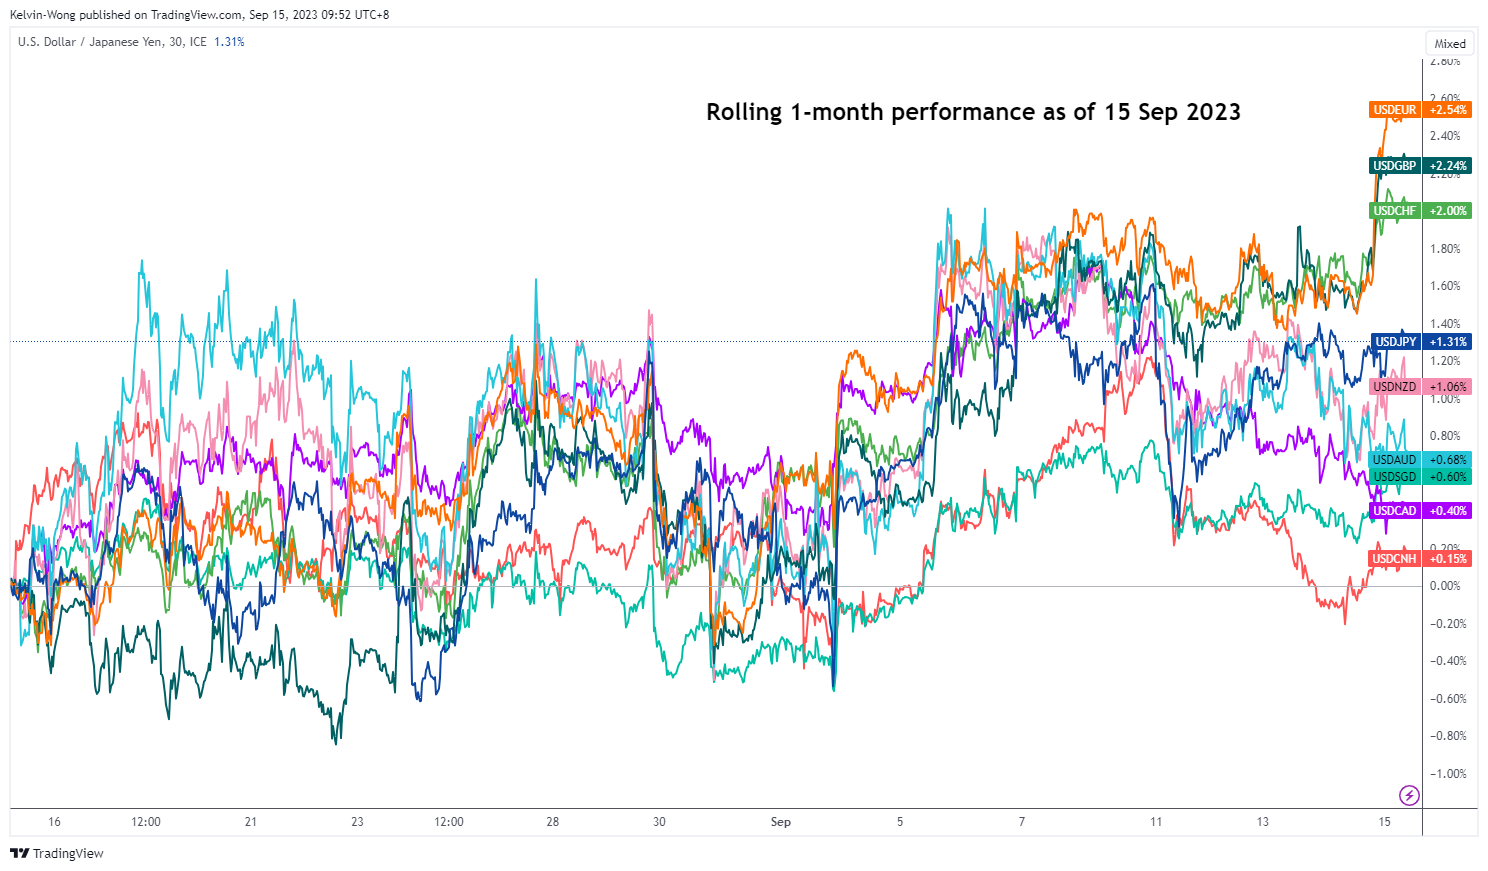
Fig 1: Rolling 1-month performance of the US dollar against the major currencies, AUD, NZD, CNH & SGD as of 15 Sep 2023 (Source: TradingView, click to enlarge chart)
China’s central bank PBoC’s latest monetary policy stimulus manoeuvre does not involve a direct cut on the 1-year medium-term lending facility rate, a key policy interest rate but rather a reduction on China’s commercial banks’ reserve requirement ratio by 25 basis points, a second reduction on the ratio so far this year.
USD/CNH major uptrend’s momentum has started to ease
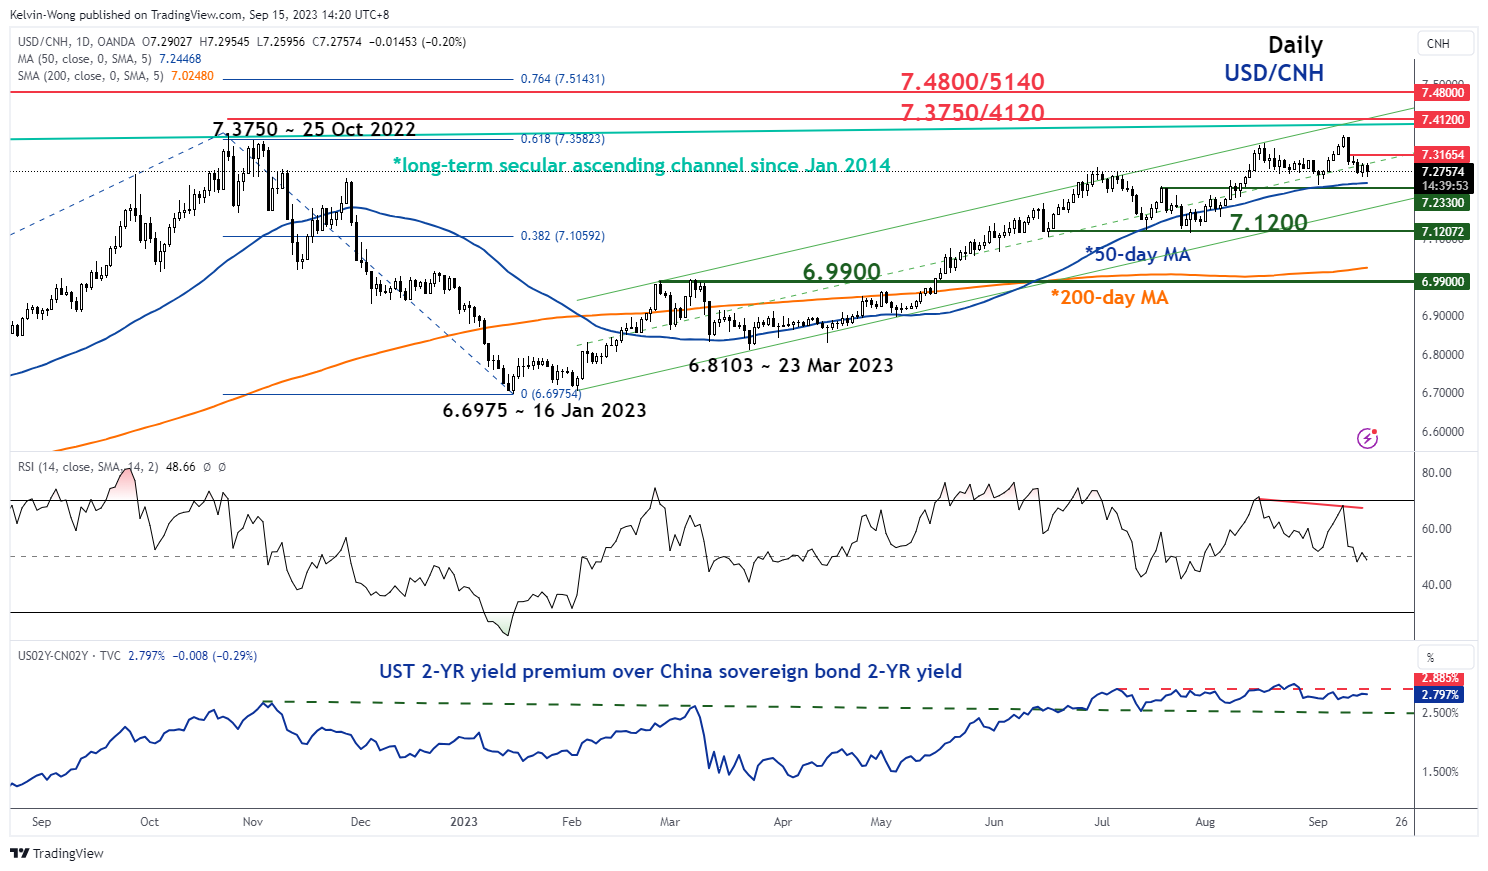
Fig 2: USD/CNH major & medium-term trends as of 15 Sep 2023 (Source: TradingView, click to enlarge chart)
Thus, by leaving interest rates unchanged in China, the upward pressure on the shorter-term US Treasuries yield premium over China’s sovereign notes is likely to be negated which in turn may choke off potential near-term US dollar strength against the offshore yuan that lead to a bullish tapering of the current major uptrend phase of the USD/CNH in place since 16 January 2023 low to allow the pair to consolidate between 7.3165 and 7.2330 (also the 50-day moving average) in the short-term.
Also, fundamental factors are also supporting today’s minor yuan strength against the US dollar. China’s retail sales for August have come in at 4.6% y/y, above the consensus of 3%, and surpassed July’s 2.5% y/y, its strongest pace of growth since May.
August’s industrial production in China also managed to beat expectations of 3.9% with a growth of 4.5% y/y, its highest reading since April.
All in All, this latest set of key economic data suggests that the risk of a deflationary spiral in China has abated by another notch.
How does it impact the Aussie and the Kiwi?
From a momentum and technical analysis standpoint, the AUD and NZD have a rather high direct correlation with the CNH (offshore yuan), and from a fundamental aspect, Australia’s commodities producers/trading firms are dependent either directly or indirectly on the fortunes of China’s economy.
Hence, a slowdown in the bullish trend of the USD/CNH is likely to lead to some form of bullish momentum to ignite the AUD/USD and NZD/USD. Let’s look at their respective short-term technical charts.
AUD/USD is forming a potential minor bullish double-bottom base
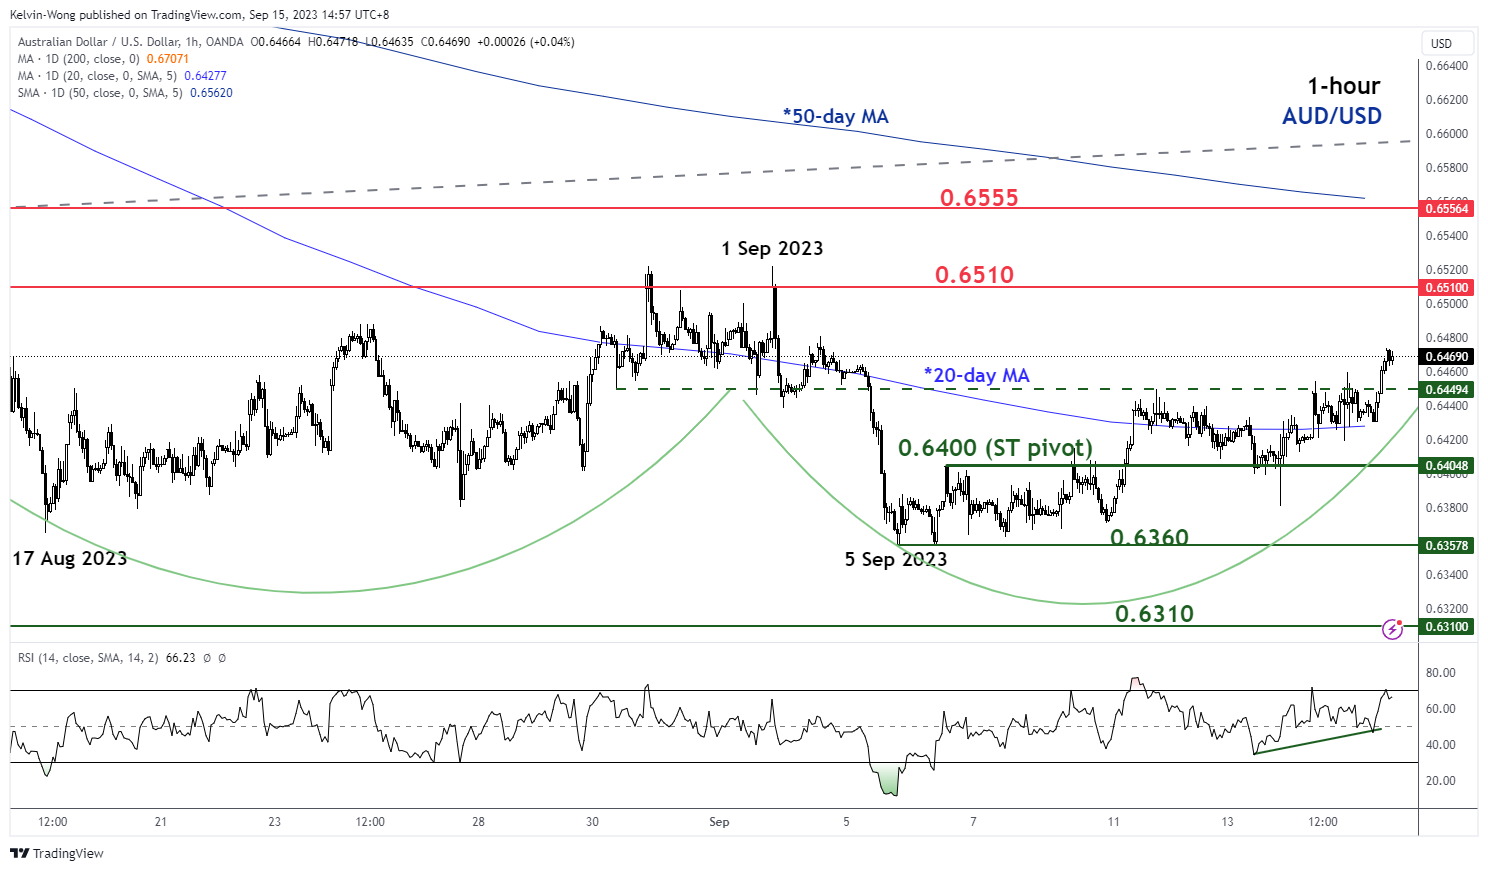
Fig 3: AUD/USD minor short-term trend as of 15 Sep 2023 (Source: TradingView, click to enlarge chart)
As seen on the 1-hour chart, the price actions of the AUD/USD have failed to have a clean break below the 17 August 2023 low of 0.6365 in the past two weeks since the start of September.
Today’s price action has tested and rebounded significantly from the 20-day moving average which suggests an emergence of bullish momentum at least in the short term. If the 0.6400 key short-term pivotal support is not broken down, the AUD/USD may see a further potential push-up towards the intermediate resistance at 0.6510 (the neckline of the minor double bottom base). Above 0.6510 sees the next resistance at 0.6555 (the 50-day moving average).
On the flip side, failure to hold at 0.6400 negates the bullish tone for a slide back toward the minor base support at 0.6360.
NZD/USD’s recent minor drop is supported by an ascending trendline
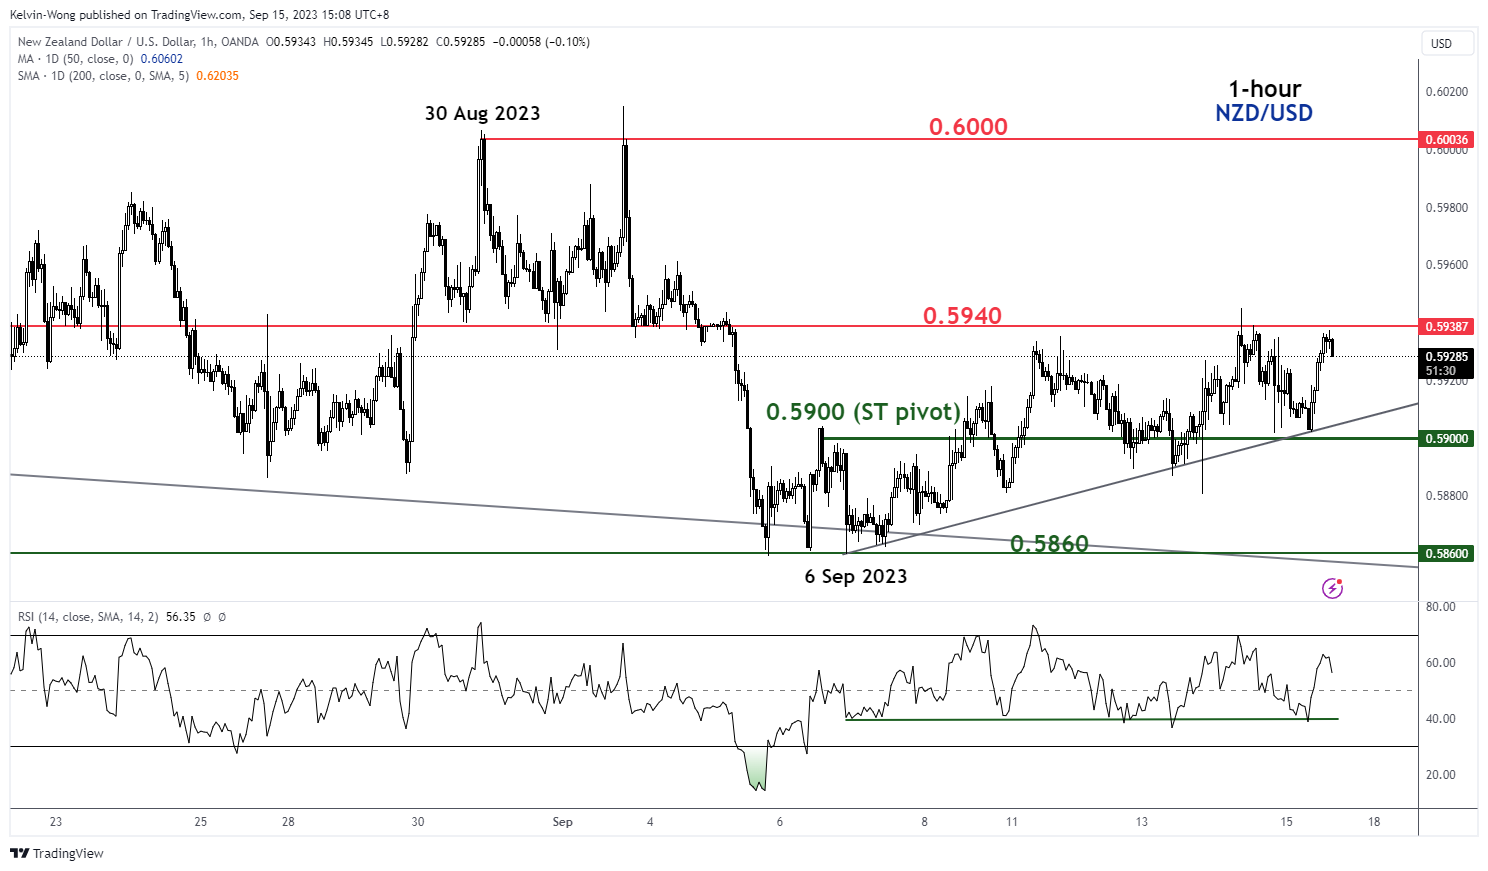
Fig 4: NZD/USD minor short-term trend as of 15 Sep 2023 (Source: TradingView, click to enlarge chart)
The technical elements seen in the NZD/USD are not as bullish as the AUD/USD but since its 6 September 2023 low, the price actions have traced out a series of “higher lows” and an ascending trendline is now acting as a support at around 0.5900.
Watch the 0.5900 key short-term pivotal support and a clearance above 0.5940 intermediate resistance may trigger a more pronounced bullish momentum towards the next resistance at 0.6000.
However, a break below 0.5900 may see another round of choppy movement to retest the 6 September 2023 swing low of 0.5860.
Benchmark Hong Kong stock indices are looking to end on positive weekly closing levels
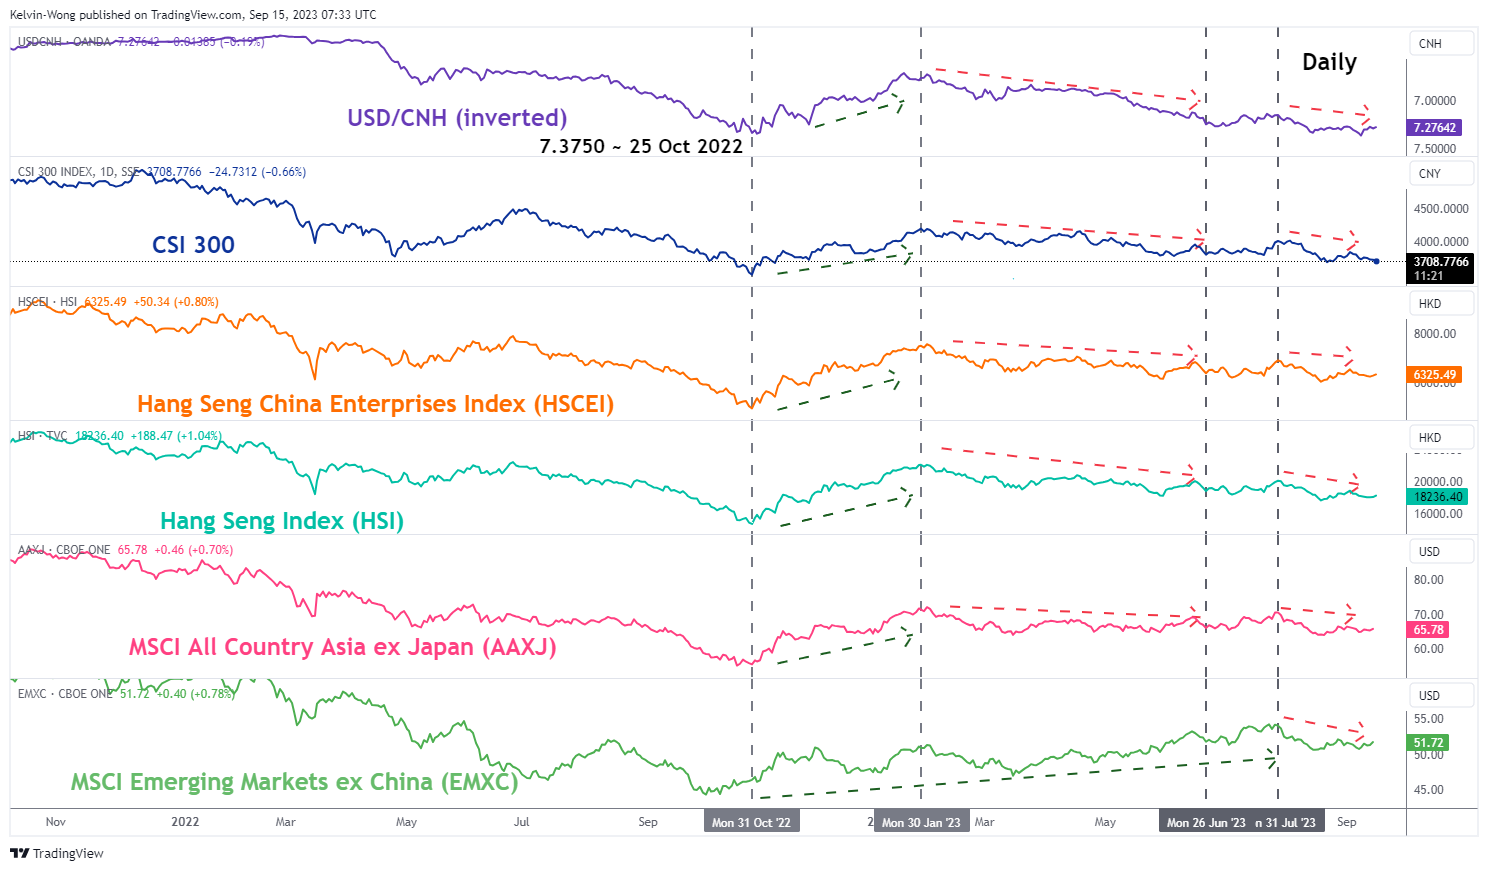
Fig 5: USD/CNH’s correlation with Hang Seng indices as of 15 Sep 2023 (Source: TradingView, click to enlarge chart)
Since late October 2022, the Heng Seng Index (HSI) and the Hang Seng China Enterprise Index (HSCEI) have moved in lockstep with the USD/CNH (offshore yuan) where a significant yuan weakness against the USD tends to see a similar bearish sentiment towards HSI and HSCEI.
Since the bullish momentum of USD/CNH has started to abate which in turn has led the HSI and HSCEI to erase their earlier losses at the start of this week and recorded intra-session weekly gains of +0.20% for both indices at this time of the writing.
USDCAD Extends Pull Back from 5-month Peak
- USDCAD in an aggressive decline from its 5-month high of 1.3693
- Bears eye the crucial 200-day SMA
- Momentum indicators suggest more pain in the short term
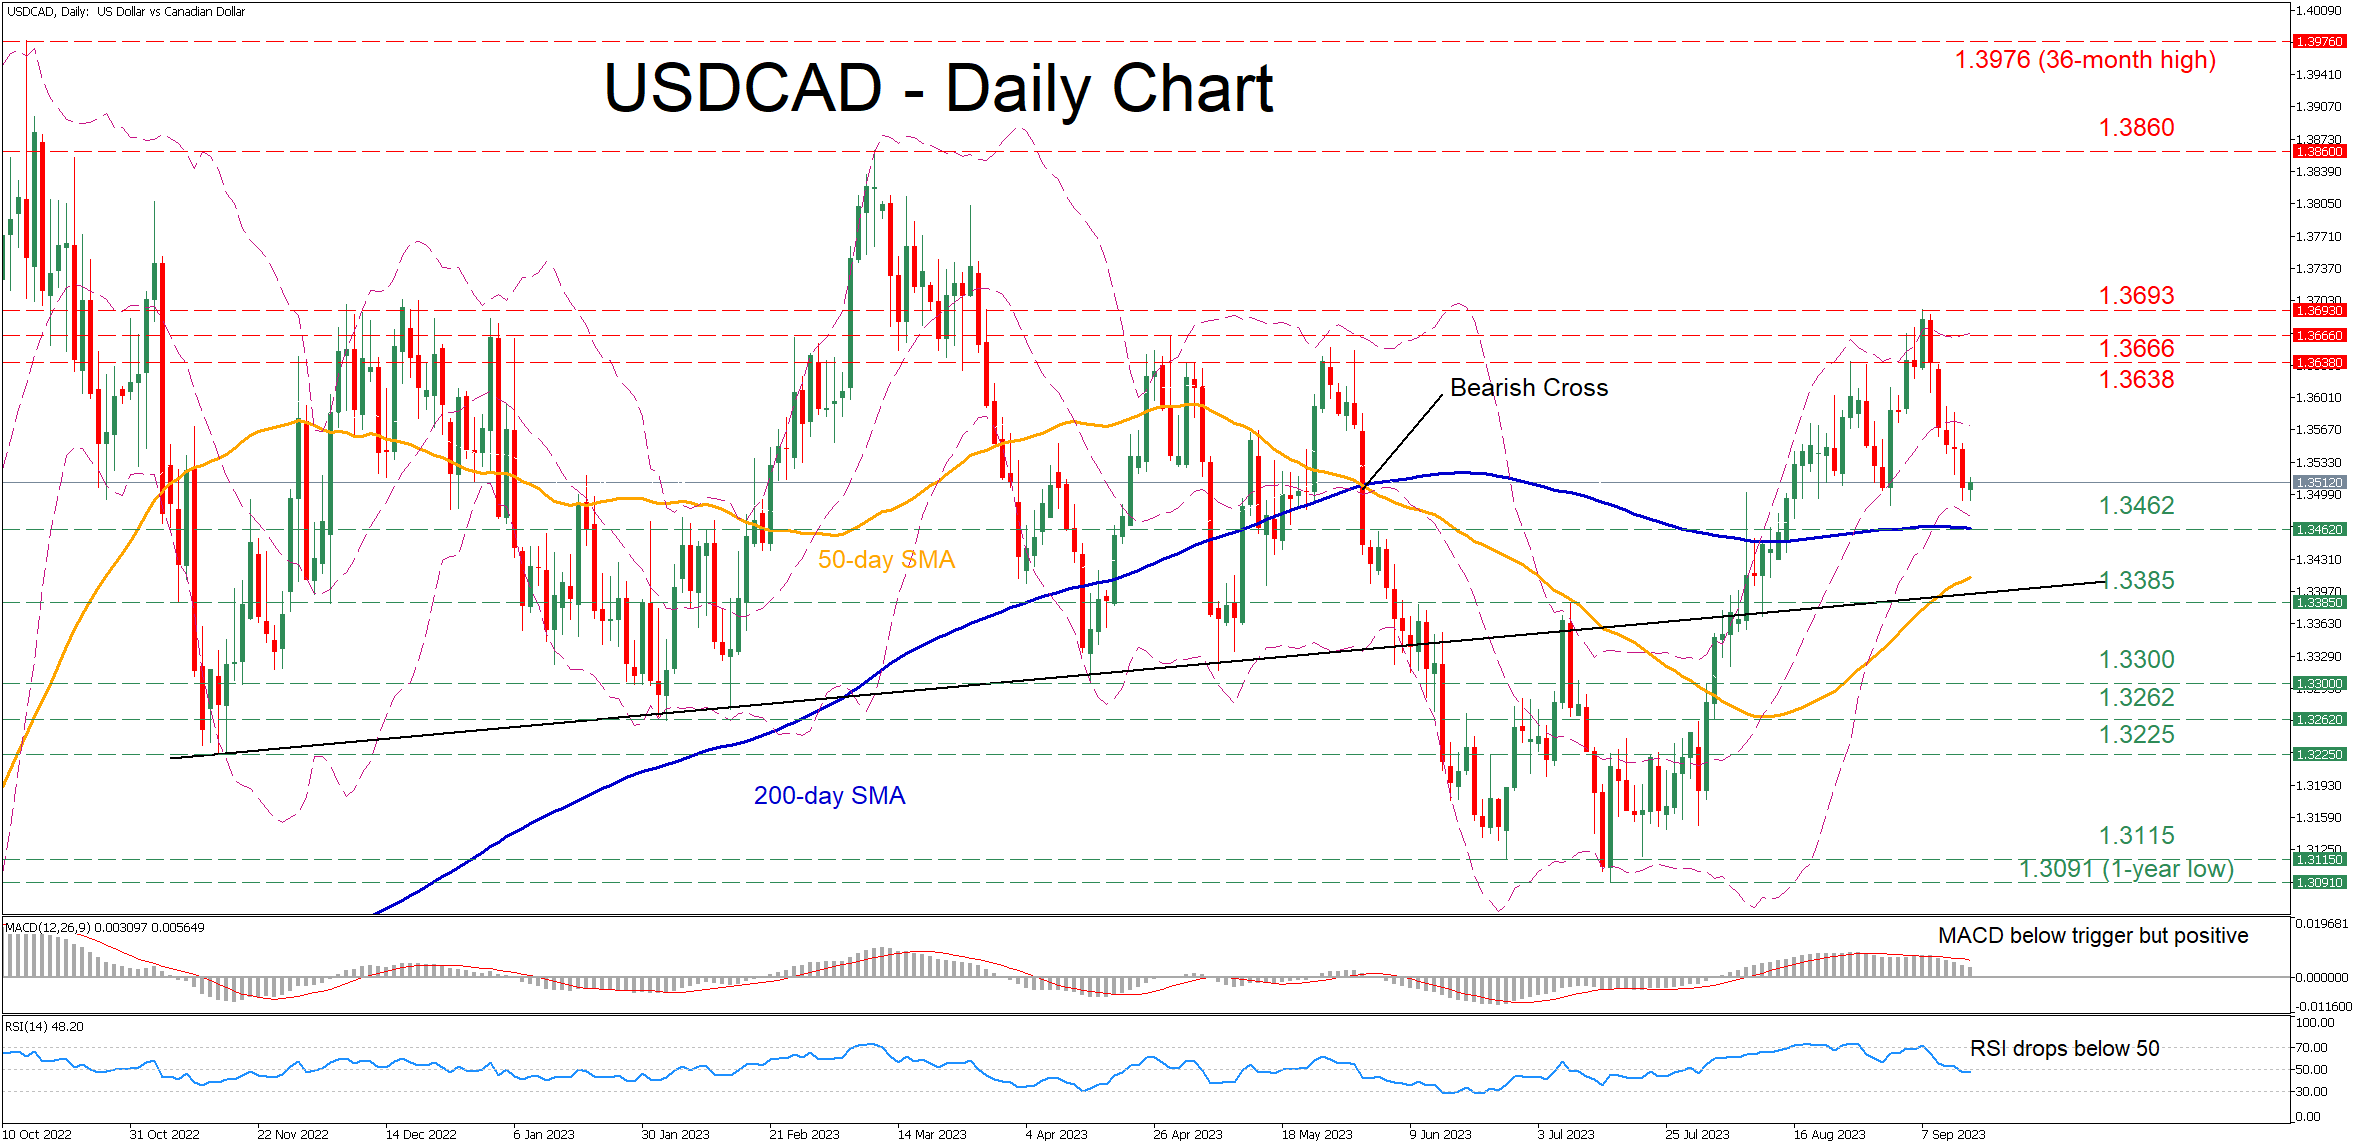
USDCAD had staged a massive rebound after finding its feet at the one-year low of 1.3091 in mid-July. However, the pair has been undergoing a downside correction since its rejection at a fresh five-month peak of 1.3693 last week, with short-term oscillators suggesting that sellers have gained total control.
If the price extends its retreat, immediate support could be found at the 200-day simple moving average (SMA), currently at 1.3462. Sliding beneath that floor, the pair could retreat towards the May resistance of 1.3385, which might now serve as support. A violation of that territory could open the door for the April bottom of 1.3300.
Alternatively, bullish actions could propel the price higher towards the August resistance of 1.3638. Surpassing that hurdle, the pair may face the April high of 1.3666. Further advances could then cease at the recent five-month peak of 1.3693.
In brief, USDCAD has been losing ground since its latest advance encountered strong resistance at a fresh five-month high. Nevertheless, it's too early to call for a sustained downtrend, unless the price profoundly breaks below the 200-day SMA.
Gold Price Eyes Recovery While Crude Oil Price Surges
Gold price is eyeing a fresh increase above the $1,915 resistance level. Crude oil price is surging, and it could climb further higher toward the $92 resistance.
Important Takeaways for Gold and Oil Prices Analysis Today
- Gold price started a recovery wave from the $1,900 zone against the US Dollar.
- It broke a major bearish trend line with resistance near $1,908 on the hourly chart of gold at FXOpen.
- Crude oil prices rallied above the $88 and $90 resistance levels.
- There is a key bullish trend line forming with support near $89.00 on the hourly chart of XTI/USD at FXOpen.
Gold Price Technical Analysis
On the hourly chart of Gold at FXOpen, the price found support near the $1,900 zone. The price traded as low as $1,900.93 and recently started a recovery wave.
There was a decent move above the 50-hour simple moving average. The bulls pushed the price above a major bearish trend line with resistance near $1,908. It is now testing the 50% Fib retracement level of the downward move from the $1,930 swing high to the $1,900 low.
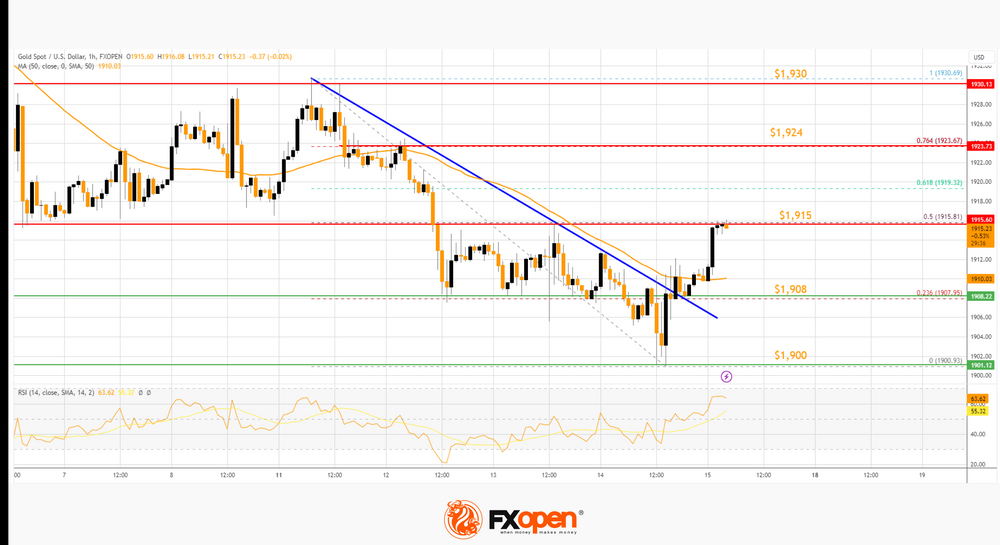
The RSI is back above 50 and the price could aim for more gains. Immediate resistance is near the $1,915 level. The next major resistance is near the $1,924 level.
The 76.4% Fib retracement level of the downward move from the $1,930 swing high to the $1,900 low also sits at $1,925. An upside break above the $1,924 resistance could send Gold price toward $1,930. Any more gains may perhaps set the pace for an increase toward the $1,950 level.
Initial support on the downside is near the 50-hour simple moving average or $1,908. The first major support is $1,900. The main support is $1,888. If there is a downside break below the $1,888 support, the price might decline further. In the stated case, the price might drop toward the $1,865 support.
Oil Price Technical Analysis
On the hourly chart of WTI Crude Oil at FXOpen, the price started a strong increase against the US Dollar. The price gained bullish momentum after it broke the $87.70 resistance as mentioned in the previous analysis.
There was a sustained upward move above the $88.50 and $89.50 resistance levels. The bulls pushed the price toward $90.50. The current price action is positive above the 50-hour simple moving average and RSI is near oversold levels.
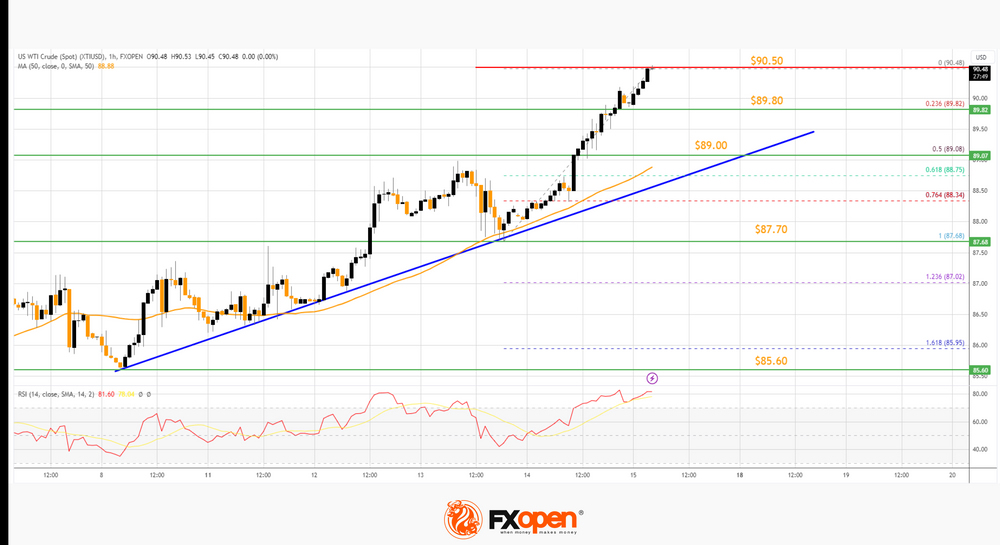
If the price climbs further higher, it could face resistance near $90.80. The first major resistance is near the $91.20 level. Any more gains might send the price toward the $92.00 level.
Conversely, the price might correct gains and test the 23.6% Fib retracement level of the upward move from the $87.68 swing low to the $90.48 high at 89.80. The next major support on the WTI crude oil chart is near a key bullish trend line at $89.00.
The 50% Fib retracement level of the upward move from the $87.68 swing low to the $90.48 high is also near $89.00. If there is a downside break, the price might decline toward $87.70. Any more losses may perhaps open the doors for a move toward the $85.60 support zone.
This article represents the opinion of the Companies operating under the FXOpen brand only. It is not to be construed as an offer, solicitation, or recommendation with respect to products and services provided by the Companies operating under the FXOpen brand, nor is it to be considered financial advice.
Gentle GBPJPY Moves Continue Despite Bears’ Attempts for a Strong Correction
- Gentle downward move continues ahead of key events
- GBPJPY ready to test a key area as intervention rumours linger
- Momentum indicators appear to have reset after the strong rally
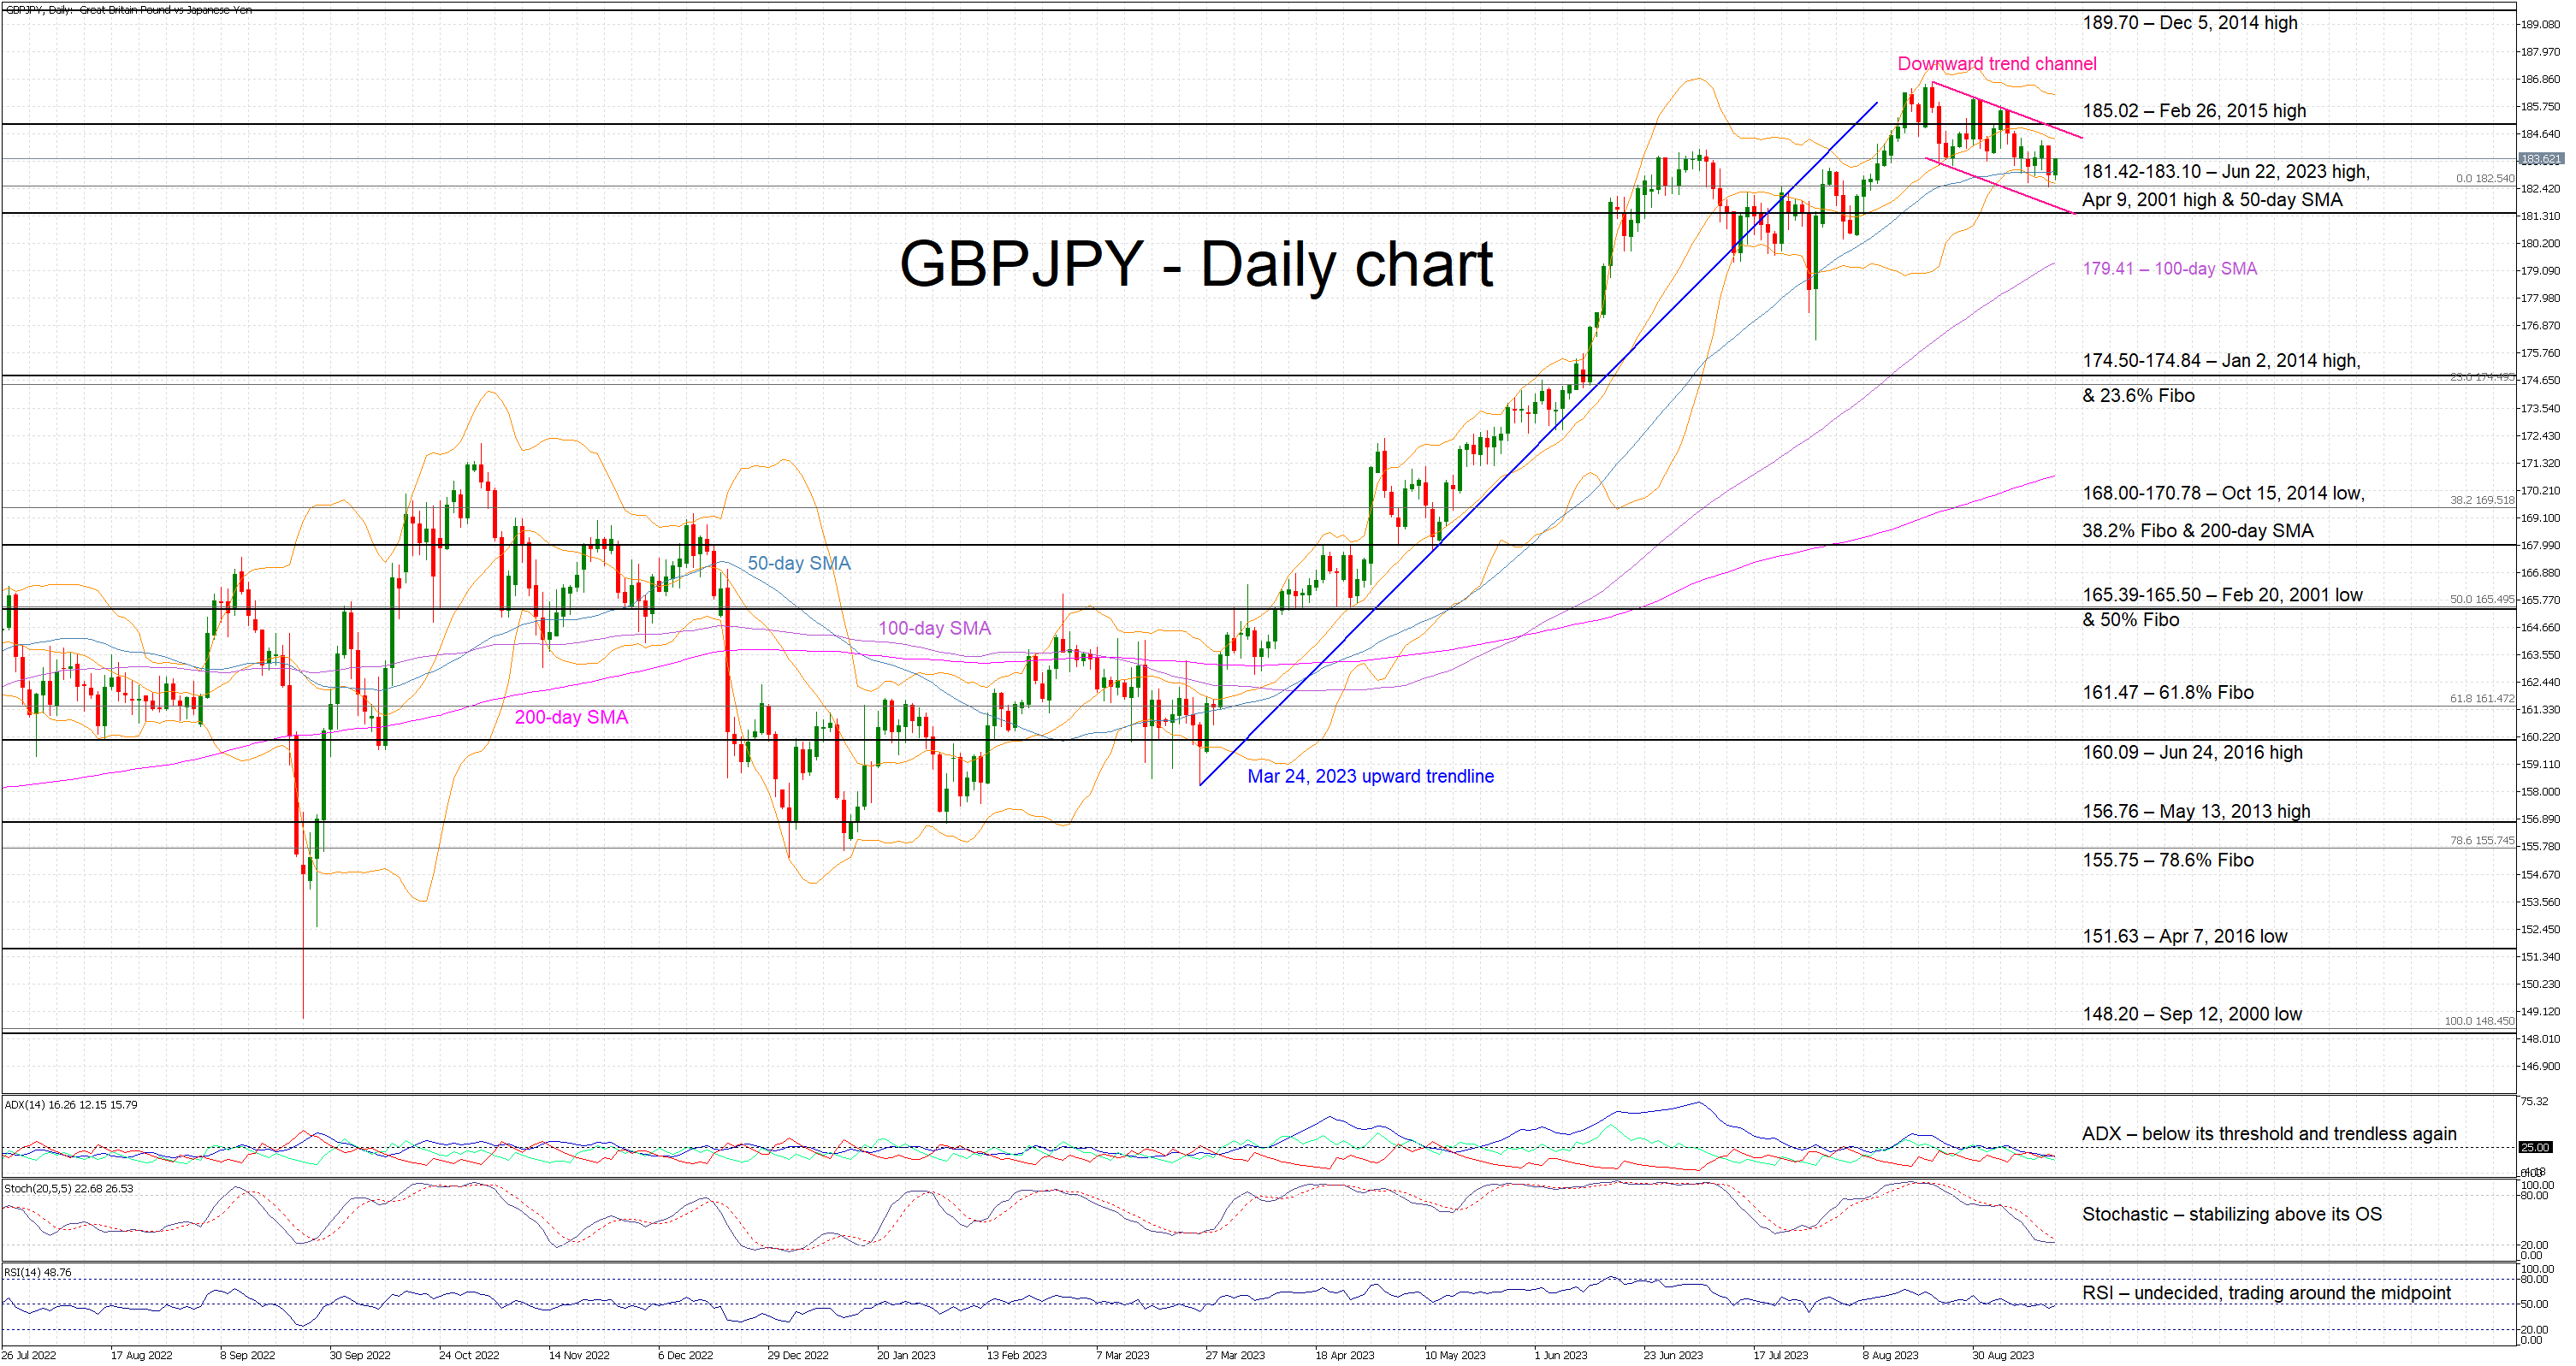
GBPJPY is trading higher today as the market is preparing for next week’s events. The bears are trying to stage a pullback, but such a move could only gather pace if the momentum indicators decide to send strong bearish signals.
However, only the stochastic oscillator has been supportive of the current muted move, but even this indicator appears to have stabilized a tad above its oversold threshold. On the flip side, the Average Directional Movement Index (ADX) remains indifferent to the current downleg as it remains below its 25-threshold; thus signaling a range-trading market. Similarly, the RSI continues to hover around its 50-midpoint, confirming the current indecisiveness of market participants.
Should the bears remain confident, they would try to break the busy 181.42-183.10 range populated by the June 22, 2023 high, the April 9, 2001 high and the 50-day simple moving average (SMA). They could then have a go at testing the support set by the 100-day SMA at 179.41, before having a go at the more important 174.50-174.84 range.
On the other hand, the bulls are probably taking a breather but closely monitoring the current correction. They are keen on keeping GBPJPY above the 181.42 level and gradually stage a move towards the February 26, 2015 high at 185.02. They could then have the chance of making a new 2023 high, before setting sail for the December 5, 2014 high at 189.70.
To sum up, GBPJPY bears are trying to recover part of their significant losses, but they need the support from the mixed momentum indicators for the current pullback to snowball.
Dollar in Case of Strong Data Has Further Upward Potential
Markets
The ECB Yesterday raised its policy rates again by 25 bps to a record 4.0% (depo rate), in what is now mainly labelled as a ‘final dovish‘ rate hike. In advance, the decision was said to be a close call. ECB’s Lagarde at the press conference admitted that some members already preferred a pause, but in the end the decision was supported by a ‘solid majority’ as inflation, while easing, is still ‘expected to remain too high for too long’. This assessment was supported by an upward revision of 2023 (5.6%) and 2024 (3.2%) inflation projections. Even in 2025 (2.1% from 2.2%) inflation is expected to stay above the 2.0% target. At the same time, growth forecasts were substantially downwardly revised to 0.7% this year (from 0.9%) and 1.0% in 2024 (from 1.5%). In this context, ‘the Governing Council considers that the key ECB interest rates have reached levels that, maintained for a sufficiently long duration, will make a substantial contribution to the timely return of inflation to the target.’ Even so, the ECB maintains a data dependent approach and Lagarde said she couldn’t say that ECB rates have reached their peak. According to the ECB president, there had been no discussion about a faster rundown of APP or a start of reducing PEPP holdings (reinvestments till end 2024). The December ECB projections still remain an evaluation point. Even so, markets sees a big chance that the ECB hiking cycle as been finished. German yields eased between 0.4 bps (2-y) and 6.2 bps (5- y). The ECB policy decision was the main dish for markets yesterday, but US data also had a role to play. Retail sales, jobless claims and higher than expected PPI all brought further evidence of a resilient US economy. US yields added 3-4 bps across the curve. A rate hike next week remains unlikely, but a ‘final’ step in November remains on the table. The perceived end of the ECB cycle combined with strong US data pushed EUR/USD off a cliff. The pair dropped from the 1.073 area before the ECB decision to close at 1.0643, after an intraday test of the 1.0635 support. Equities flourished (Eurostoxx 50 1.33%, S&P 500 +0.84%) even as oil continued its ascent (Brent near $94 p/b).
Sentiment in Asia remains positive building on WS gains and positive eco data from China (cf infra). Later today, the eco calendar in Europe is thin. In the US import prices, industrial production, the Empire manufacturing survey and Consumer confidence of the University of Michigan will be published. The data probably won’t change the assessment on the outcome of next week’s Fed meeting. Even so, the Empire manufacturing survey and (inflation expectations of) the U. of Michigan Consumer confidence are worth keeping an eye on. Strong data probably won’t be enough to push US yields beyond key resistance (10-y peak at 4.34/36%). However, the dollar in case of strong data has further upward potential. A break of EUR/USD below 1.0635/32 opens the way to the 1.0516/1.0484 area.
News and views
Chinese monthly data this morning fuels hope the economy is finally bottoming out. Retail sales grew 4.6% y/y in August and are up 7% in the running year (YtD) compared to the same period last year. Industrial production rose 4.5% and 3.9% respectively with the latter gauge having improved slowly but steadily since February of this year. Both indicators (far) exceeded analyst estimates, suggesting peak investor pessimism may be behind us. The unemployment rate slightly eased from 5.3% to 5.2% in another encouraging yet cautious sign. That’s not to say all is over now though. Fixed asset investment stood at a weak 3.2% YtD y/y, extending a losing streak that’s in place since February 2022. The drop from July’s 3.4% came amid the ongoing woes in the property sector, where investments fell 8.8%, further down from -8.5% in July. Prices of new homes also fell at a faster pace (-0.29% m/m) in August than in last month. But markets took this morning’s string of data as a sign that supportive government measures announced over the past weeks are starting to have an effect. Until it is clear that the Chinese economy is on a sustained recovery path, more will probably follow. Just yesterday, the Chinese central bank cut the reserve requirement ratio by 25 bps for a second time this year. With the move, the PBOC boosts banks’ lending capacity and frees up liquidity of as much as 500bn yuan. The central bank this morning also added more cash into the economy through a one-year policy loan. The combo of more stimulative measures with the batch of eco data revives investor appetite. The Chinese yuan strengthens against the dollar. USD/CNY trades around 7.26. Stocks in the broader region rise. Hong Kong is one the outperformers, adding 1.2%.
EUR/AUD Daily Outlook
Daily Pivots: (S1) 1.6450; (P) 1.6591; (R1) 1.6667; More...
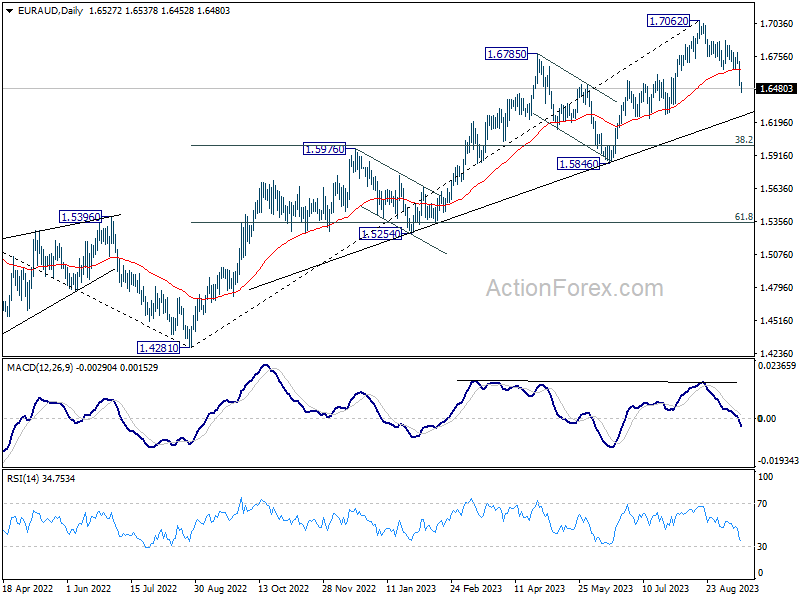
Intraday bias in EUR/AUD stays on the downside, as fall from 1.7062 is extending. Deeper decline would be seen to 1.6259 support. Break there will target 1.6000 fibonacci level. On the upside, above 1.6647 support turned resistance will turn intraday bias neutral first.
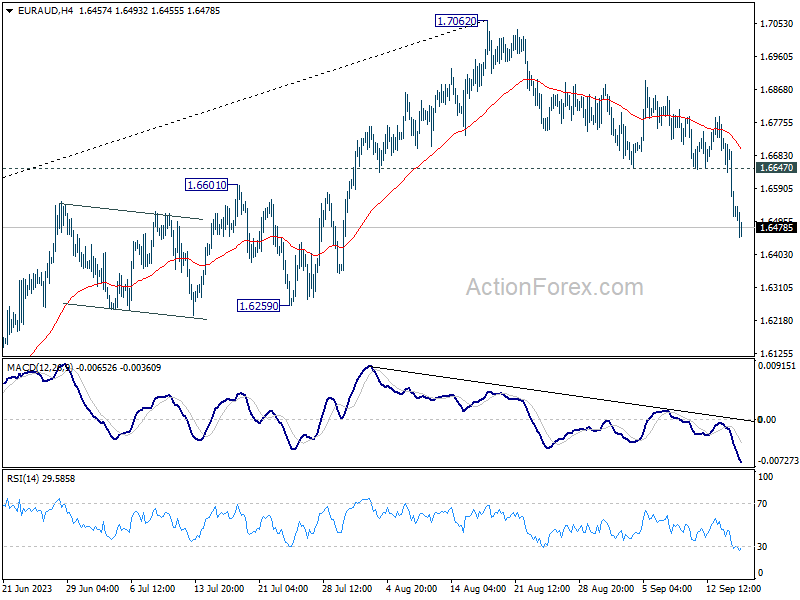
In the bigger picture, current development argues that fall from 1.7062 is probably correcting whole up trend from 1.4281. Deeper decline would be seen to 38.2 retracement of 1.4281 to 1.7062 at 1.6000. Strong support should be seen there to bring rebound, at least on first attempt.
EUR/GBP Daily Outlook
Daily Pivots: (S1) 0.8562; (P) 0.8588; (R1) 0.8604; More...
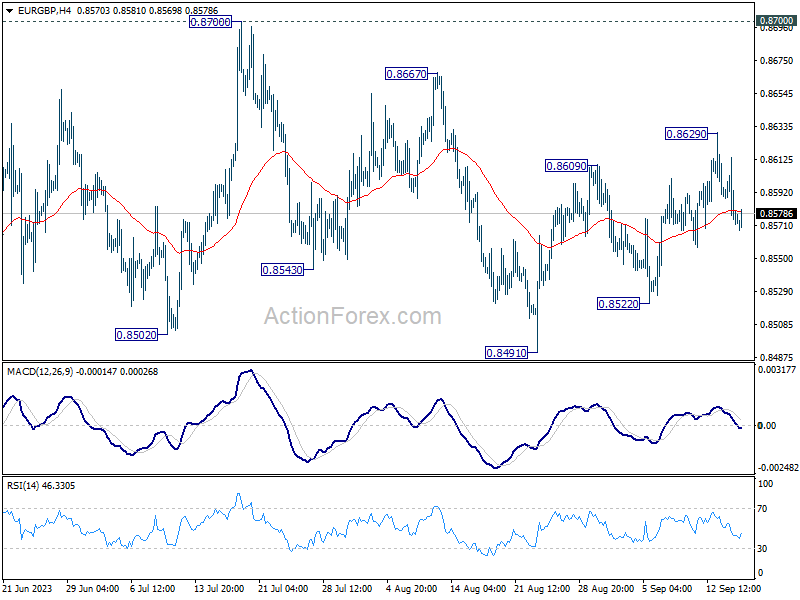
Intraday bias in EUR/GBP stays neutral and outlook is unchanged. Price actions from 0.8502 are a consolidation pattern. Above 0.8629 would bring stronger recovery, but upside should be limited 0.8700 to bring larger decline resumption. On the downside, below 0.8522 will bring retest of 0.8491 support.
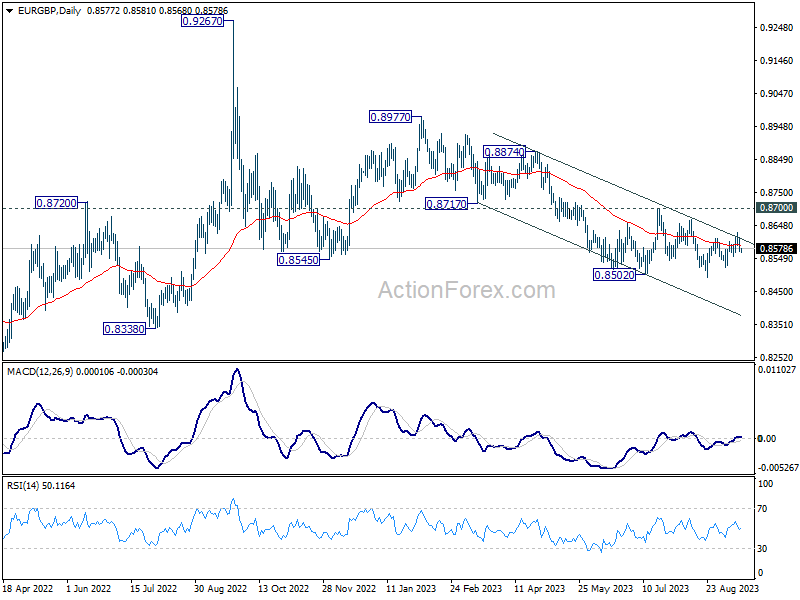
In the bigger picture, the down trend from 0.9267 (2022 high) is seen as part of the long term range pattern from 0.9499 (2020 high). Fall from 0.8977 is seen as the third leg. As long as 0.8700 resistance holds, further decline is still expected. Break of 0.8491 will resume the fall towards 0.8201 (2022 low). Nevertheless, firm break of 0.8700 will now be a sign of bullish reversal.
EUR/JPY Daily Outlook
Daily Pivots: (S1) 156.28; (P) 157.33; (R1) 158.02; More....
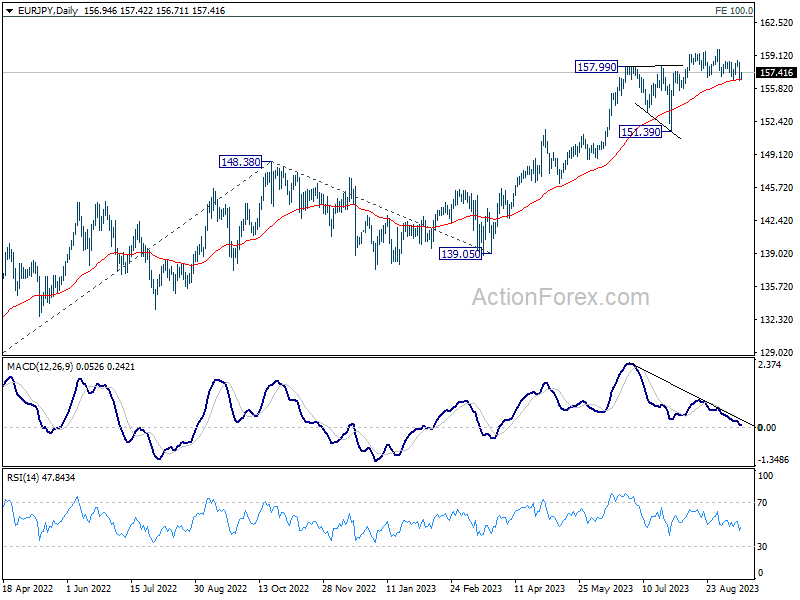
Intraday bias in EUR/JPY stays neutral at this point. Corrective fall from 159.75 could extend lower as long as 158.64 resistance holds. Break of 156.57, and sustained trading below 55 D EMA (now at 156.72) will argue that fall from 159.75 is a larger scale correction. Deeper fall would be seen back towards 151.39 support.
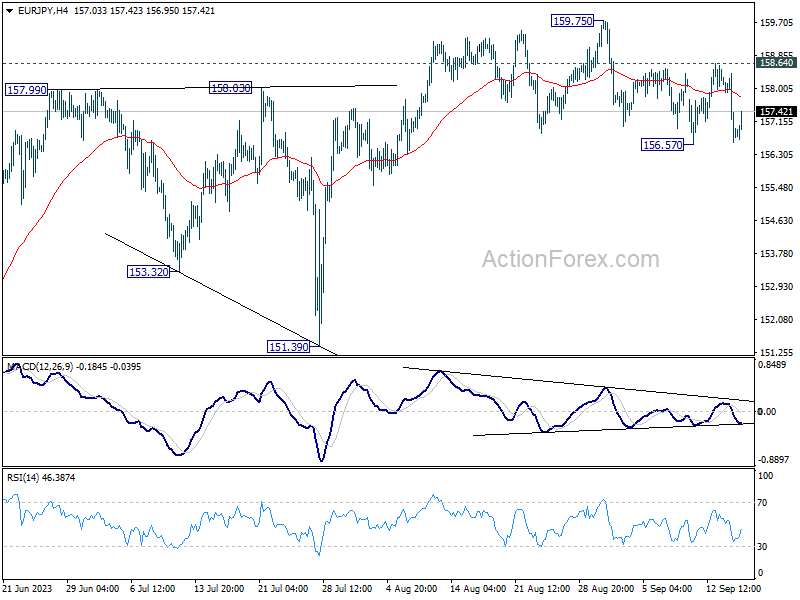
In the bigger picture, rise from 114.42 (2020 low) is in progress. Next target is 100% projection of 124.37 to 148.38 from 139.05 at 163.06. Sustained break there will pave the way to retest long term resistance at 169.96. This will remain the favored case as long as 151.39 support holds, even in case of deep pull back.