Sample Category Title
BoJ Ueda: Underlying inflation is still a bit below our target
In the face of mounting economic uncertainties, BoJ Governor Kazuo Ueda provided insights on Japan's monetary stance and the regional economic dynamics. Bank of Japan, despite witnessing annual inflation of 3.1% in July, anticipates softening of this rate towards year-end.
Speaking on Saturday at the Jackson Hole Symposium, Ueda remarked, "We think that underlying inflation is still a bit below our target," subsequently justifying their persistence with the current monetary easing framework by stating, "This is why we are sticking with our current monetary easing framework."
Despite the inflationary indicators, health of Japan's domestic demand remains a focal point for the central bank. Ueda highlighted that domestic demand appears to maintain a "healthy trend," but swiftly added a caveat: "although that's something that needs to be checked with" Q3 data.
Addressing the wider Asian economic landscape, Ueda did not mince his words, labeling China's recent economic deceleration a "disappointment," and highlighting July's data as skewing "on the weak side." Diving deeper into China's challenges, he pinpointed, "The underlying problem appears to be the adjustment in the property sector and the spillover to the rest of the economy."
However, it's not all gloomy on the horizon. Ueda acknowledged the US economy's resilience, noting its "relative strength" as a potential counterbalance, offering "some offset" to Japan amidst regional economic fluctuations.
EUR/USD Faces Uphill Task Near 1.0850
Key Highlights
- EUR/USD extended decline and tested the 1.0765 level.
- A connecting bearish trend line is forming with resistance near 1.0850 on the 4-hour chart.
- GBP/USD is now trading below the 1.2650 resistance.
- USD/JPY is eyeing more gains above the 146.55 resistance.
EUR/USD Technical Analysis
The Euro remained in a bearish zone below the 1.1000 level against the US Dollar. EUR/USD extended decline and traded below the 1.0920 support.

Looking at the 4-hour chart, the pair settled below the 1.0850 level, the 100 simple moving average (red, 4 hours) and the 200 simple moving average (green, 4 hours).
The pair tested the 1.0765 zone. A low is formed near 1.0766 and the pair is now consolidating losses. It is trading just above the 23.6% Fib retracement level of the downward move from the 1.0930 swing high to the 1.07616 low.
On the upside, an initial resistance is near the 1.0830 level. There is also a connecting bearish trend line forming with resistance near 1.0850 on the same chart.
The trend line is near the 50% Fib retracement level of the downward move from the 1.0930 swing high to the 1.07616 low. A close above 1.0850 could start a decent increase. In the stated case, the pair could rise toward the 1.0920 level. Any more gains could start a fresh increase toward the 1.0980 level.
If not, the pair might react to the downside toward the 1.0765 support. The next key support is seen near the 1.0740 level.
If there is a move below 1.0740, the pair could dive toward 1.0650. Any more gains might open the doors for a test of 1.0500.
Looking at GBP/USD, the pair is still trading in a bearish zone and there is a risk of more downsides below the 1.2600 level.
Economic Releases
- Dallas Fed Manufacturing Business Index for August 2023 – Forecast -21.6, versus -20.0 previous.
CHFJPY Wave Analysis
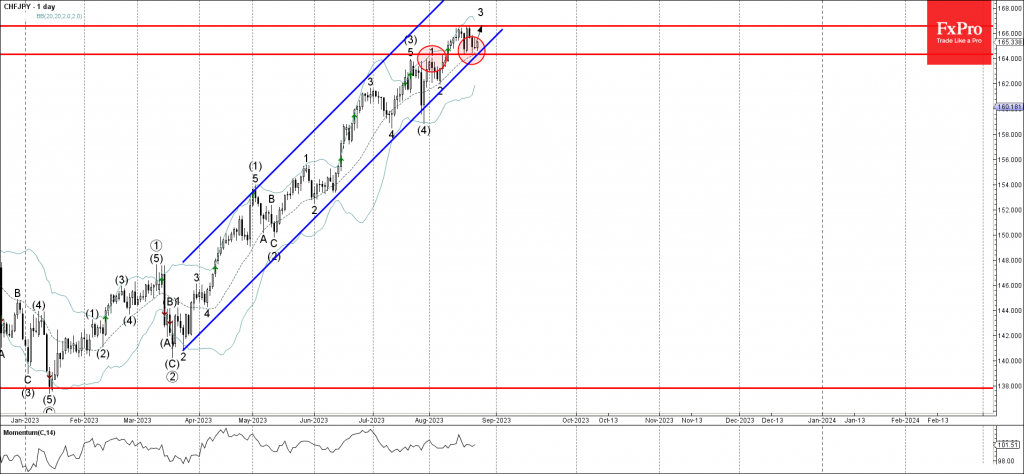
- CHFJPY reverses from support level 164.30
- Likely to rise to resistance level 166.60
CHFJPY currency pair earlier reversed up from the support level 164.30 (former resistance that stopped the previous impulse wave 1 at the start of August).
The support level 164.30 was strengthened by the nearby 20-day moving average and by the support trendline of the daily up channel from March.
Given the strong daily uptrend, CHFJPY can be expected to rise further to the next resistance level 166.60 (which reversed the pair earlier this month).
USDCAD Wave Analysis
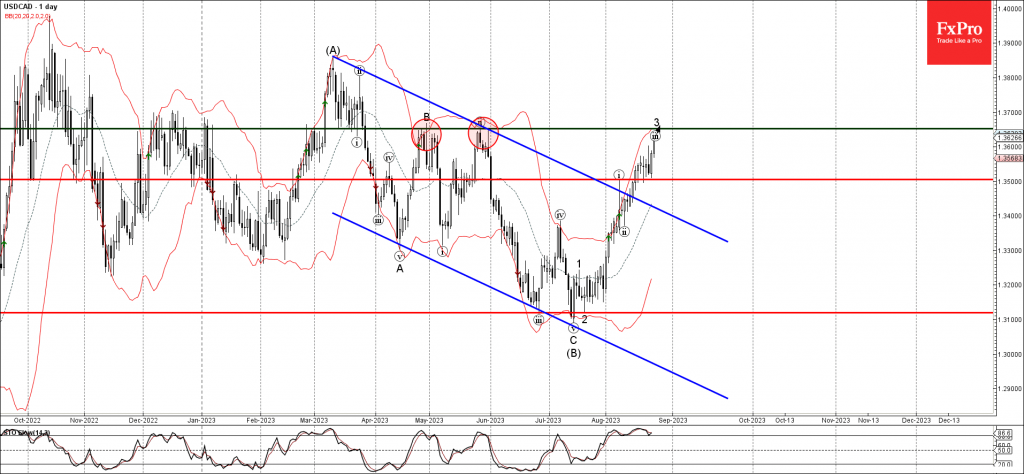
- USDCAD reverses from support at 1.3500
- Likely to rise to resistance level 1.3650
USDCAD recently bounced back from the support level 1.3500 (former resistance that stopped the previous impulse wave (i) at the start of August).
The pair had previously broken the daily descending channel from March, which accelerated the active short-term impulse wave 3 of the intermediate impulse wave (C) from July.
Given the strong gains in the USD, USDCAD is expected to continue rising towards the next resistance level of 1.3650 (which reversed the previous waves B and ii, the target for the completion of the active impulse wave 3).
Forex and Cryptocurrencies Forecast
EUR/USD: Mr. Powell and Mrs. Lagarde - Much Talk, Little Substance
Last week's business activity data from both sides of the Atlantic proved to be exceptionally weak. The euro came under selling pressure due to a decline in Germany's Services PMI from 52.3 to 47.3, which in turn pulled down the Composite Business Activity Indexes not only for Germany but for the entire Eurozone. The former dropped from 48.5 to 44.7, while the latter declined from 48.6 to 47.0. The GDP data for Germany for Q2, released on Friday, August 25, further confirmed that the economy of the united Europe is stagnating. On a quarterly basis, this metric stood at 0%, and on an annual basis, it showed a decline of -0.6%.
American macroeconomic data also failed to please investors. Preliminary business activity data for the United States published on Wednesday, August 23, fell short of expectations. Specifically, the Manufacturing PMI dropped from 49.0 to 47.0, and for the Services sector, it decreased from 52.3 to 51.0. The Composite Index also weakened from 52.0 to 50.4. (Note that a score above 50.0 indicates an improving economic situation, while below 50.0 signifies deterioration.) The published data for U.S. durable goods orders also turned out to be fairly weak. While they had increased by 4.4% in June, they unexpectedly fell by -5.2% in July.
Despite the fact that both European and American statistics were considered dismal by several experts, the DXY Dollar Index continued its bullish rally initiated six weeks prior, while EUR/USD maintained its southerly course. Not even the hawkish rhetoric from Deutsche Bundesbank President Joachim Nagel could bolster the euro. Nagel advocated for the continuation of interest rate hikes to control inflation. In contrast, Nagel's Portuguese colleague, Mario Centeno, called for caution to avoid negatively impacting the Eurozone economy.
This discord among members of the ECB's Governing Council, set against a backdrop of persistently weak economies in Q1 and Q2 and the potential for GDP contraction in Q3 of 2023, has sown doubt among market participants. These circumstances have led to scepticism about whether the regulator will proceed with further rate hikes in September.
The positions of U.S. representatives, speaking on the sidelines of the global central bank symposium in Jackson Hole, appeared more unified. Boston Federal Reserve Bank President Susan Collins and Philadelphia Federal Reserve Bank President Patrick Harker stated that the Fed could maintain interest rates at a stable level through the end of the year. However, they refrained from commenting on the timeline for a shift in monetary policy for the following year. Furthermore, according to Susan Collins, the resilience of the U.S. economy to aggressive monetary tightening suggests that the Fed may have to do more than it has already done. Her comments were interpreted as a clear hint towards further tightening of the American regulator's policy, leading market participants to speculate that Federal Reserve Chairman Jerome Powell might also adopt a relatively hawkish stance.
Two pivotal speeches were scheduled for the evening of Friday, August 25, at the Jackson Hole global central bank symposium. These addresses held the potential to either disrupt or amplify existing financial trends. Federal Reserve Chairman Jerome Powell was set to speak first, followed by ECB President Christine Lagarde just two hours before the markets closed.
If Powell had confirmed that interest rates would remain unchanged through the year's end, it could have triggered selling pressure on the dollar. Conversely, the ongoing dollar rally might have accelerated if Powell had indicated the possibility of another rate hike. Data from the FedWatch Tool indicated a 39% likelihood of another 25-basis-point rate hike by the end of 2023 ahead of the speech.
In the previous year at Jackson Hole, Powell warned that any rate hikes would inflict "some pain" upon the U.S. economy, a statement that led to a rapid downturn in the U.S. stock market. This time, the U.S. equities market didn't wait for Powell's remarks. Major indices such as the S&P 500, Dow Jones, and Nasdaq saw sharp declines as early as August 24.
So, what did Jerome Powell say this time? Essentially the same message he delivered last year. Quote: "At last year's Jackson Hole symposium, my message was brief and direct. The substance of my remarks this year remains the same: The Federal Reserve's task is to bring inflation down to our 2% target, and we will achieve this," the Fed Chairman assured his audience. He then laid out two potential future scenarios: either maintaining the current rate or raising it. "While inflation has come down from its peak, which is a welcomed development, it remains too high," he said. "We are prepared to raise rates further if necessary and will maintain a restrictive policy stance until we are confident that inflation is sustainably moving toward our target level."
The head of the U.S. central bank also noted that core PCE (Personal Consumption Expenditures) inflation reached 4.3% in July, up from 4.1% the previous month. (July's PCE data will officially be released on August 31.) Overall, Powell's rhetoric was, as is often the case, fairly ambiguous: leaving both possible outcomes open for consideration.
Madam Lagarde's remarks were perhaps even more elusive. "Profound shifts in the functioning of the global economy [...] could lead to greater inflation volatility and more persistent price pressures," she stated. According to the ECB President, "at this stage, it is unclear whether all these various shifts will be permanent. [...] While these changes may still prove to be temporary, central banks need to be prepared for some of them to be more enduring."
In summary, while Powell presented two options, either maintaining or raising the interest rate, Madam Lagarde simply declared that interest rates will remain elevated for as long as necessary to combat inflation. As a result, the daily candle for EUR/USD, after some hesitation, returned to the central part of its range.
Starting the five-day trading week at 1.0872, EUR/USD closed it with an advantage for the dollar, settling at 1.0794. At the time of writing this analysis, on the evening of August 25th following the speeches at Jackson Hole by the heads of the Fed and the ECB, analysts were evenly split: 50% favoring a rise in the pair and 50% expecting a decline. Among the trend indicators and oscillators on the D1 chart, 100% are leaning towards the American currency and are coloured in red. However, 15% of these are signalling that the pair is oversold. Immediate support for the pair is located in the 1.0765-1.0775 range, followed by 1.0740, 1.0665-1.0680, 1.0620-1.0635, and 1.0525. Bulls will encounter resistance in the areas of 1.0845-1.0865, followed by 1.0895-1.0925, then 1.0985, 1.1045, 1.1090-1.1110, 1.1150-1.1170, 1.1230, and 1.1275-1.1290.
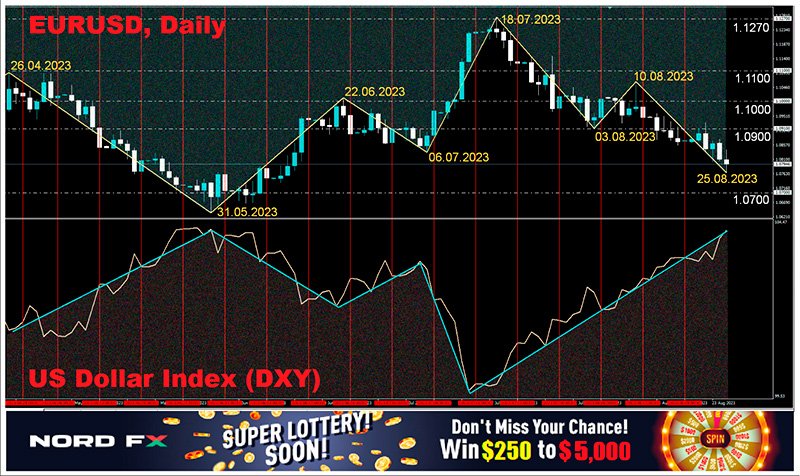
The upcoming week will see the release of a significant amount of diverse economic data. The week will kick off on Tuesday, August 29, with the U.S. Consumer Confidence Index and the job openings data. On Wednesday, August 30, preliminary Consumer Price Index (CPI) data from Germany will be released, along with U.S. labour market statistics and GDP figures. Thursday will bring preliminary CPI numbers for the Eurozone, retail sales data from Germany, as well as U.S. unemployment levels and the Core Personal Consumption Expenditures Price Index (Core PCE Price Index), a critical inflation indicator. On Friday, September 1, another substantial set of U.S. labour market information will be released, including the highly important Non-Farm Payrolls (NFP) data. The week will conclude with the release of the U.S. Manufacturing Purchasing Managers' Index (PMI).
GBP/USD: Will the Rate Finally Rise?
Inflationary pressure in the United Kingdom is easing, although it remains the highest among the G7 countries. We have previously noted that while the annual rate of price growth has decreased from 7.9% to 6.8% (the lowest since February 2022), inflation remains elevated. Furthermore, the core CPI metric has remained steady at 6.9% year-on-year, just 0.2% below the peak set two months prior. A surge in energy prices threatens another inflationary spike.
These data and prospects exert significant pressure on the British currency. According to some analysts, they will push the Bank of England (BoE) toward further interest rate hikes. This will likely occur despite rising unemployment rates and the threat of an economic recession. This possibility cannot be ruled out, as preliminary business activity data released on Wednesday, August 23, showed that the UK's Manufacturing PMI dropped from 45.3 to 42.5 within a month, the Services PMI fell from 51.5 to 48.7, and the Composite PMI declined from 50.8 to 47.9. Thus, all three indicators fell below 50.0, signalling a sharp deterioration in the economic landscape.
A number of experts believe that the key interest rate could peak around 6% (currently at 5.25%). Due to accelerating inflationary pressures, the BoE may be compelled to maintain this peak level for an extended period, even in the face of pressure from populist politicians. Should this occur, the pound would have an opportunity to improve its position relative to the dollar.
However, concerning near-term prospects, specialists at Scotiabank do not rule out a further decline of GBP/USD to 1.2400 after breaking the 1.2620 support level. They add that "a rebound above 1.2600 could provide short-term support for the pound, especially considering that the selloff appears to be overstretched." Experts at ING, the largest banking group in the Netherlands, believe that the pair could find support around 1.2500 if the dollar strengthens. Their colleagues at Singapore's United Overseas Bank anticipate that GBP/USD will trade in a range of 1.2580-1.2780. "Going forward," they write, "as long as the pound remains below the strong resistance level [of 1.2720], it is likely to weaken to 1.2530 and possibly even to 1.2480."
After the Jackson Hole speeches on Friday, August 25, GBP/USD settled at 1.2578. The near-term consensus among experts is divided as follows: 60% are in favour of a bullish trend, 20% lean bearish, and the remaining 20% are neutral. On the D1 timeframe, 60% of the oscillators are painted red, with a third of these suggesting the pair is oversold; the remaining 40% are in a neutral grey zone. As for trend indicators, 85% are coloured red, suggesting a bearish bias, compared to 15% in green.
If the pair trends downwards, it will likely find support at various levels and zones: 1.2540, 1.2500-1.2510, 1.2435-1.2450, 1.2300-1.2330, 1.2190-1.2210, 1.2085, 1.1960, and 1.1800. Conversely, if the pair moves upwards, it will encounter resistance at 1.2630, 1.2675-1.2690, 1.2760, 1.2800-1.2815, 1.2880, 1.2940, 1.2980-1.3000, 1.3050-1.3060, 1.3125-1.3140, and 1.3185-1.3210.
Regarding key economic data for the United Kingdom, no major releases are expected in the upcoming week. The focus will be on developments across the Atlantic. However, traders should note that Monday, August 28, is a bank holiday in the UK.
USD/JPY: Higher and Higher
The Governor of the Bank of Japan (BOJ), Kazuo Ueda, is scheduled to speak in Jackson Hole on Saturday, August 26, by which time this review will already have been written. Frankly, we do not expect any groundbreaking statements from him. At this point, we can only rely on the comments from the country's Finance Minister, Shunichi Suzuki. On Friday, August 25, he stated that he is "closely monitoring the impact of the Jackson Hole discussions on the global economy." He added that he cannot offer any specific details regarding the formation of an additional budget to finance economic measures.
It's worth noting that the Bank of Japan (BoJ) recently took a "revolutionary" decision, at least by its own standards, and shifted from rigid yield curve targeting of Japanese Government Bonds (JGBs) to a more flexible approach. However, it set certain boundaries, drawing a "red line" at a yield of 1.0% and declaring that it would carry out purchases to ensure that yields do not exceed this level. Less than a week after this move, the yield on JGBs reached nine-year highs, approaching the 0.65% mark. Consequently, the central bank had to intervene by buying these securities to prevent further increases.
In the Japanese media, Nikkei Asia believes that the budgetary expenses for such operations are expected to rise. Unlike the Finance Minister, they provided a specific figure: 110 trillion yen (over 753 billion dollars) for the year 2024. According to the Nikkei Asia report, the budget request is expected to be submitted by the end of August, meaning within the coming week.
As previously mentioned, the change in yield curve regulation for securities is indeed an extraordinary move for the Bank of Japan (BoJ). However, according to Japan's MUFG Bank, this is insufficient to trigger a yen recovery. Regarding interest rate hikes, MUFG believes that the Bank of Japan may only decide on its first increase in the first half of next year. Only then is a shift towards strengthening the national currency expected.
The yen had an opportunity to slightly strengthen its position last week. Responding to weak economic activity data, U.S. Treasury yields dropped by more than 1.5%. As is well-known, there is an inverse correlation between their yields and the yen. That is, if Treasury yields fall, the Japanese currency rises, and USD/JPY forms a downward trend. This is exactly what we observed in the middle of the week, on August 23, the pair found a local low at the 144.53 level.
However, the joy for yen investors was short-lived, as the pair reached a new high of 146.62 on August 25. As for the close of the trading week, it settled at the 146.40 level. According to strategists at Credit Suisse, the pair will eventually climb higher and reach its primary and long-term target at 148.57.
Regarding the near-term outlook, the consensus among experts appears as follows: A significant majority (60%) anticipate a downward correction for the pair. Meanwhile, 20% expect USD/JPY to continue its upward movement, and another 20% opted to abstain from commenting. On the D1 time frame, all trend indicators are coloured green, while 90% of the oscillators are also green (with 10% in the overbought zone); the remaining oscillators maintain a neutral stance. The closest support level lies at 146.10, followed by 145.50-145.75, 144.90, 144.50, 143.75-144.05, 142.90-143.05, 142.20, 141.40-141.75, 140.60-140.75, 139.85, 138.95-139.05, 138.05-138.30, and 137.25-137.50. The immediate resistance is at 146.90-147.15, followed by 148.45-148.60, 150.00, and finally, the October 2022 high at 151.95.
There are no scheduled releases of any significant statistics concerning the state of the Japanese economy for the upcoming week.
CRYPTOCURRENCIES: The Shock is Not Over Yet
It appears that the crypto market is still reeling from the shock of August 17, when bitcoin took a sharp nosedive, hitting a low of $24,296. The Crypto Fear & Greed Index, which had long been in the neutral zone, moved into the fear territory. The leading cryptocurrency dragged the entire crypto market down with it, shrinking it by 10% from $1.171 trillion to $1.054 trillion, barely holding above the psychological level of $1 trillion. On August 17 alone, traders collectively lost over $1 billion across all instruments, marking the biggest loss since the crash of the FTX exchange.
This is a brief description of the recent tragedy. Now let's delve into the causes. We already highlighted the main theories in our last review, and they turned out to be accurate, although they now merit a more comprehensive analysis. Two major news events triggered the downturn. The first was the publication of the July meeting minutes from the Federal Reserve, where the majority of the FOMC (Federal Open Market Committee) members expressed the possibility of raising the key interest rate in 2023. A higher rate boosts the yield on the dollar and government bonds, resulting in capital flight from riskier assets.
The second catalyst was an article in The Wall Street Journal, citing documents stating that Elon Musk's SpaceX had sold off its BTC holdings, writing off $373 million in cryptocurrency. Notably, the report did not specify when SpaceX sold these coins. However, as the ensuing panic showed, such details weren't necessary.
In another context, these two pieces of news might not have provoked such a violent reaction. However, prolonged market consolidation, low trading volumes in the spot market, and a large number of derivative positions opened by traders using leverage all contributed negatively. The fall in prices triggered a domino effect, leading to the liquidation of more than 175,000 leveraged positions in 24 hours, according to Coinglass data. Subsequently, the leverage ratio dropped to levels last seen in April.
Now, a week later, following the speech by the Federal Reserve Chair at Jackson Hole, it turns out that a rate hike might or might not happen. In other words, the Federal Reserve may put an end to its monetary tightening cycle and freeze the rate at its current level. This eliminates the first reason for panic. As for the second reason, it turns out that SpaceX had written off its crypto assets back in 2021-2022, rendering this "news" inconsequential.
However, what's done is done. Short-term BTC holders took the biggest hit: 88.3% of them are now in a losing position. This is a concern because these speculators are typically not known for their patience and could begin offloading their remaining crypto holdings, exerting further downward pressure on prices. On the other hand, it's worth noting that long-term holders (those holding for more than 155 days) took advantage of the situation to buy more coins, seeing it as an opportune time to bolster their portfolios.
After the crash on August 17, the voices advocating for a swift bitcoin rebound have become increasingly subdued, while the pessimists have gained momentum. However, even within their forecasts, the term "halving" is frequently mentioned, a concept upon which many influencers place great hopes. For example, an analyst known by the pseudonym Tolberti predicts a continuation of the bearish trend until bitcoin hits a bottom around $10,000 by the time of the halving in April 2024. This prediction is based on BTC's price falling below its 200-week and 20-month moving averages (MAs). Additionally, Tolberti notes the formation of a bearish flag on the chart, indicating a continued negative trend.
According to popular analyst Benjamin Cowen, the current downturn in the leading cryptocurrency may not be its last, and bitcoin will likely continue to fall. He believes that such a bearish trend is consistent with the current global economic trajectory. Cowen also pointed out that similar bitcoin declines happen every four years. "The fact is, every four years in August or September, the year before the U.S. presidential elections, there is a correction in the American market. And bitcoin correlates with U.S. stock market indices. If we look at 2023, we see this as well. In 2019, bitcoin plummeted 61%. In 2015, the decline was about 40%. In 2011, we saw a 'black swan' of 82.5%. That is, every year before the halving and American elections, we see a bitcoin decline," explained Cowen.
Dave the Wave, an analyst who accurately predicted the crypto market crash in May 2021, believes that the current bear market for bitcoin will last at least until the end of the year. The expert used his own version of logarithmic growth curves, which help forecast bitcoin's macro highs and lows while filtering out medium-term volatility and noise. According to his calculations, BTC is currently trading at the lower boundary of these logarithmic growth curves but is still in a "buy zone." Dave the Wave does not rule out that BTC may decline a bit more but anticipates that by mid-2024, specifically after the April halving, it will rise to new highs above $69,000.
According to a number of investors and traders, the Relative Strength Index (RSI) serves as a valuable tool for assessing the condition of an asset. The RSI oscillates between 0 and 100, with values above 70 typically indicating an overbought condition and values below 30 signalling an oversold condition.
The drop in bitcoin's daily RSI from August 17 to 22 below the 20 mark (hitting a low of 17.47) is comparable to the oversold levels seen during the market crash in March 2020, when the entire financial landscape was gripped by fear and uncertainty due to COVID-19. Analysts and traders are now closely monitoring RSI readings, as they could signal a potential bullish reversal in BTC's trend, although they are not a guaranteed indicator. Cryptocurrency markets are known for their unpredictability, and their direction can be influenced by a multitude of factors, among which political and macroeconomic elements play a significant role.
Wall Street legend, analyst, and trader Peter Brandt had already speculated a decline in bitcoin's price back in May. He identified a chart pattern known as a "pennant" or "flag," indicative of bearish implications. He now warns that bitcoin could break from the ascending trend that started in January 2023, as it approaches a critical price zone. The expert clarified that a close below $24,800 would damage both the daily and weekly charts and increase the likelihood that BTC's mid-term bullish momentum will falter.
Another analyst, publishing under the pseudonym Credible Crypto, noted that the current market scenario closely resembles what was observed in 2020. Back then, the leading digital currency's price rose from approximately $16,000 to $60,000 within a few months. According to the specialist, the market leader is now taking a "breather" after price gains earlier this year. He describes this as a normal correction. The current position almost fully mirrors the price dynamics of bitcoin from March to August 2020. What is happening now, in his opinion, suggests that the objective is asset accumulation.
Credible Crypto noted that bitcoin began its "parabolic rally" in 2020 right after such a phase. "Breaking out of the accumulation range last time triggered the next upward move, causing BTC's price to soar," said the expert. According to him, this time around, bitcoin has twice as much time, or about four months, to do it again in 2023. He emphasized that his forecast would be invalidated if the digital gold's quotations fall below $24,800: the same critical support level identified by Peter Brandt.
For the past week, the flagship cryptocurrency has been trading within the $25,500-26,785 channel around a Pivot Point of $26,000, suggesting there is no compelling reason for either its rise or fall. As of the time of writing this overview, on the evening of Friday, August 25, BTC/USD is trading at approximately $26,050. The overall market capitalization of the cryptocurrency market stands at $1.047 trillion (compared to $1.054 trillion a week ago). The Bitcoin Fear & Greed Index remains in the "Fear" zone at a score of 39 points (compared to 37 points a week ago).
EUR/USD Weekly Outlook
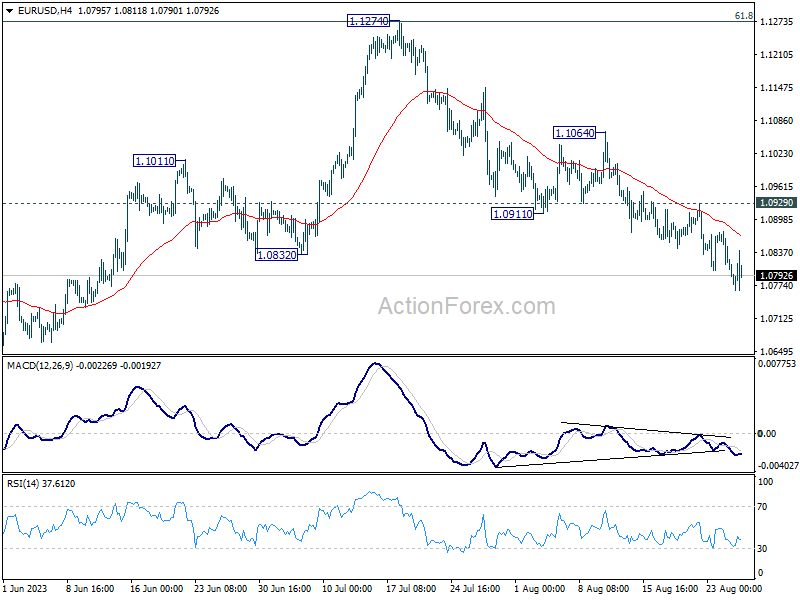
EUR/USD's fall from 1.1274 continued last week and broke through 1.0832 support. Initial bias stays on the downside this week for 1.0609/34 cluster support next. On the upside, break of 1.0929 resistance is needed to indicate short term bottoming. Otherwise, outlook will remain bearish in case of recovery.
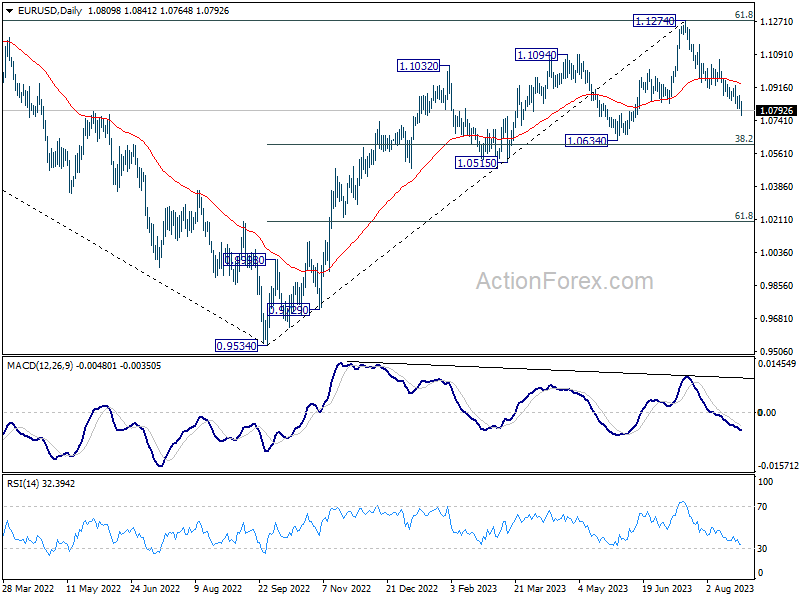
In the bigger picture, fall from 1.1274 medium term top is seen as a correction to up trend from 0.9534 (2022 low). Deeper decline would be seen to 1.0634 cluster support (38.2% retracement of 0.9534 to 1.1274 at 1.0609). Strong support could be seen there, at least on first attempt, to bring rebound. Yet, medium term outlook will be neutral for now, as long as 1.1274 resistance holds.
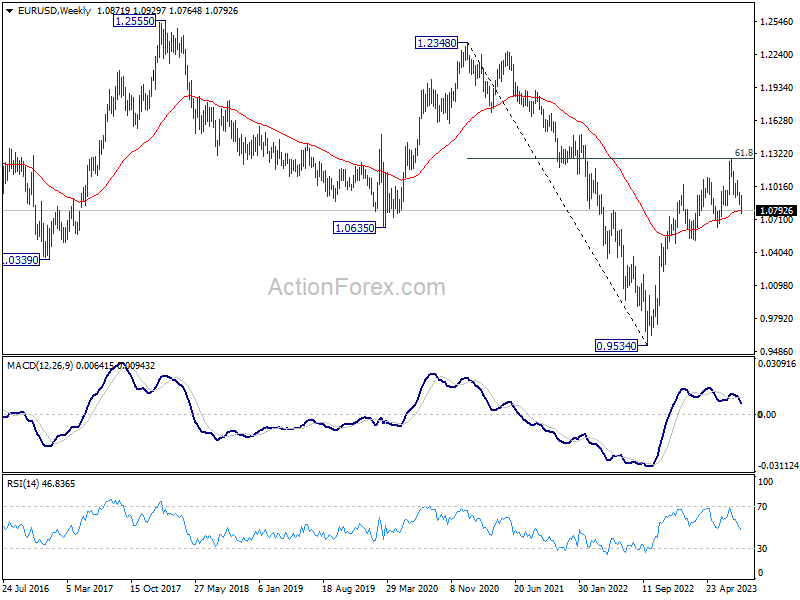
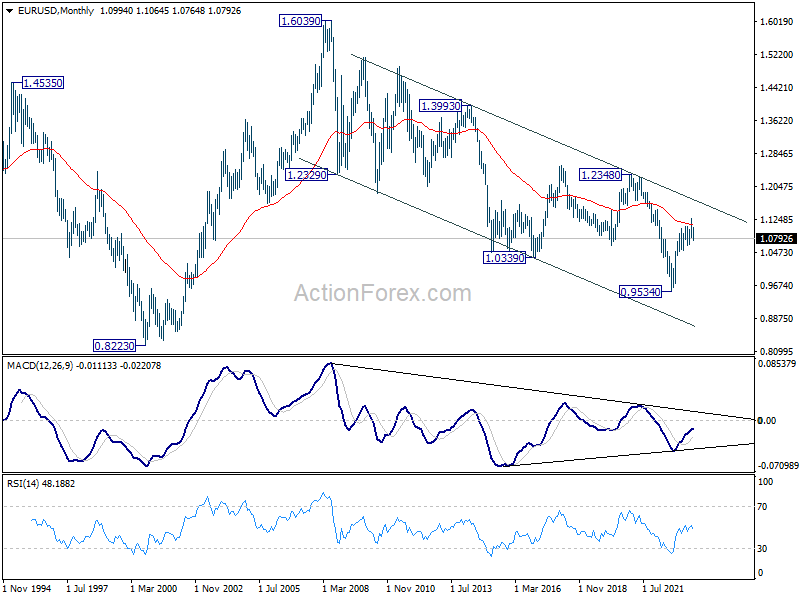
In the long term picture, focus stays on 55 M EMA (now at 1.1124). Rejection by this EMA will revive long term bearishness. However, sustained break above here will be affirm the case of long term bullish reversal and target 1.2348 resistance for confirmation.
USD/JPY Weekly Outlook
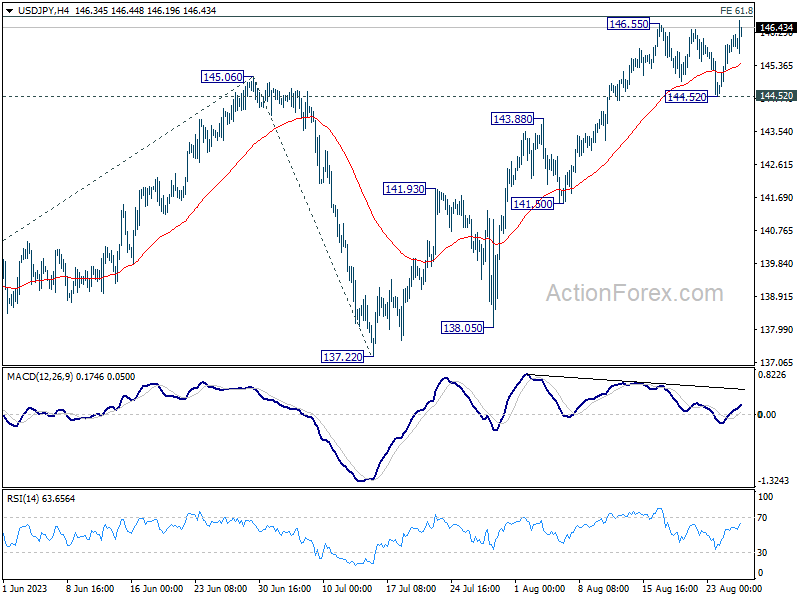
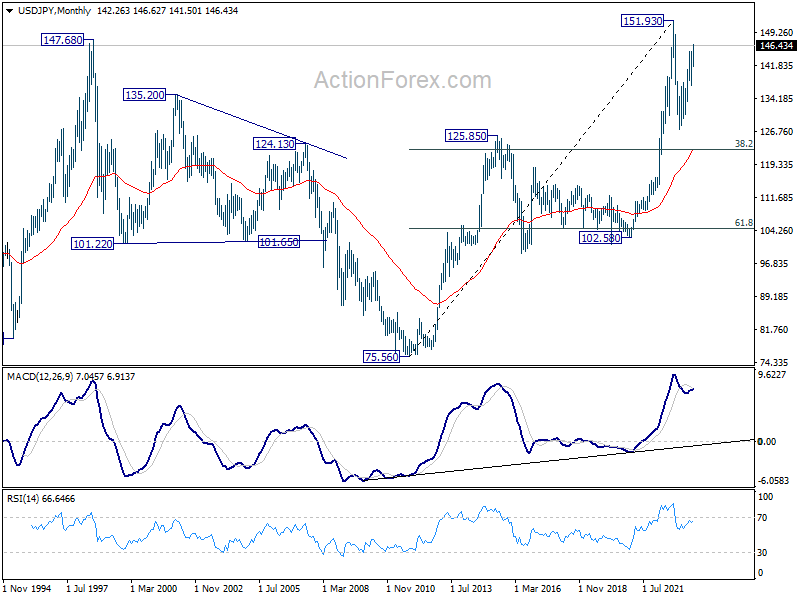
USD/JPY's late breach of 146.55 suggests that rise from 137.22 is resuming. Initial bias is mildly on the upside this week. sustained break of 61.8% projection of 129.62 to 145.06 from 137.22 at 146.76 will pave the way to retest 151.93 high. For now, outlook will stays cautiously bullish as long as 144.52 support holds, in case of retreat.
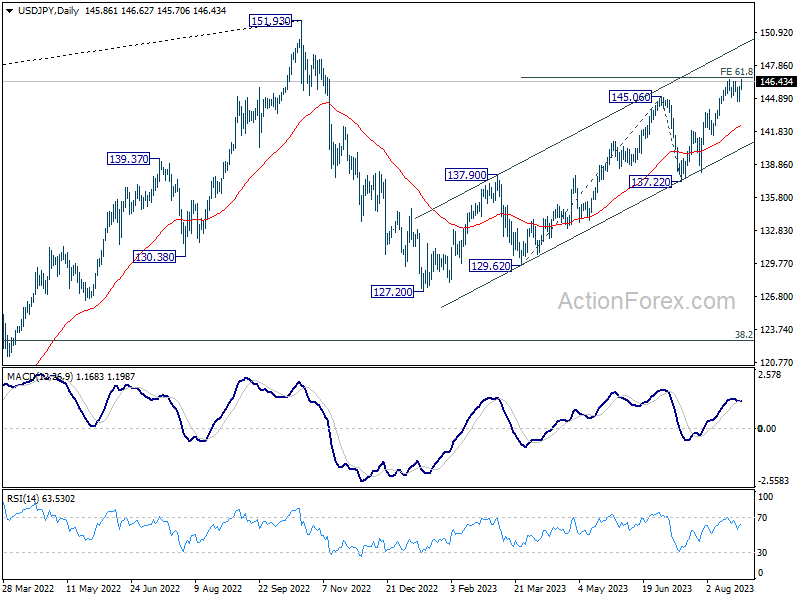
In the bigger picture, overall price actions from 151.93 (2022 high) are views as a corrective pattern. Rise from 127.20 is seen as the second leg of the pattern and could still be in progress. But even in case of extended rise, strong resistance should be seen from 151.93 to limit upside. Meanwhile, break of 137.22 support should confirm the start of the third leg to 127.20 (2023 low) and below.
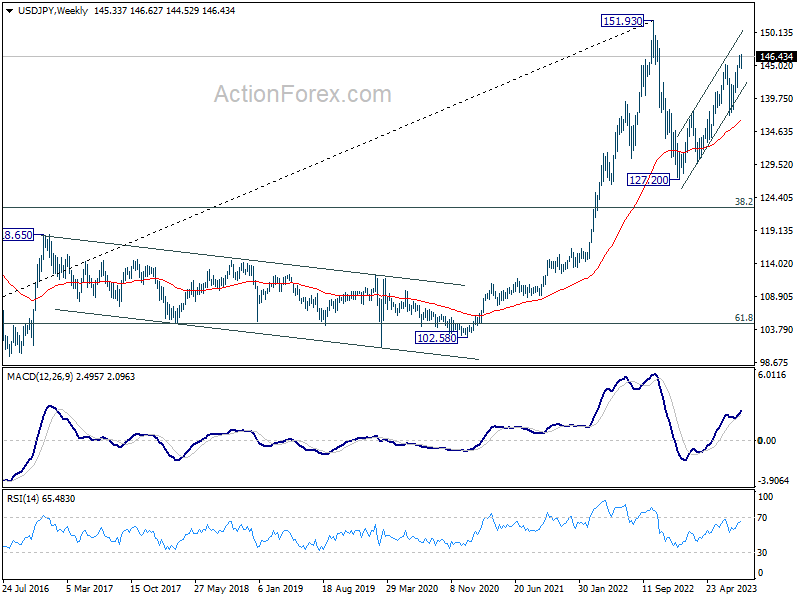
In the long term picture, price action from 151.93 is seen as developing into a corrective pattern to up trend from 75.56 (2011 low). While deeper decline cannot be ruled out, downside should be contained by 38.2% retracement of 75.56 to 151.93 at 122.75.
GBP/USD Weekly Outlook
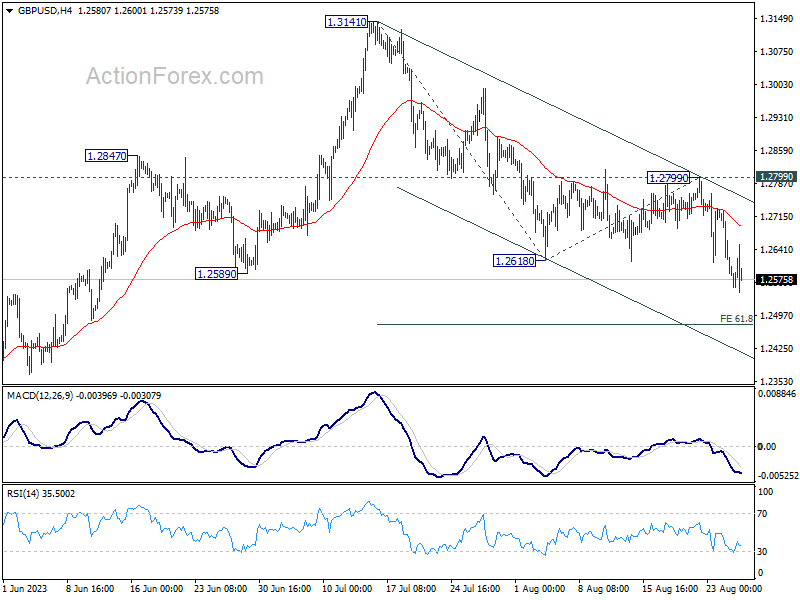
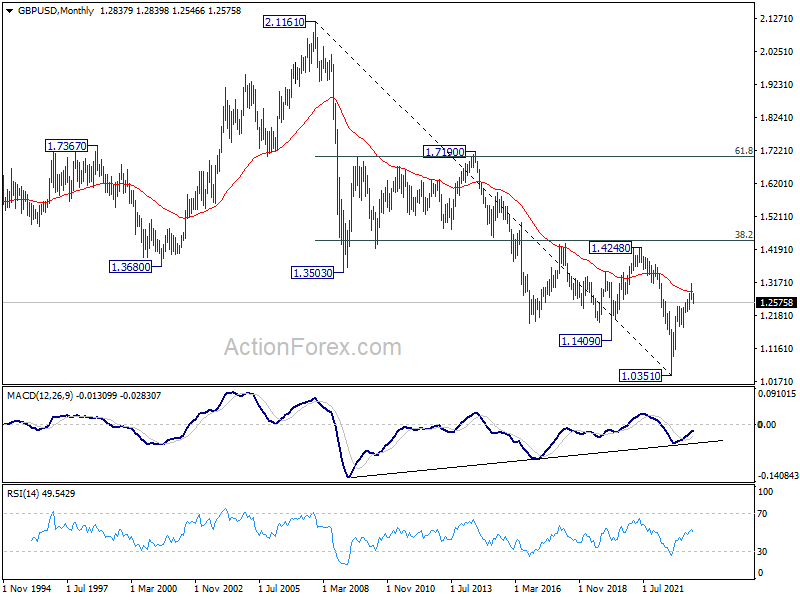
GBP/USD's decline from 1.3141 resumed last week and hit as low as 1.2546. Initial bias stays on the downside this week for 61.8% projection of 1.3141 to 1.2618 from 1.2799 at 1.2476. Firm break there could prompt downside acceleration to 100% projection at 1.2276. On the upside, break of 1.2799 resistance is needed to confirm completion of the decline. Otherwise, near term outlook will stay bearish in case of recovery.
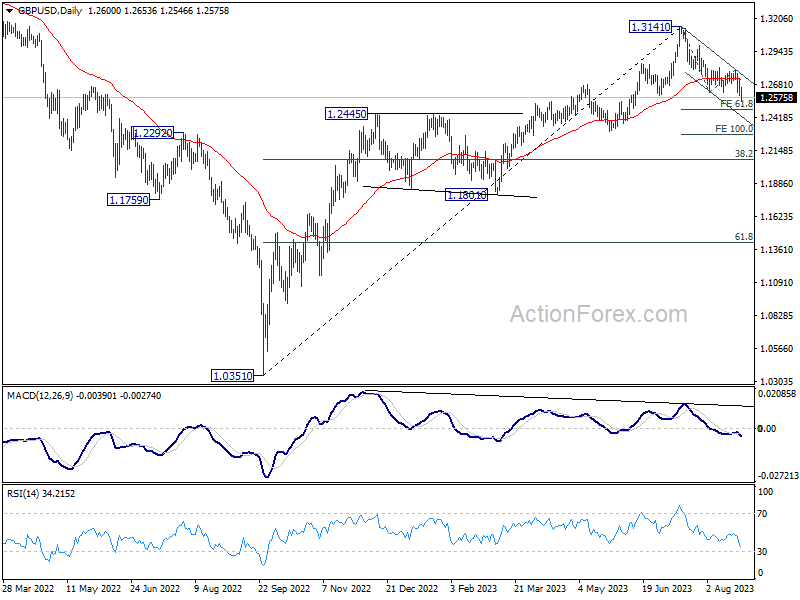
In the bigger picture, for now, fall from 1.3141 medium term top is seen as a correction to up trend from 1.0351 (2022 low). Deeper decline would be seen to 38.2% retracement of 1.0351 to 1.3141 at 1.2075. Strong support would be seen there to bring rebound on first attempt. But outlook will be neutral at best as long as 1.3141 resistance holds, and consolidation from there is set to extend, until further development.
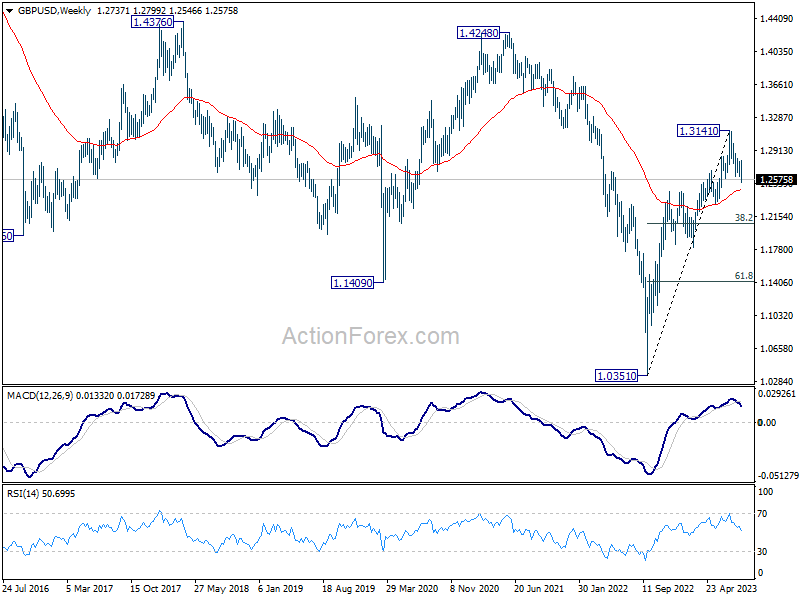
In the long term picture, sustained trading above 55 M EMA (now at 1.2902) will add to the case of long term bullish reversal, and target 1.4248 cluster resistance (38.2% retracement of 2.1161 (2007 high) to 1.0351 at 1.4480) for confirmation. Nevertheless, rejection by 55 M EMA will maintain long term bearishness for downside resumption at a later stage.
USD/CHF Weekly Outlook
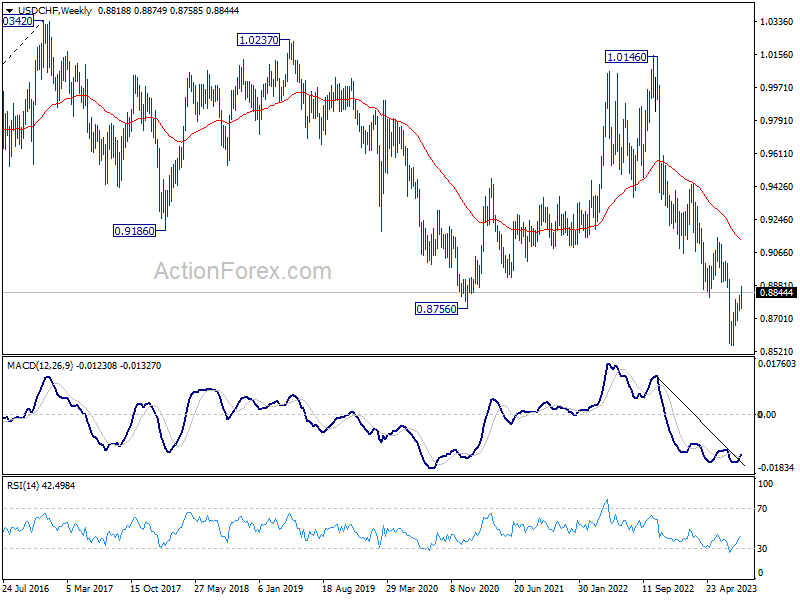
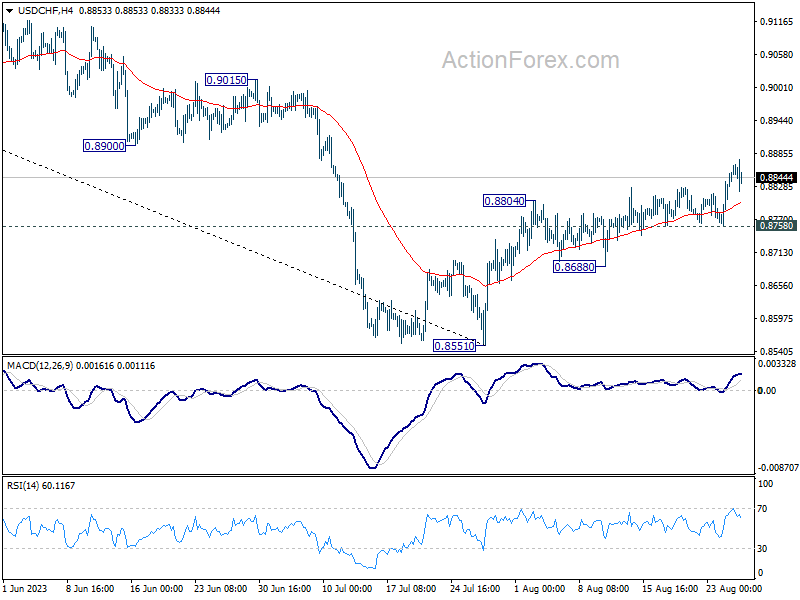
USD/CHF's rise from 0.8551 resumed last week. Initial bias stays on the upside this week. Further rally is expected to 0.9146 cluster resistance next. On the downside, break of 0.8758 support is needed to indicate completion of the rebound from 0.8551. Otherwise, near term outlook is cautiously bullish in case of retreat.
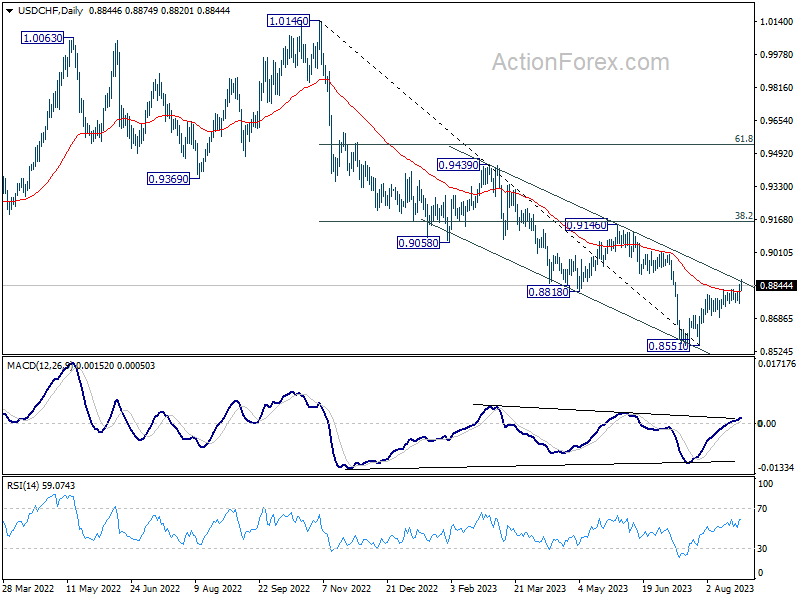
In the bigger picture, rebound from 0.8551 medium term bottom is currently seen as a correction to the downtrend from 1.0146 (2022 high). Further rally would be seen to 0.9146 cluster resistance (38.2% retracement of 1.0146 to 0.8551 at 0.9160). Strong resistance could be seen there to limit upside, at least on first attempt. Nevertheless, medium term outlook is neutral at best as long as 0.8551 holds, until further developments.
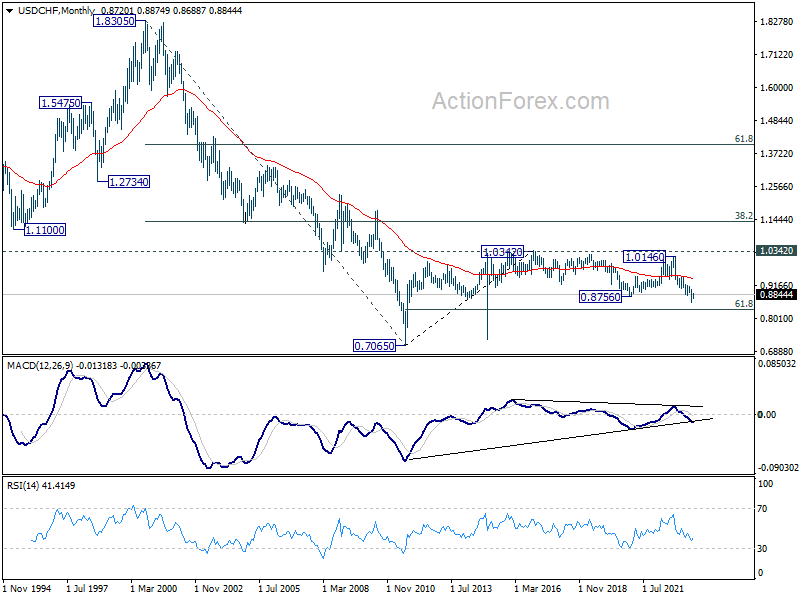
In the long term picture, there is no clear sign that down trend from 1.8305 (2000 high) has completed. With 38.2% retracement of 1.8305 to 0.7065 at 1.1359 intact, outlook is neutral at best. Sustained break of 61.8% retracement of 0.7065 (2011 low) to 1.0342 (2016 high) at 0.8317 will bring retest of 0.7065 low.