

Sample Category Title
EUR/AUD Daily Outlook
Daily Pivots: (S1) 1.6796; (P) 1.6841; (R1) 1.6907; More...
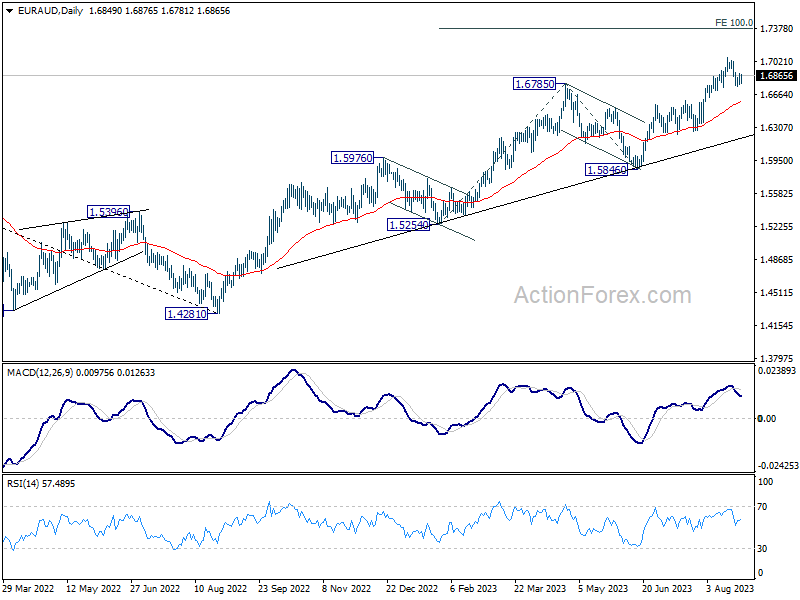
Intraday bias in EUR/AUD stays neutral at this point. And further rally is in favor with 1.6737 support intact. On the upside, firm break of 1.7062 resistance will resume larger up trend to 1.7377 projection level next. However, firm break of 1.6737 will bring deeper pull back to 1.6601 resistance turned support instead.
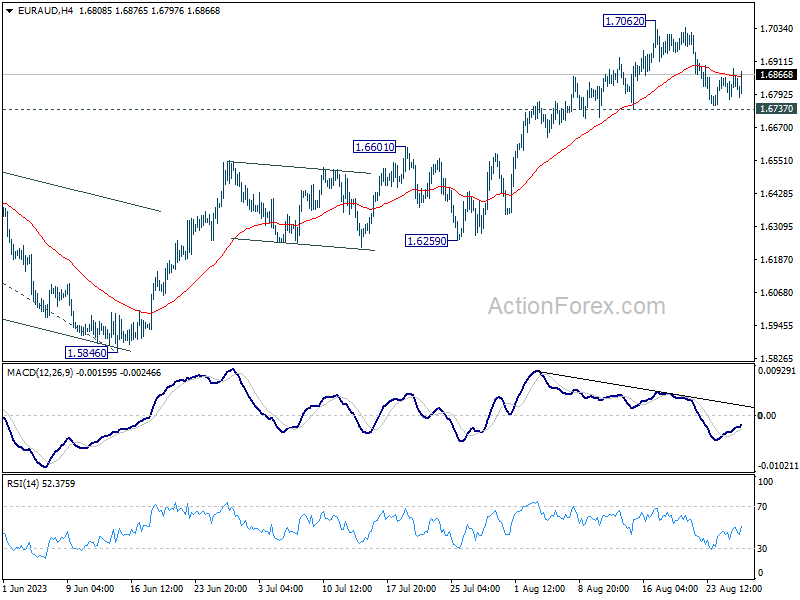
In the bigger picture, the rise from 1.4281 (2022 low) is in progress. Next target is 100% projection of 1.5254 to 1.6785 from 1.5846 at 1.7377. For now, outlook will stay bullish as long as 1.5846 support holds, even in case of another pull back.
EUR/CHF Daily Outlook
Daily Pivots: (S1) 0.9541; (P) 0.9555; (R1) 0.9565; More...
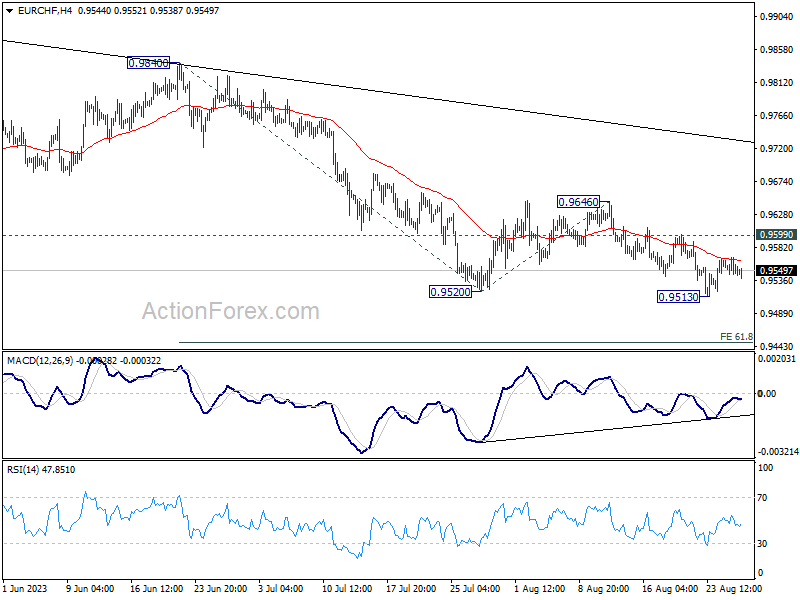
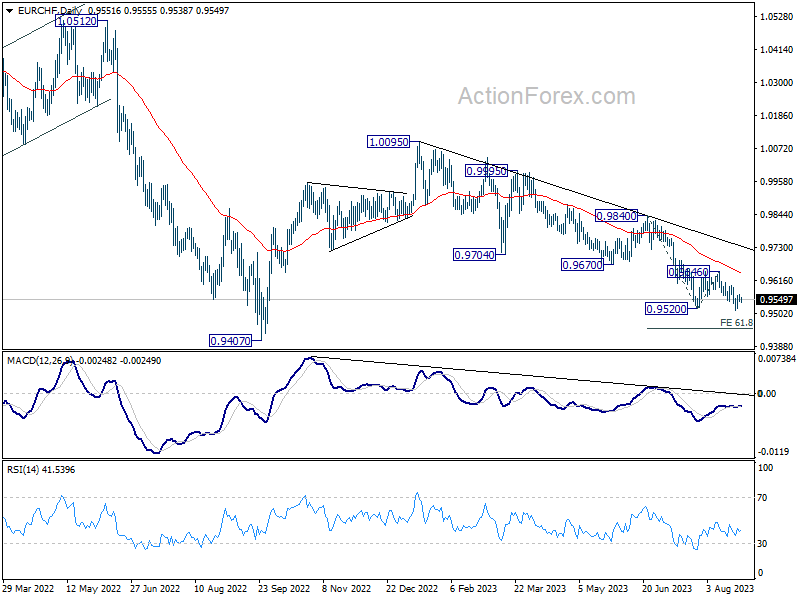
Range trading continues in EUR/CHF and intraday bias remains neutral at this point. Further decline is expected as long as 0.9599 resistance. Break of 0.9513 will target 61.8% projection of 0.9840 to 0.9520 from 0.9646 at 0.9448.
In the bigger picture, medium term outlook is staying bearish as the pair is capped well below falling 55 W EMA (now at 0.9839). Down trend from 1.2004 (2018 high) is in favor to continue. Sustained break of 0.9407 will target 61.8% projection of 1.1149 to 0.9407 from 1.0095 at 0.9018. For now, this will remain the favored case as long as 0.9670 support turned resistance holds, in case of strong rebound.
Gold Reclaims 200-day SMA After Bouncing Off 5-month Low
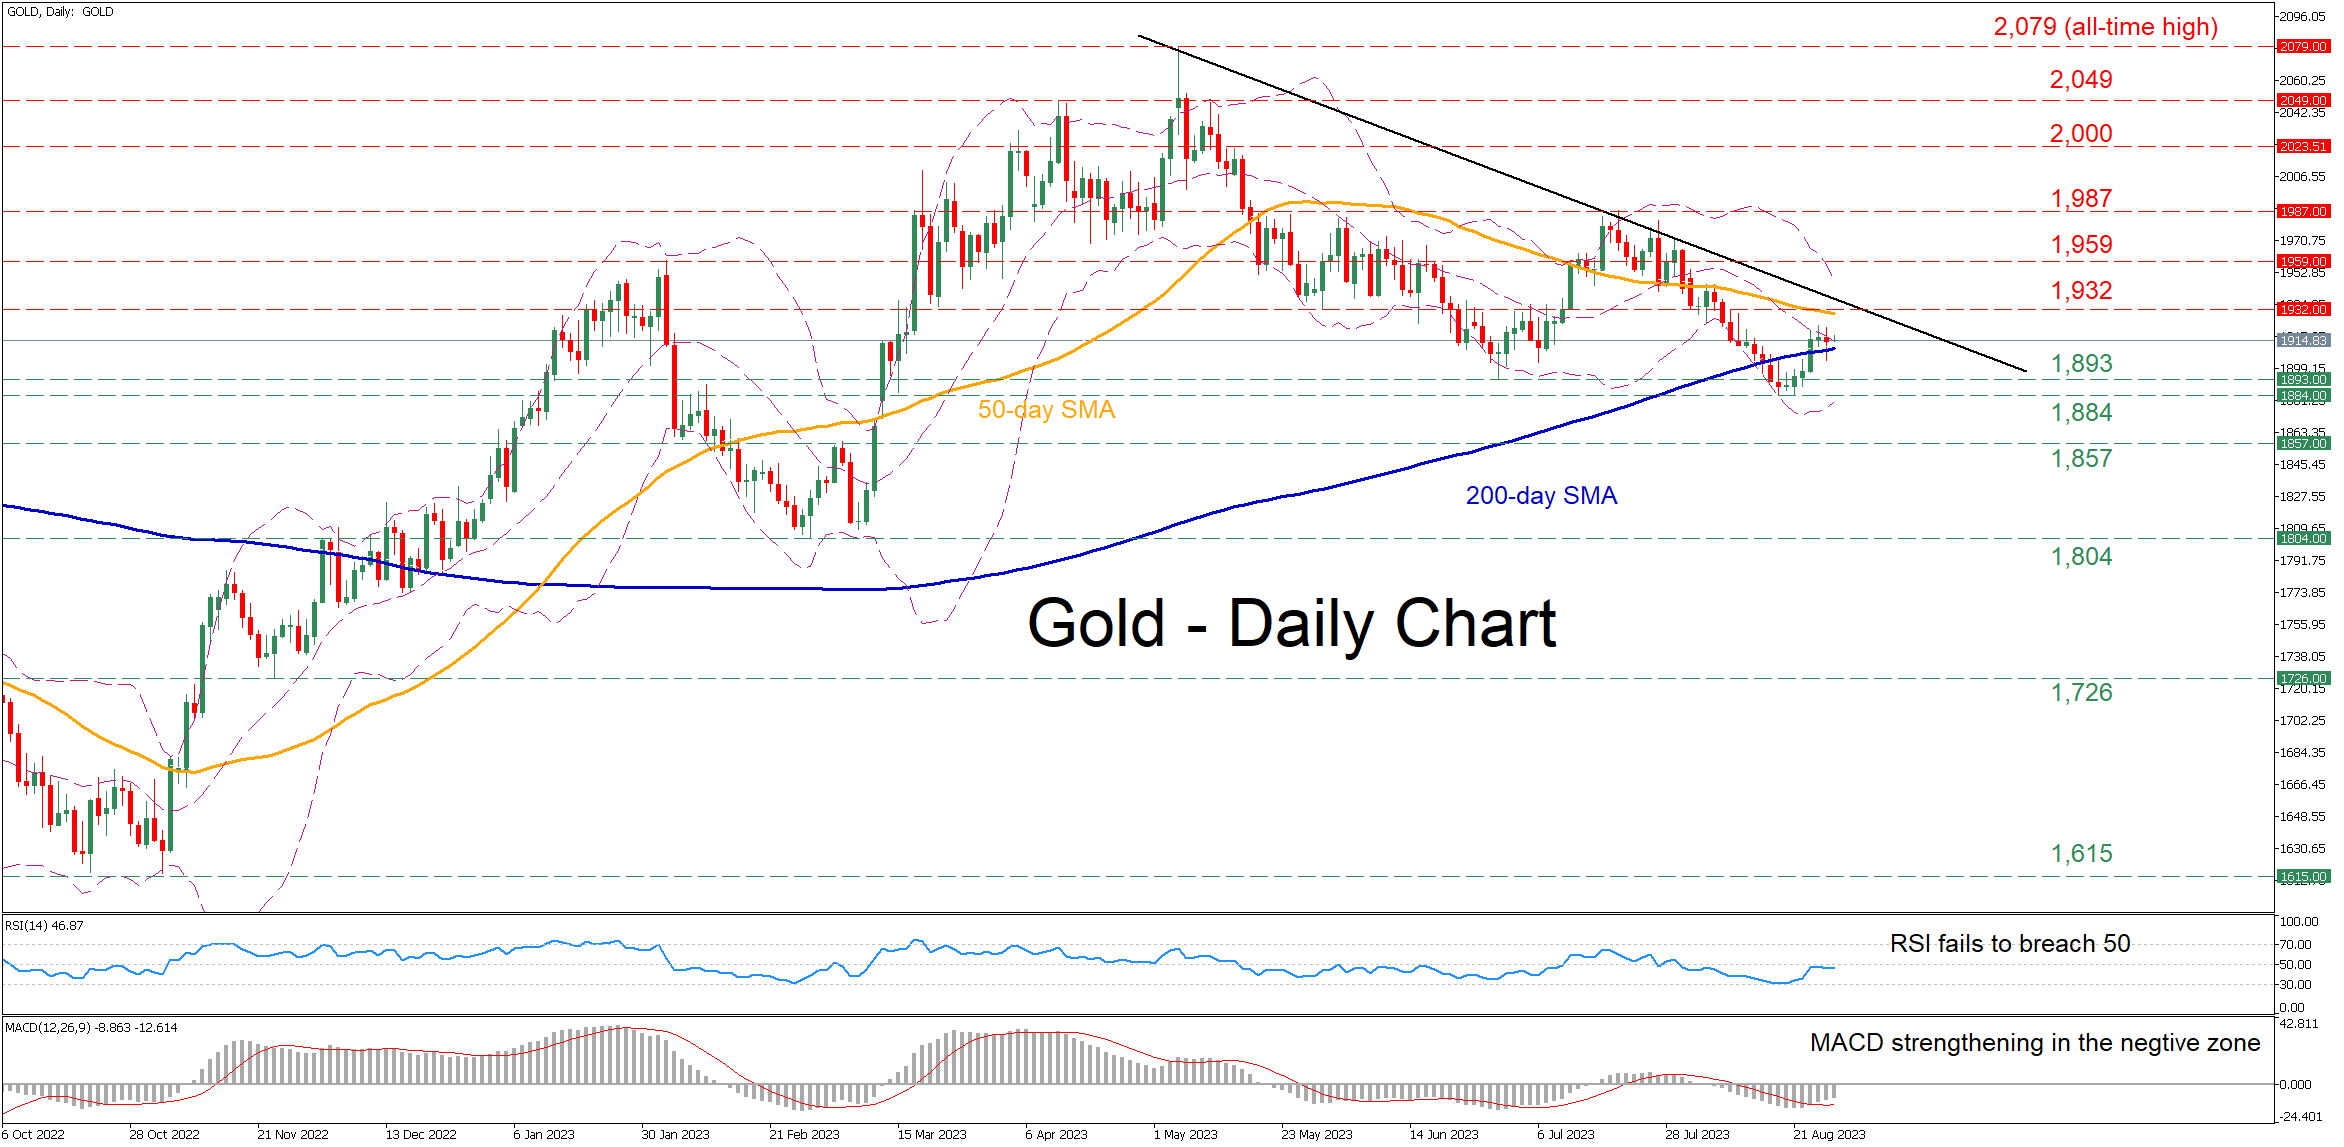
Gold had been experiencing a strong pullback following its recent peak at 1,987, with the price falling to a fresh five-month low of 1,884. However, bullion managed to find its footing and recoup some losses, jumping back above the crucial 200-day simple moving average (SMA).
The momentum indicators currently suggest that bearish forces are fading but remain in control. Specifically, the RSI gained significant ground but failed to pierce through its 50-neutral threshold, while the MACD is strengthening above its red signal line in the negative zone.
If the price extends its recent recovery, immediate resistance could be found at the May low of 1,932, which overlaps with the 50-day SMA. Conquering this barricade, the bulls could attempt to propel the price above the descending trendline that connects its recent lower highs before it tests the February high of 1,959. Further advances may then cease at the July peak of 1,987.
Alternatively, should bullion reverse back lower, the June bottom of 1,893 could act as the first line of defense. A violation of that territory might open the door for the five-month low of 1,884. Should that barricade also fail, the spotlight could turn to the March resistance of 1,857.
In brief, gold appears to be regaining traction after bouncing off strongly from its five-month low. However, a break above the downward sloping trendline is needed for the short-term picture to turn back to bullish.
USD/CAD Daily Outlook
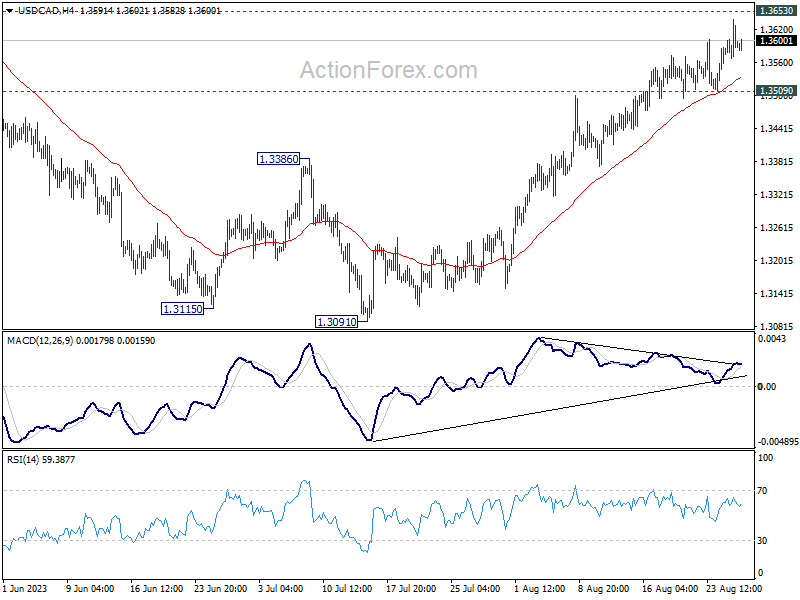
Daily Pivots: (S1) 1.3569; (P) 1.3605; (R1) 1.3640; More....
Intraday bias in USD/CAD remains on the upside at this point. Decisive break of 1.3653 resistance there will confirm that correction from 1.3976 has completed, and target a test on this high. On the downside, however, break of 1.3509 support will indicate short term topping, and turn bias to the downside for some correction first.
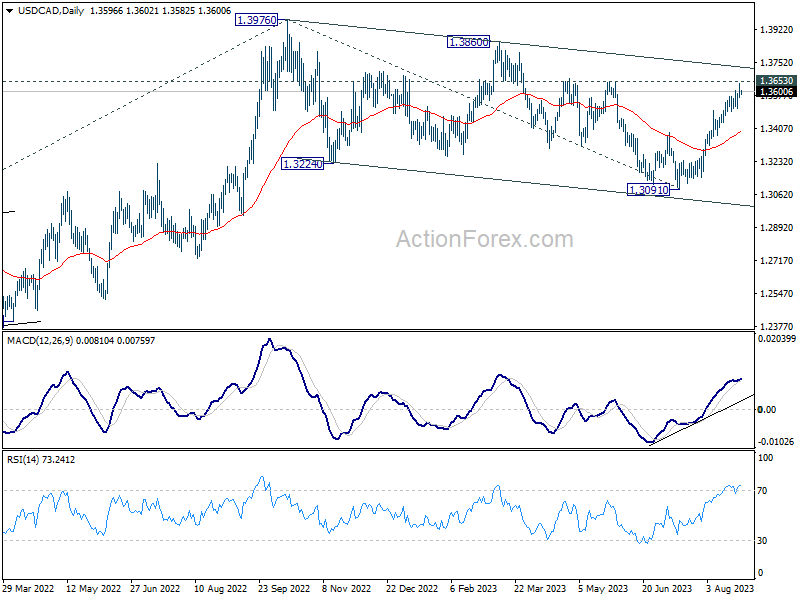
In the bigger picture, price actions from 1.3976 are viewed as a corrective pattern only. Upon completion, rise from 1.2005 (2021 low) would resume through 1.3976. Next target is 61.8% projection of 1.2005 to 1.3976 from 1.3091 at 1.4309. For now, this will remain the favored case as long as 55 D EMA (now at 1.3387) holds.
AUD/USD Daily Report
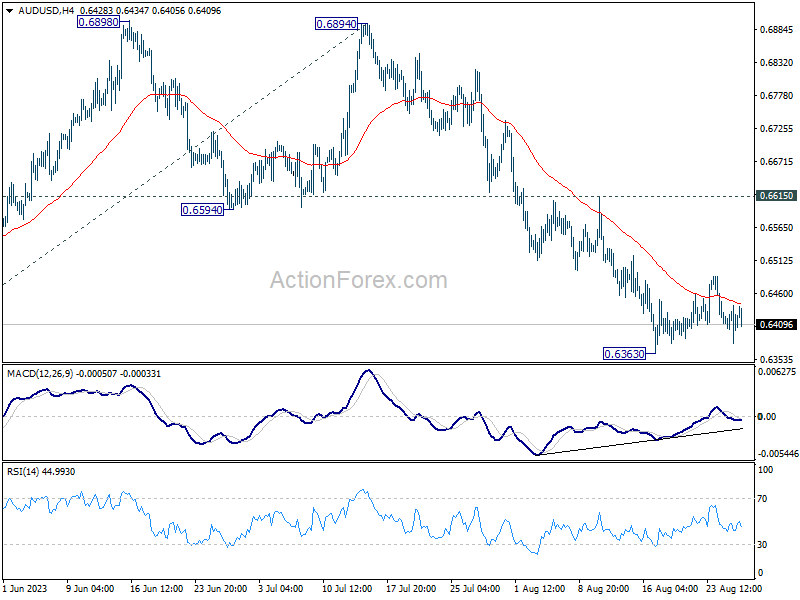
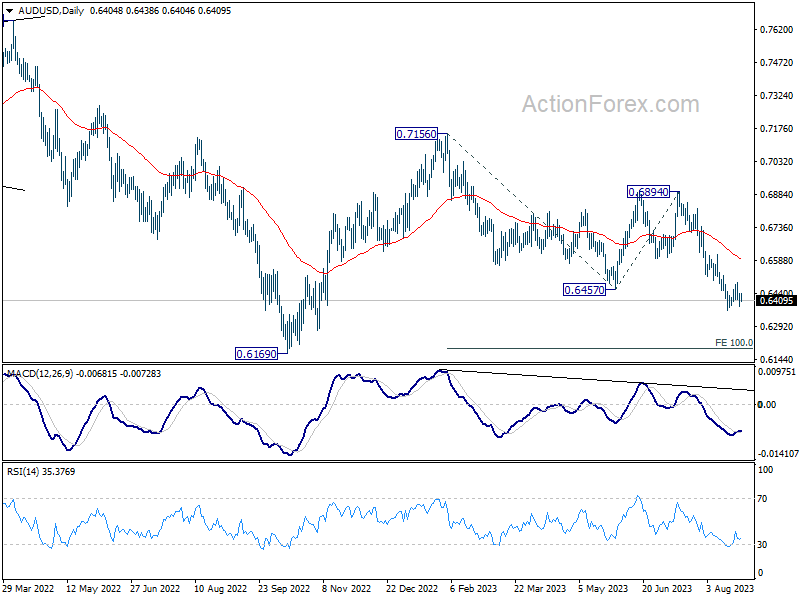
Daily Pivots: (S1) 0.6375; (P) 0.6409; (R1) 0.6436; More...
Intraday bias in AUD/USD remains neutral as consolidation from 0.6363 is extending. While stronger recovery cannot be ruled out, upside should be limited by 0.6615 resistance. Break of 0.6363 will resume larger fall from 0.7156 to 100% projection of 0.7156 to 0.6457 from 0.6894 at 0.6195.
In the bigger picture, current development argues that the down trend from 0.8006 (2021 high) is still in progress. Decisive break of 0.6169 will target 61.8% projection of 0.8006 to 0.6169 to 0.7156 at 0.6021. This will now remain the favored case as long as 0.6894, in case of strong rebound.
USD/JPY Daily Outlook
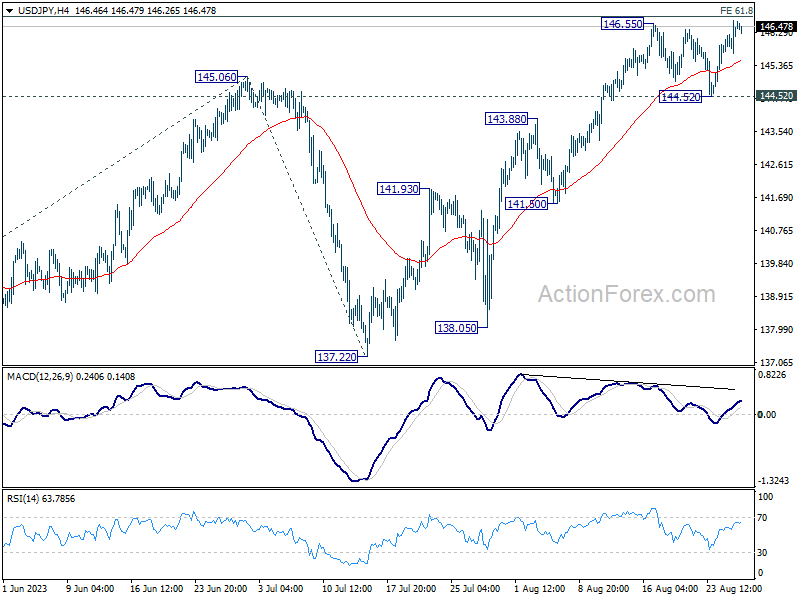
Daily Pivots: (S1) 145.89; (P) 146.26; (R1) 146.79; More...
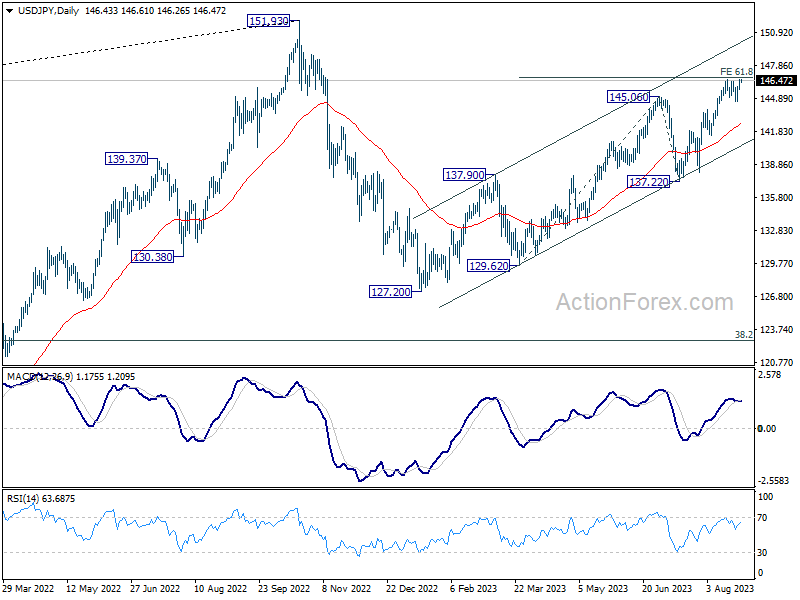
Intraday bias in USD/JPY remains mildly on the upside for the moment. Sustained break of 61.8% projection of 129.62 to 145.06 from 137.22 at 146.76 will pave the way to retest 151.93 high. For now, outlook will stays cautiously bullish as long as 144.52 support holds, in case of retreat.
In the bigger picture, overall price actions from 151.93 (2022 high) are views as a corrective pattern. Rise from 127.20 is seen as the second leg of the pattern and could still be in progress. But even in case of extended rise, strong resistance should be seen from 151.93 to limit upside. Meanwhile, break of 137.22 support should confirm the start of the third leg to 127.20 (2023 low) and below.
USD/CHF Daily Outlook
Daily Pivots: (S1) 0.8820; (P) 0.8848; (R1) 0.8874; More....
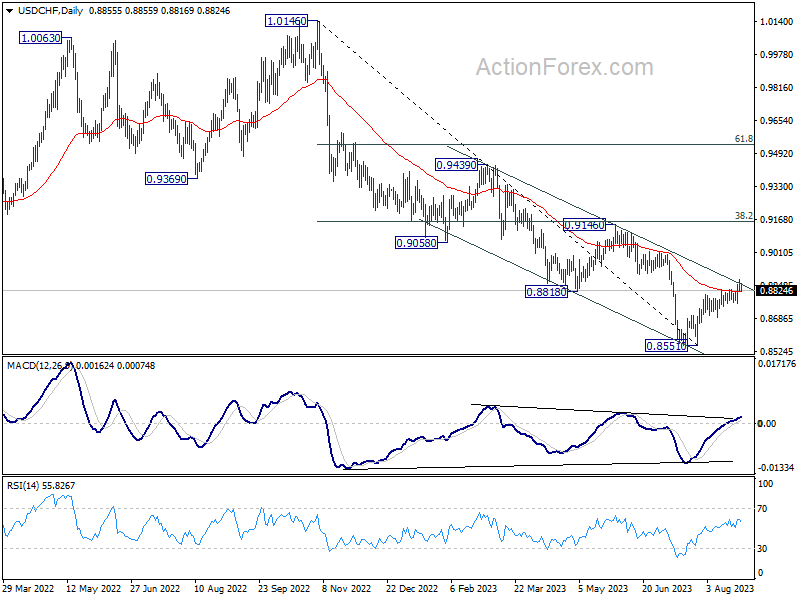
Intraday bias in USD/CHF is turned neutral with today's retreat. But further rally is expected with 0.8758 support intact. Break of 0.8874 will resume the rise from 0.8551 to 0.9146 cluster resistance next.
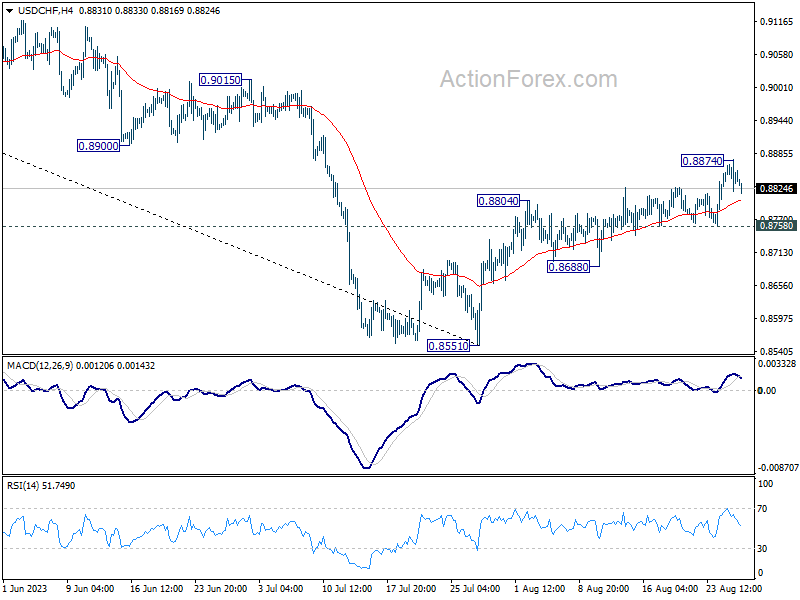
In the bigger picture, rebound from 0.8551 medium term bottom is currently seen as a correction to the downtrend from 1.0146 (2022 high). Further rally would be seen to 0.9146 cluster resistance (38.2% retracement of 1.0146 to 0.8551 at 0.9160). Strong resistance could be seen there to limit upside, at least on first attempt. Nevertheless, medium term outlook is neutral at best as long as 0.8551 holds, until further developments.
EUR/USD Daily Outlook
Daily Pivots: (S1) 1.0761; (P) 1.0801; (R1) 1.0837; More...
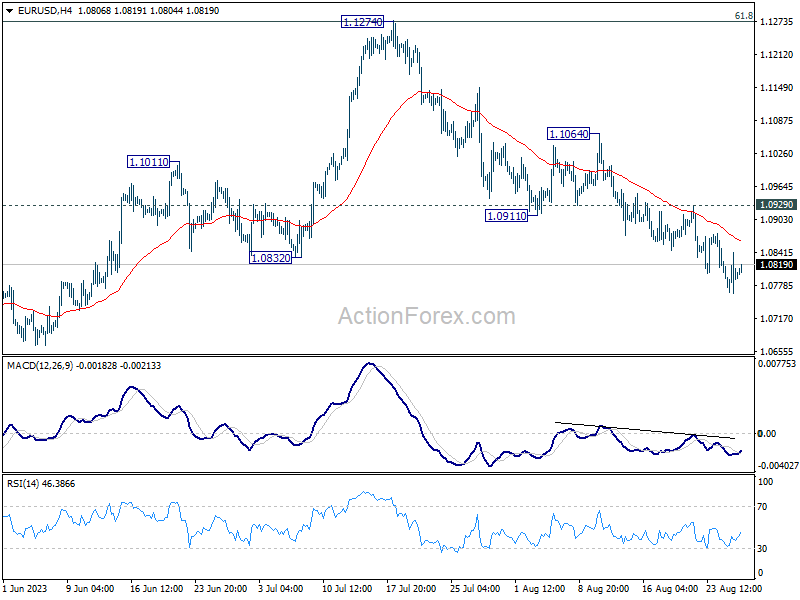
Intraday bias in EUR/USD stays on the downside for the moment. Current fall from 1.1274 should target 1.0609/34 cluster support next. On the upside, break of 1.0929 resistance is needed to indicate short term bottoming. Otherwise, outlook will remain bearish in case of recovery.
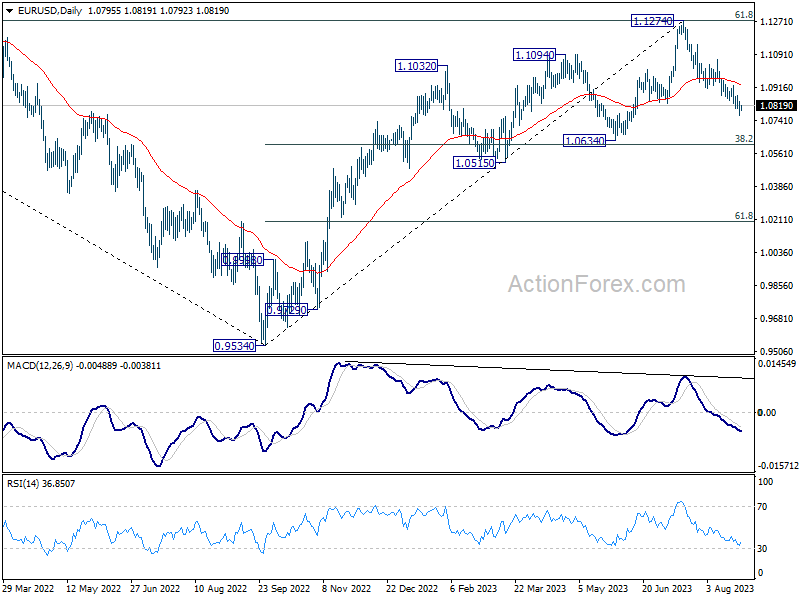
In the bigger picture, fall from 1.1274 medium term top is seen as a correction to up trend from 0.9534 (2022 low). Deeper decline would be seen to 1.0634 cluster support (38.2% retracement of 0.9534 to 1.1274 at 1.0609). Strong support could be seen there, at least on first attempt, to bring rebound. Yet, medium term outlook will be neutral for now, as long as 1.1274 resistance holds.
CADJPY Dips Keep Finding Buyers At Equal Legs Area
In this technical blog, we will look at the past performance of the 1-hour Elliott Wave Charts of the CADJPY. The rally from the 28 July 2023 low showed a higher high sequence & provided a short-term extreme trading opportunity. In this case, the pullback managed to reach the equal legs area & provided a buying opportunity. So, we advised members not to sell it but to buy the equal legs area for a minimum reaction higher to happen. We will explain the structure & forecast below:
CADJPY 1-Hour Elliott Wave Chart From 8.23.2023
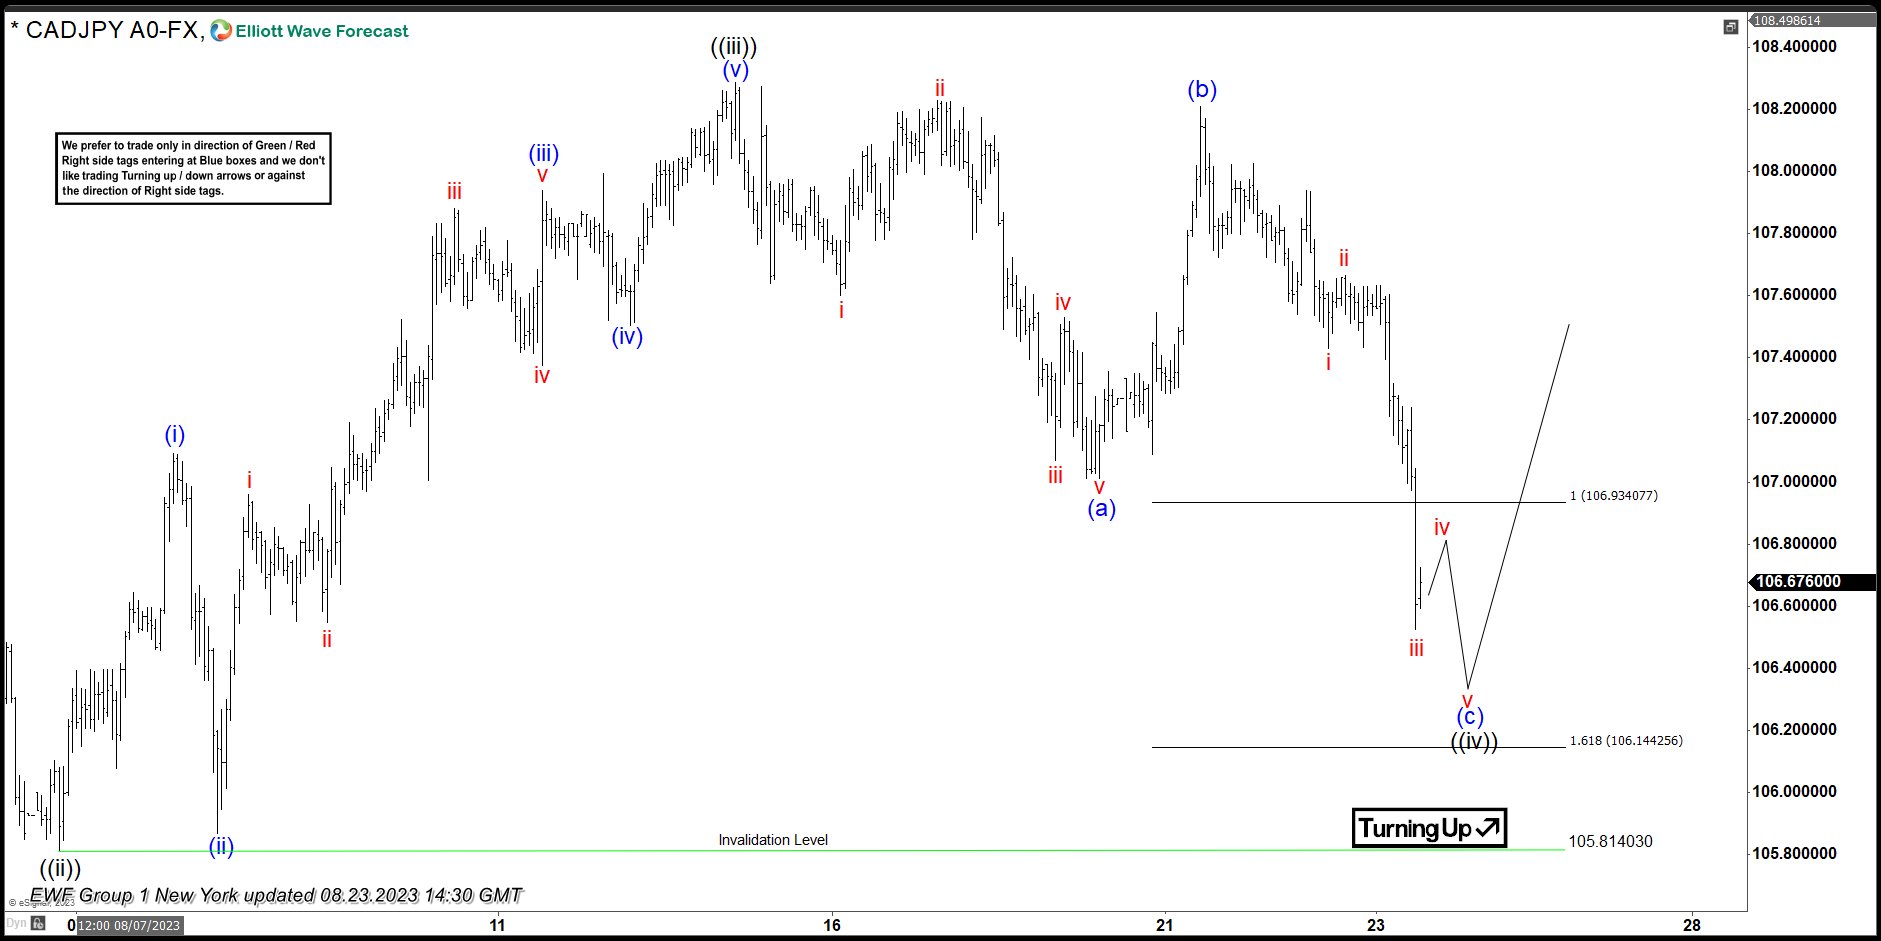
Here’s the 1-hour Elliott wave Chart from the 08/23/2023 New York update. In which, the rally to 108.28 high ended the wave ((iii)) & made a pullback in wave ((iv)). The internals of that pullback unfolded as Elliott wave zigzag structure where lesser degree wave (a) ended at 101.01 low. Then a short-term bounce to 108.20 high ended wave (b) & started the next leg lower in wave (c) towards 106.93- 16.14 equal legs area. From there, buyers were expected to appear looking for new highs ideally or for a 3-wave bounce minimum.
CADJPY Latest 1-Hour Elliott Wave Chart From 8.26.2023
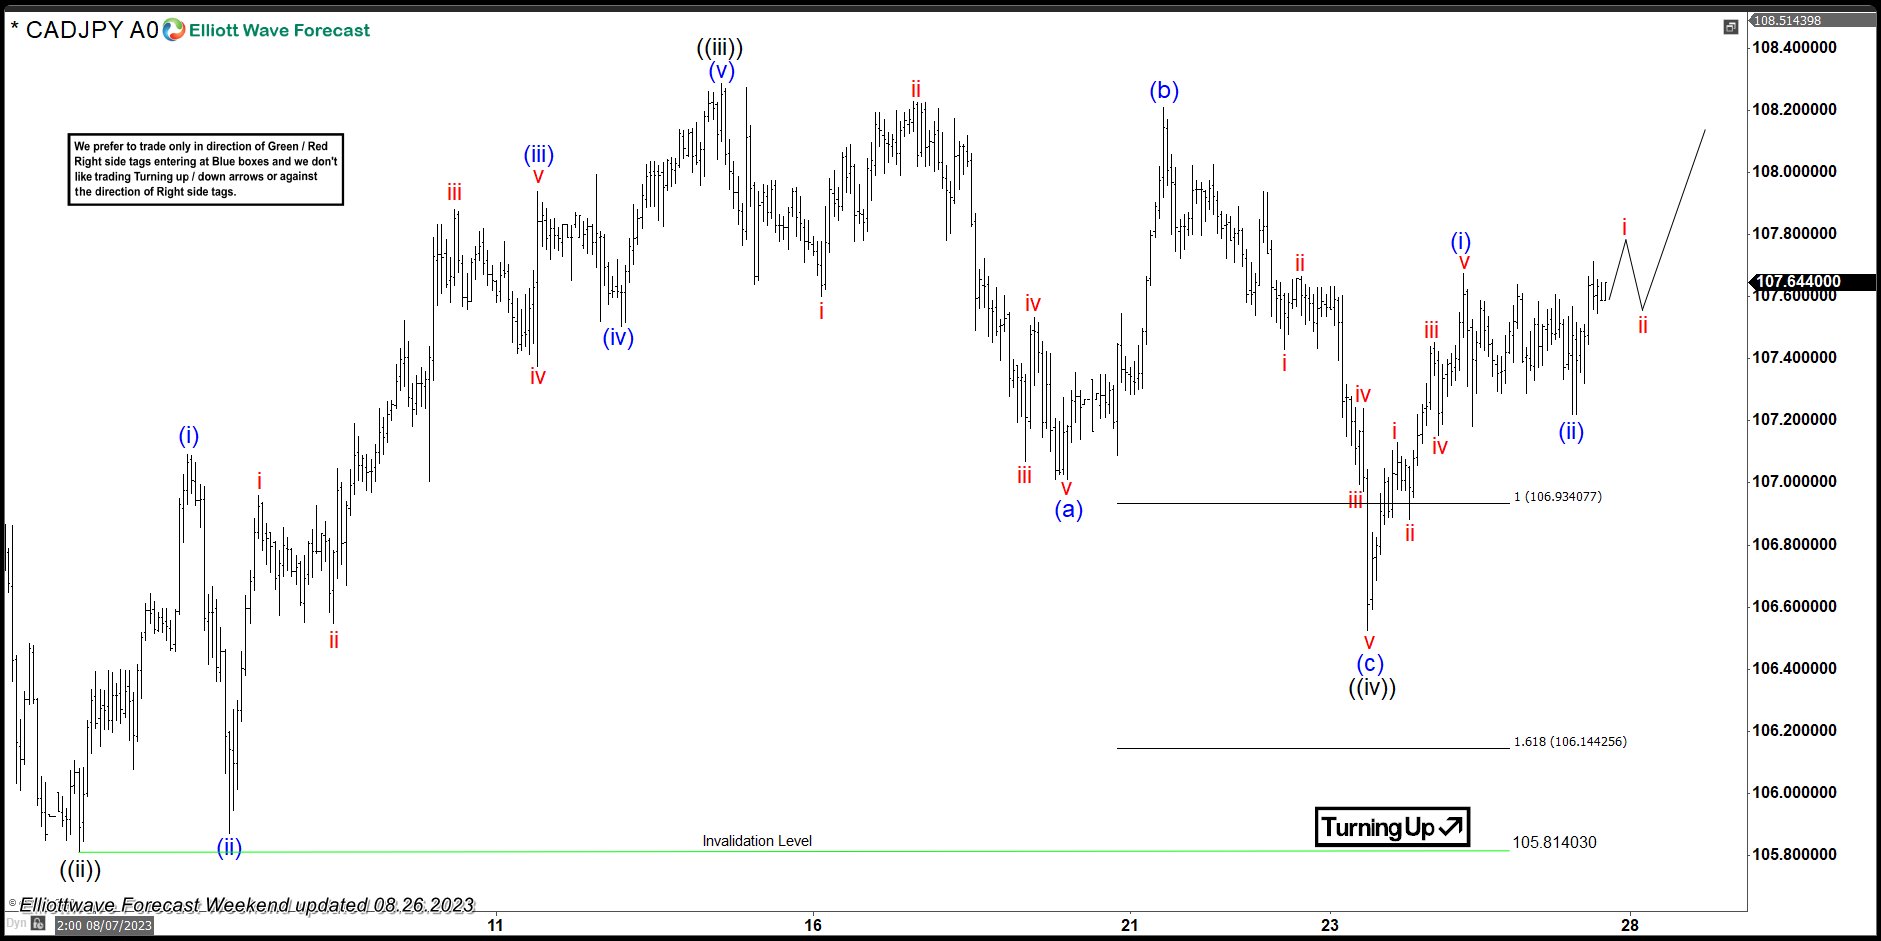
Above is the Latest 1-hour Elliott wave Chart from the 8/26/2023 Weekend update. In which the pair is showing a reaction higher taking place from the equal legs area. Right after ending the zigzag correction. Allowed members to create a risk-free position shortly after taking a long position. But a break above 108.28 high would still be needed to confirm the next leg higher minimum towards the 108.68- 109.35 area before the next pullback takes place.
E-mini S&P 500 Reacts Positively to Powell’s Speech
According to the head of the Fed's Friday words:
→ Strengthening the economy may lead to rising inflation and require new increases;
→ the Fed will tread lightly in upcoming meetings;
→ the Fed is ready to continue raising rates if necessary.
Overall, there were no surprises and the surge in financial market volatility was relatively minor. The dollar index rose sharply, but then by the end of the trading week it gradually decreased — the fact that the bulls could not keep the progress made can be interpreted as a bearish sign due to the emotions of market participants during the speech of the head of the Fed.
And gold, on the contrary, decreased in price, but then won back the losses. The stock market works in a similar way.
The S&P 500 Index chart shows that:
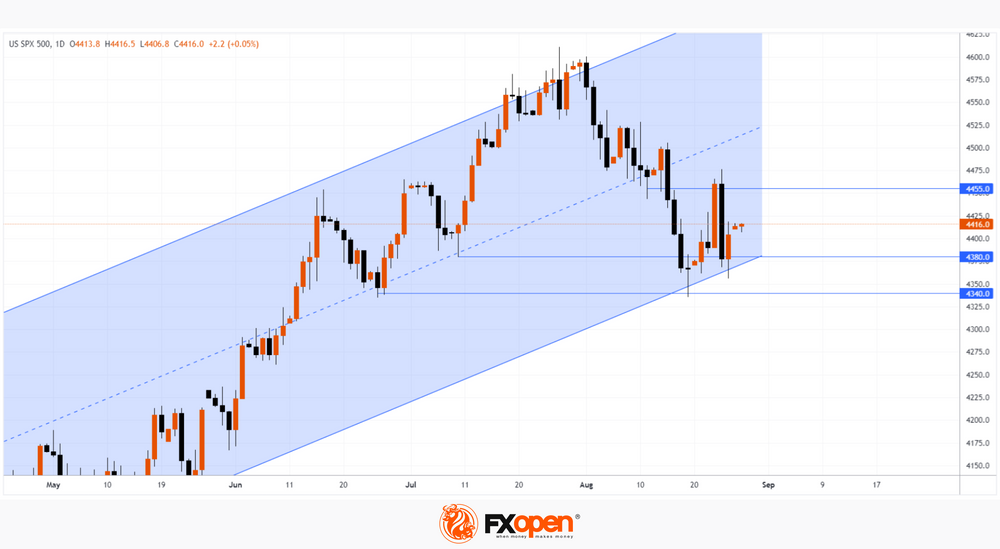
→ the price of the index finds support in the 4,340-4,380 zone, where the June-July lows were formed;
→ price support is also noticeable from the lower border of the rising channel, which has been operating all summer;
→ the week started near Friday's high – that is, after the weekend, market participants find positivity after the Friday speech of the head of the Fed.
However, the overall picture is thickening with broad bearish impulses:
→ August 15-18;
→ 24th August.
It is possible that supply and demand can find a balance so that the price of the S&P 500 index will consolidate within the range, which is limited by the 4,340-4,380 zone from below and the resistance level of 4,455 from above.
This article represents the opinion of the Companies operating under the FXOpen brand only. It is not to be construed as an offer, solicitation, or recommendation with respect to products and services provided by the Companies operating under the FXOpen brand, nor is it to be considered financial advice.