Sample Category Title
Japan’s Cabinet Office upgrades export assessment amid stable economic outlook
In its latest monthly economic report, Japan Cabinet Office has lifted its assessment on exports for the first time since May. Exports, which previously displayed a "steady undertone," are now characterized as showing "movements of picking up recently."
Other key areas of the economy showed stable and positive trend. Private consumption and business investment are both on an "picking up". Corporate profits have seen moderate improvement. Employment situation shows movements of improvement. Consumer prices are rising.
Looking ahead, the report expects the Japanese economy to sustain its moderate recovery, driven by enhancements in employment and income situations. However, it does underscore potential threats. The slowing pace of foreign economies, especially due to global monetary tightening and uncertainties about China's economic direction, are identified as primary external risks to Japan's growth trajectory.
ECB’s Holzmann advocates further rate hike, views economy as stagnating
ECB Governing Council member Robert Holzmann expressed concerns over the inflationary environment, stating, "We're not yet in the clear when it comes to inflation." He accentuated the need for continued rate increases, suggesting that barring unforeseen circumstances, there could be a compelling case to "push on with rate increases without taking a pause" come September.
Holzmann emphasized the advantages of achieving the peak rate swiftly, noting, "It's better to achieve a peak rate faster, which also means we can eventually start going lower earlier." He highlighted the challenges for markets in navigating a sporadic "stop-and-go rate path."
Furthermore, Holzmann acknowledged that the ECB has been "somewhat behind the curve" in its endeavors to combat inflation. When quizzed on the possibility of continued rate hikes beyond September, he remarked that once rates reach the 4% threshold, the matter would be up for discussion again.
On the topic of Eurozone's economic health, Holzmann offered a measured perspective. While conceding that the economy isn't performing at the anticipated level, he was quick to dismiss fears of an impending recession. He characterized the current economic landscape as one of stagnation, stating, "We're looking at a stagnating economy."
GBP/USD Struggles To Recover, USD/CAD Holds Support
GBP/USD is struggling to recover above 1.2665. USD/CAD is holding gains above 1.3560 and might start another increase.
Important Takeaways for GBP/USD and USD/CAD Analysis Today
- The British Pound started a fresh decline from the 1.2720 resistance zone.
- There is a major bearish trend line forming with resistance near 1.2620 on the hourly chart of GBP/USD at FXOpen.
- USD/CAD is correcting gains from the 1.3640 resistance zone.
- There is a key bullish trend line forming with support near 1.3585 on the hourly chart at FXOpen.
GBP/USD Technical Analysis
On the hourly chart of GBP/USD at FXOpen, the pair started a fresh decline from the 1.2720 zone. The British Pound traded below the 1.2665 support to move into further a bearish zone against the US Dollar, as mentioned in the previous analysis.
The pair even traded below 1.2620 and the 50-hour simple moving average. Finally, the bulls appeared near the 1.2550 level. A low was formed near 1.2547 and the pair is now consolidating losses. There was a minor recovery above the 23.6% Fib retracement level of the downward move from the 1.2732 swing high to the 1.2547 low.
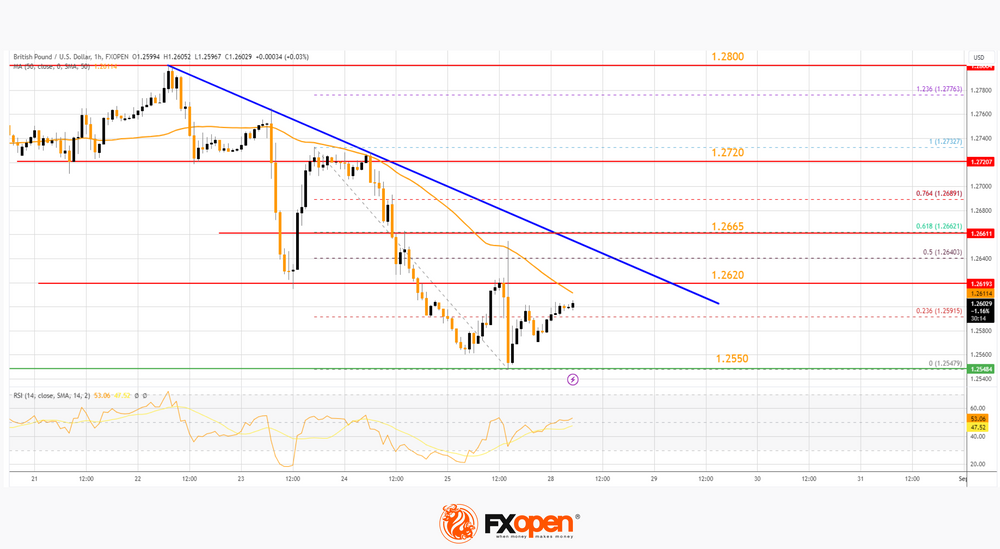
Immediate resistance on the upside is near a major bearish trend line at 1.2620 and the 50-hour simple moving average. The first major resistance on the GBP/USD chart is near the 61.8% Fib retracement level of the downward move from the 1.2732 swing high to the 1.2547 low at 1.2665.
A close above the 1.2665 resistance might spark bullish moves. The next major resistance is near the 1.2720 level. Any more gains could lead the pair toward the 1.2800 resistance in the near term.
Initial support sits near 1.2550. The next major support sits at 1.2510 or 1.2500, below which there is a risk of another sharp decline. In the stated case, the pair could drop toward 1.2420.
USD/CAD Technical Analysis
On the hourly chart of USD/CAD at FXOpen, the pair formed a strong support base above the 1.3510 level. The US Dollar started a fresh increase above the 1.3560 resistance against the Canadian Dollar.
The pair cleared the 50-hour simple moving average to set the tone for a sustained upward move. Finally, the bears appeared near the 1.3640 zone.
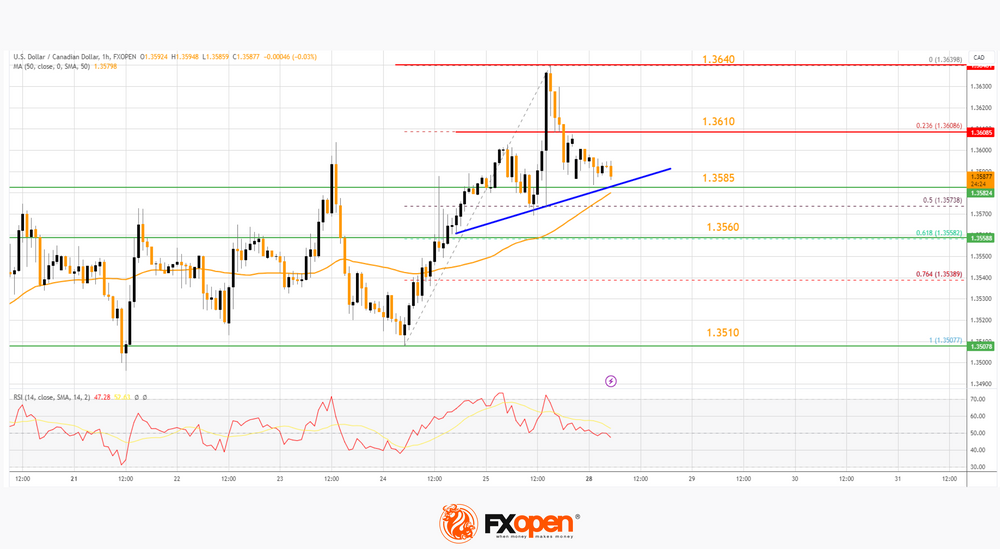
A high was formed near 1.3639 and the pair recently corrected lower. It declined below the 23.6% Fib retracement level of the upward move from the 1.3507 swing low to the 1.3639 high. It is now trading above the 50-hour simple moving average.
There is also a key bullish trend line forming with support near 1.3585. If the pair stays above the trend line, it could start another increase.
Initial resistance sits at 1.3610. A clear upside break above 1.3610 could start another steady increase. The next major resistance is the 1.3640 level. A close above the 1.3640 level might send the pair toward the 1.3720 level. Any more gains could open the doors for a test of the 1.3800 level.
Conversely, the pair could continue to move down. Initial support is near the 1.3585 level and connecting bullish trend line on the same USD/CAD chart. The next major support is near the 61.8% Fib retracement level of the upward move from the 1.3507 swing low to the 1.3639 high at 1.3560.
A downside break below the 1.3560 level could push the pair further lower. The next major support is near the 1.3510 support zone, below which the pair might visit 1.3450.
This article represents the opinion of the Companies operating under the FXOpen brand only. It is not to be construed as an offer, solicitation, or recommendation with respect to products and services provided by the Companies operating under the FXOpen brand, nor is it to be considered financial advice.
AUD/USD and NZD/USD Signal Downside Continuation
AUD/USD declined below the 0.6450 and 0.6430 support levels. NZD/USD is also moving lower and might trade below the 0.5900 zone.
Important Takeaways for AUD/USD and NZD/USD Analysis Today
- The Aussie Dollar started a fresh decline from well above the 0.6480 level against the US Dollar.
- There was a break below a key bullish trend line with support near 0.6430 on the hourly chart of AUD/USD at FXOpen.
- NZD/USD declined heavily from the 0.5985 resistance zone.
- There was a break below a major bullish trend line with support near 0.5945 on the hourly chart of NZD/USD at FXOpen.
AUD/USD Technical Analysis
On the hourly chart of AUD/USD at FXOpen, the pair struggled to clear the 0.6500 zone. The Aussie Dollar started a fresh decline below the 0.6450 support against the US Dollar.
There was a break below a key bullish trend line with support near 0.6430. The pair even settled below 0.6430 and the 50-hour simple moving average. The pair is now showing bearish signs and trading near the last swing low at 0.6410.
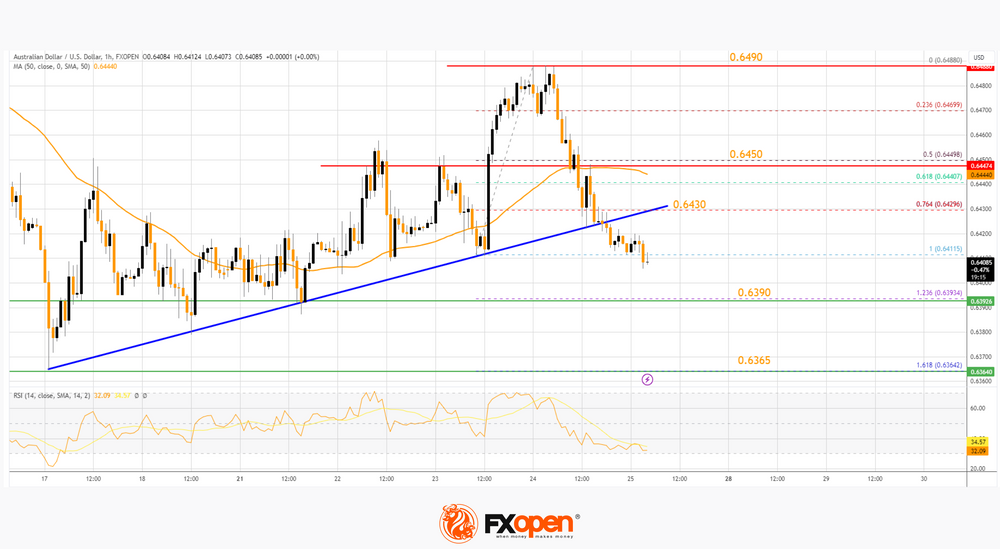
On the downside, initial support is near the 1.236 Fib extension level of the upward move from the 0.6411 swing low to the 0.6490 high at 0.6390. If there is a downside break below 0.6390, the pair could extend its decline.
The next support could be the 1.618 Fib extension level of the upward move from the 0.6411 swing low to the 0.6490 high at 0.6365. Any more losses might send the pair toward the 0.6320 support.
On the upside, an immediate resistance is near 0.6430. The next major resistance is near the 50-hour simple moving average at 0.6450, above which the price could rise toward 0.6490. Any more gains might send the pair toward 0.6550.
A close above the 0.6550 level could start another steady increase in the near term. The next major resistance on the AUD/USD chart could be 0.6620.
NZD/USD Technical Analysis
On the hourly chart of NZD/USD on FXOpen, the pair also followed a similar pattern and declined from the 0.5985 zone. The New Zealand Dollar gained bearish momentum and traded below 0.5950 against the US Dollar.
There was a break below a major bullish trend line with support near 0.5945 and the 50-hour simple moving average. The pair settled below the 61.8% Fib retracement level of the upward move from the 0.5896 swing low to the 0.5985 high.
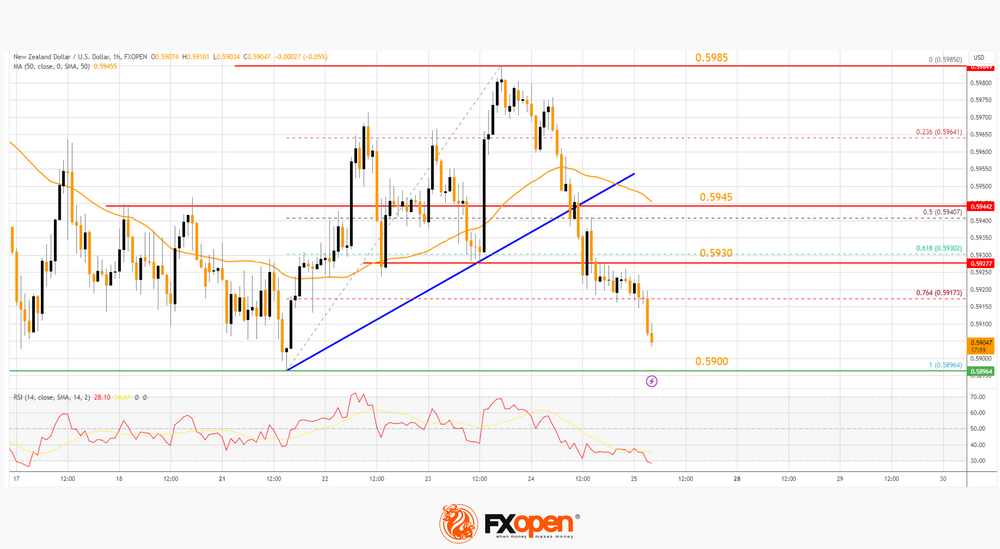
The current price action suggests a high chance of more losses below the 76.4% Fib retracement level of the upward move from the 0.5896 swing low to the 0.5985 high.
On the downside, immediate support on the NZD/USD chart is near the 0.5900 level. The next major support is near the 0.5865 zone. If there is a downside break below 0.5865, the pair could extend its decline toward the 0.5840 level. The next key support is near 0.5800.
Immediate resistance on the upside is near 0.5930. If there is a move above 0.5930, the pair could rise toward the 50-hour simple moving average at 0.5945. Any more gains might open the doors for a move toward the 0.5985 resistance zone in the coming days.
This article represents the opinion of the Companies operating under the FXOpen brand only. It is not to be construed as an offer, solicitation, or recommendation with respect to products and services provided by the Companies operating under the FXOpen brand, nor is it to be considered financial advice.
EUR/USD: Limited Correction to Precede Fresh Weakness
The Euro was slightly higher on Monday morning, underpinned by fresh risk appetite but gains were so far limited.
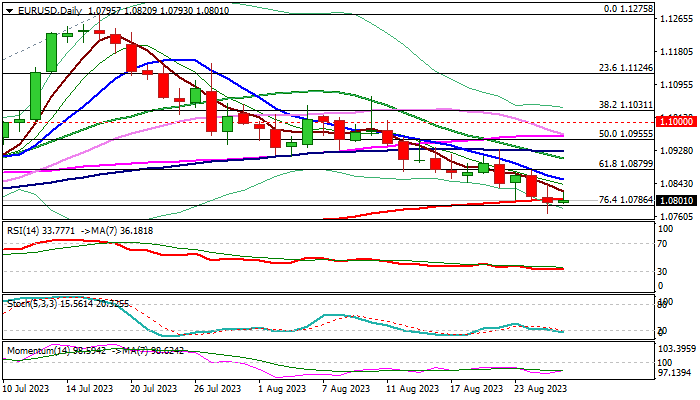
Steady downtrend in past six weeks may take a breather for a partial profit-taking as studies are oversold, though prevailing tone is still bearish and helped by downbeat recent EU economic data and hawkish Fed.
Friday’s failure to close below pivotal supports at 1.0802/1.0786 (200DMA / Fibo 76.4% of 1.0635/1.1275) and daily Doji candle, could be seen as initial signal that larger bears are running out of steam.
However, such scenario requires more action to be verified, with initial signal expected on close above 10DMA (1.0853) and broken Fibo 61.8% (1.0879) and lift above 100DMA (1.0926) to generate reversal signal.
Otherwise, limited upticks are likely to provide better selling opportunities for renewed attack at 1.0802/1.0786 pivots, clear break of which would reinforce bearish stance and risk acceleration towards 1.0700 (psychological) and 1.0635 (May 31 low).
Res: 1.0841; 1.0853; 1.0879; 1.0908.
Sup: 1.0786; 1.0766; 1.0700; 1.0667.
Dollar Index: Bulls May Pause for Shallow Consolidation Before Attacking Key Resistances
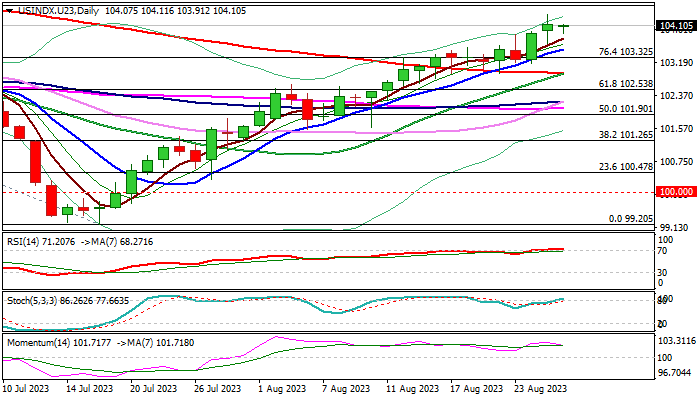
The dollar index eased from new highest in almost three months in early Monday, as traders collected some profits and fresh risk appetite also weighed on dollar.
The Fed Chair Powell’s speech in Jackson Hole symposium was mainly in line with expectations, signaling that the US central bank keeps overall hawkish stance on interest rates.
In his remarks, Powell signaled that the Fed left the door open for possible further rate hikes, as inflation is still high, although with significant progress in easing price pressures, while the economy remains surprisingly strong despite high borrowing cost.
However, Powell said that the next steps of the central bank will be data dependent and economic conditions will strongly influence future decisions whether to raise interest rates or to hold the policy unchanged.
Markets widely expect the Fed to stay on hold in September, with rising bets for another 25 basis points hike in November’s policy meeting.
The fact that the central bank is likely to keep rates elevated for longer, with further increases not ruled out, is positive for greenback, which advanced for six straight weeks since mid-July.
The price came close to key resistances at 104.59/74 (May 31 peak / 55WMA), where larger bulls are expected to take a breather and consolidate.
Overbought daily studies contribute to such scenario, with limited dips to be ideally contained by rising 10DMA / broken Fibo 76.4% at 103.51/32 zone and keep larger bulls intact.
Only acceleration through 200DMA (102.92) would weaken near-term structure and risk deeper pullback.
Traders shift their focus on a series of important US economic data due this week, with releases of Q2 GDP, core PCE, consumer spending and labor report, to give further details about the situation in the US economy.
Res: 104.37; 104.59; 104.74; 105.40.
Sup: 103.91; 103.51; 103.32; 102.92.
Crypto Market Holds Positions But Still Looks Down
Market Picture
Despite a mid-week spike in volatility, the cryptocurrency market remained virtually unchanged from the previous week’s capitalisation level, hovering around $1.050 trillion (-1% in 7 days). Bitcoin’s decline was a negligible 0.7%, while altcoins suffered losses of around 2%.
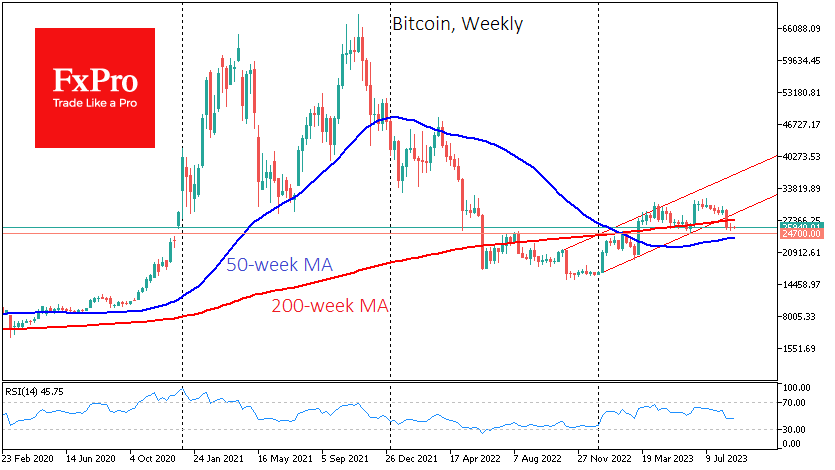
The technical picture for Bitcoin remains bearish on weekly timeframes, as the price is below its 200-week average and outside of its ascending channel. The most likely short-term outlook is for a decline to the $23.9-24.6K region, with the lower boundary being the 50-week average and the upper one being the pivot area from last August.
According to Santiment, large investors continue to accumulate positions. The number of wallets with balances between 10 and 10,000 BTC totalled 156,600, and these accounts have accumulated $308.6 million since the 17th of August.
News Background
Bitcoin and other cryptocurrencies could fall in the short term, although the decline will be limited, JPMorgan warned. The bank said the liquidation of long positions is nearing completion rather than being in its early stages.
Tether has updated its report on the state of reserves providing liquidity to the USDT. The data shows assets exceed $86.1 billion, and liabilities exceed $82.8 billion.
Mastercard and Visa refuse to issue cryptocurrency payment cards for Binance amid the exchange’s regulatory troubles. In March, the CFTC filed a civil lawsuit against Binance. In June, the SEC filed 13 charges against the exchange.
GBP/JPY Daily Outlook
Daily Pivots: (S1) 183.55; (P) 183.98; (R1) 184.60; More...
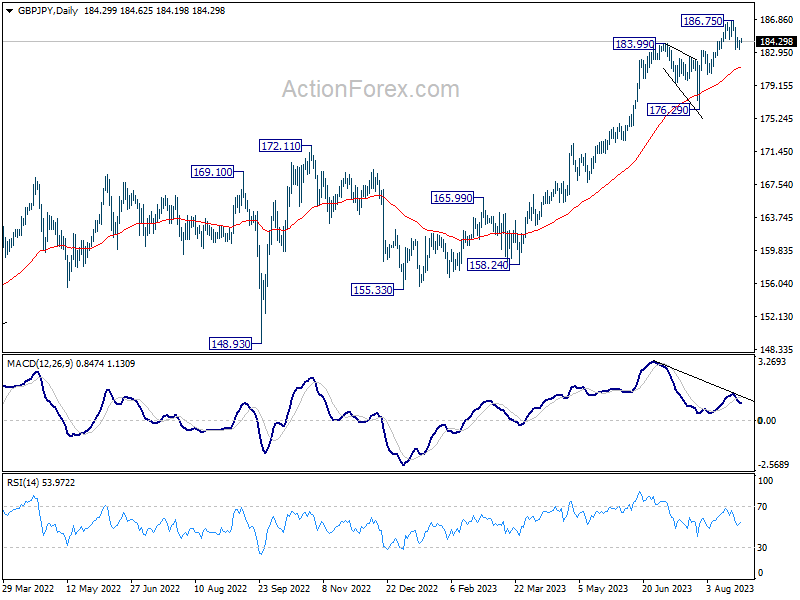
Intraday bias in GBP/JPY remains neutral for the moment. Risk will stays on the downside as long as 186.75 resistance holds. Break of 183.35 will resume the correction from 186.75 short term top to 55 D EMA (now at 181.17) and possibly below.
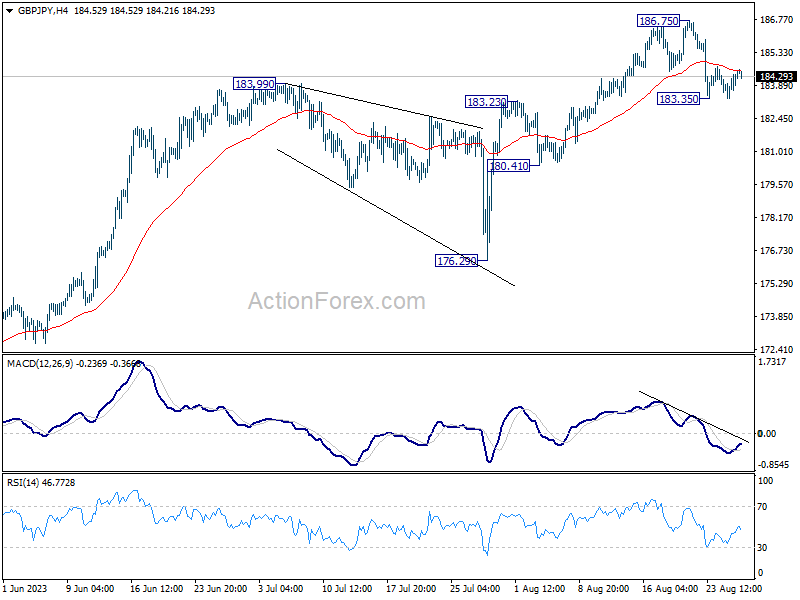
In the bigger picture, up trend from 123.94 (2020 low) is in progress. Next target is 195.86 (2015 high). This will remain the favored case as long as 176.29 support holds, even in case of deeper pull back.
EUR/JPY Daily Outlook
Daily Pivots: (S1) 157.45; (P) 157.85; (R1) 158.47; More....
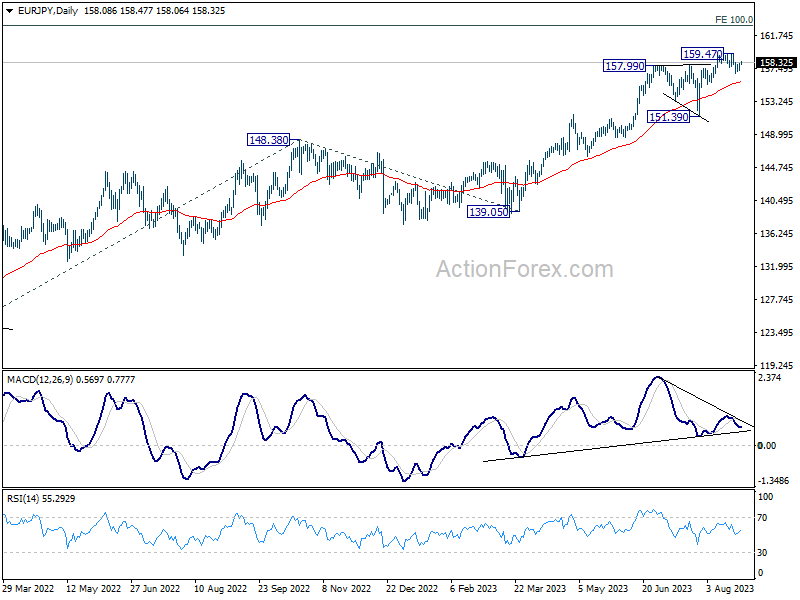
Intraday bias in EUR/JPY remains neutral at this point. Risk will stay mildly on the downside as long as 159.47 short term top holds. Break of 156.85 will resume the corrective fall to 55 D EMA (now at 155.87) and possibly below.
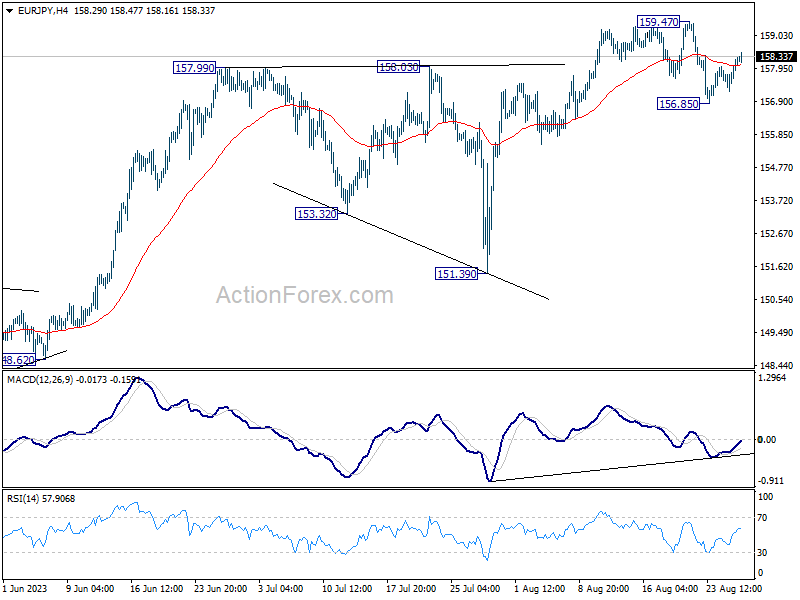
In the bigger picture, rise from 114.42 (2020 low) is in progress. Next target is 100% projection of 124.37 to 148.38 from 139.05 at 163.06. Sustained break there will pave the way to retest long term resistance at 169.96. This will remain the favored case as long as 151.39 support holds, even in case of deep pull back.
EUR/GBP Daily Outlook
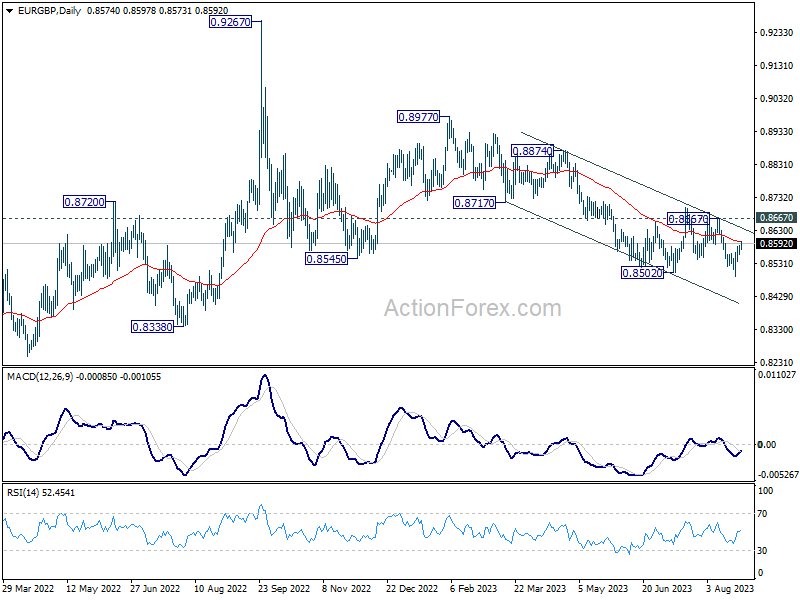
Daily Pivots: (S1) 0.8567; (P) 0.8576; (R1) 0.8592; More...
Intraday bias in EUR/GBP remains mildly on the upside as rebound from 0.8491 is extending higher today. Still, overall outlook will stay bearish as long as 0.8667 resistance holds. That is, larger down trend from 0.8977 is in favor to continue. Below 0.8559 minor support will bring retest of 0.8491 low first.
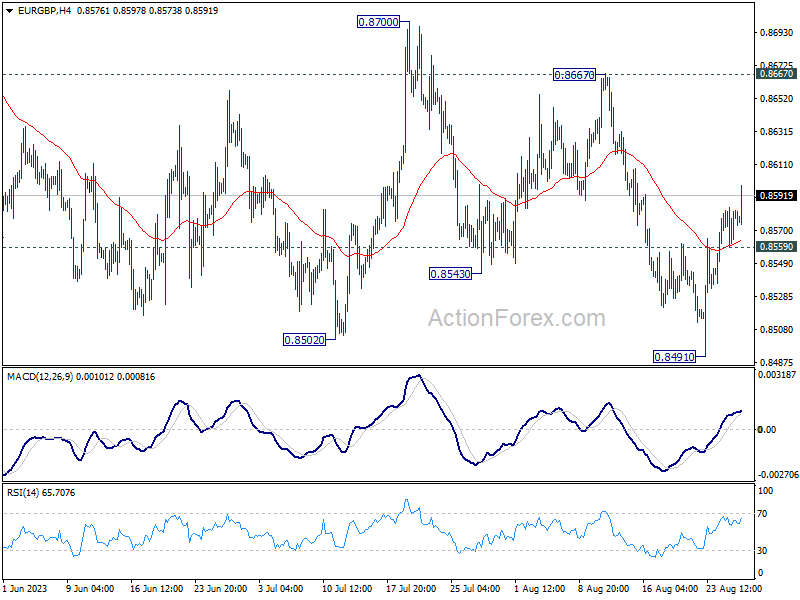
In the bigger picture, the down trend from 0.9267 (2022 high) is seen as part of the long term range pattern from 0.9499 (2020 high). Further decline is in favor as long as 0.8667 resistance holds. Break of 0.8502 will resume the fall towards 0.8201 (2022 low).