Sample Category Title
EUR/JPY Daily Outlook
Daily Pivots: (S1) 157.17; (P) 157.61; (R1) 158.11; More....
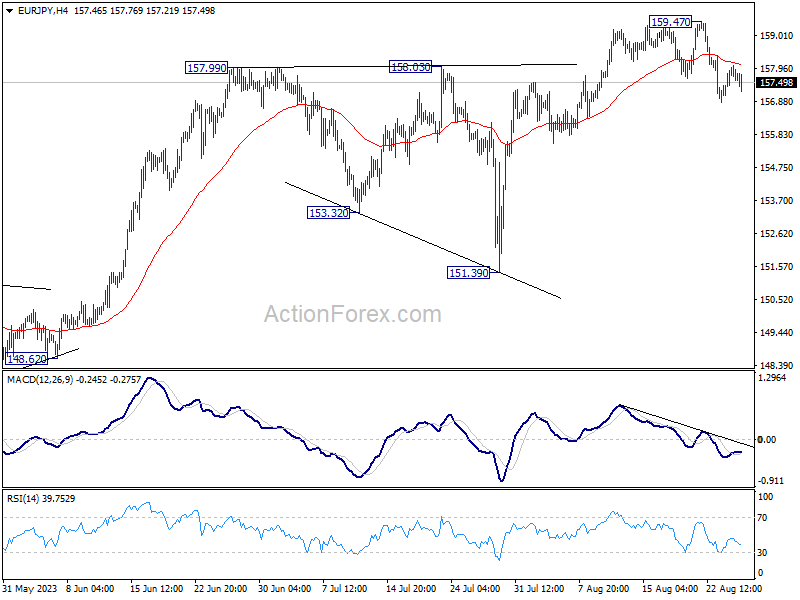
Intraday bias in EUR/JPY stays mildly on the downside at this point. Current decline from 159.47 short term top should extend to (now at 155.76) first. For now, risk will stay mildly on the downside as long as 159.47 holds, in case of recovery.
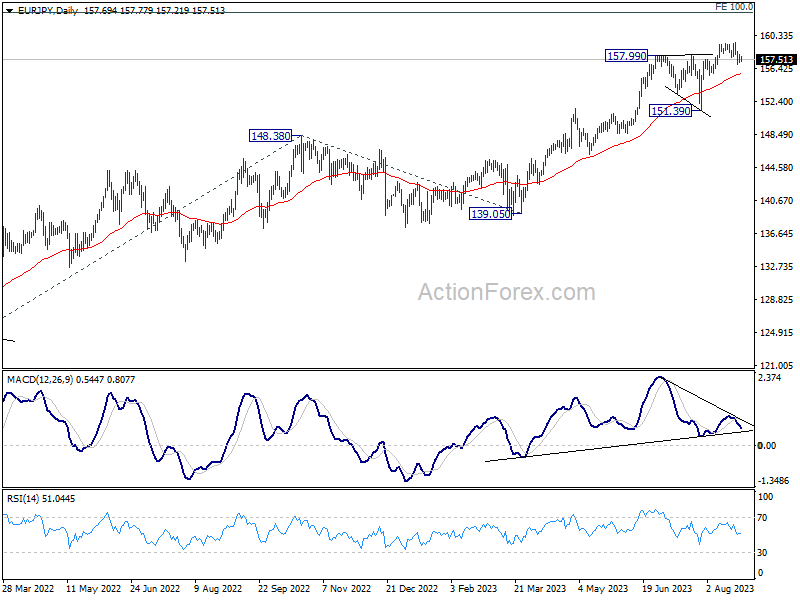
In the bigger picture, rise from 114.42 (2020 low) is in progress. Next target is 100% projection of 124.37 to 148.38 from 139.05 at 163.06. Sustained break there will pave the way to retest long term resistance at 169.96. This will now remain the favored case as long as 151.39 support holds, even in case of deep pull back.
EUR/GBP Daily Outlook
Daily Pivots: (S1) 0.8551; (P) 0.8567; (R1) 0.8595; More...
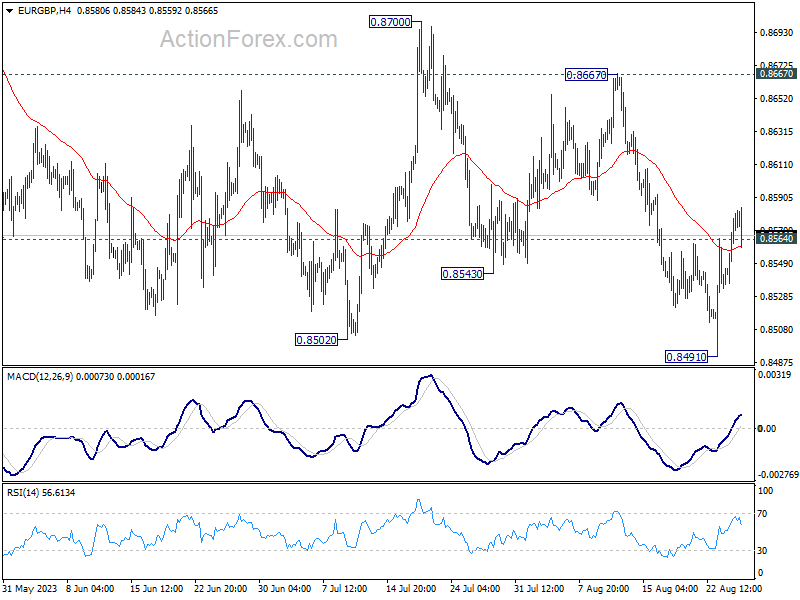
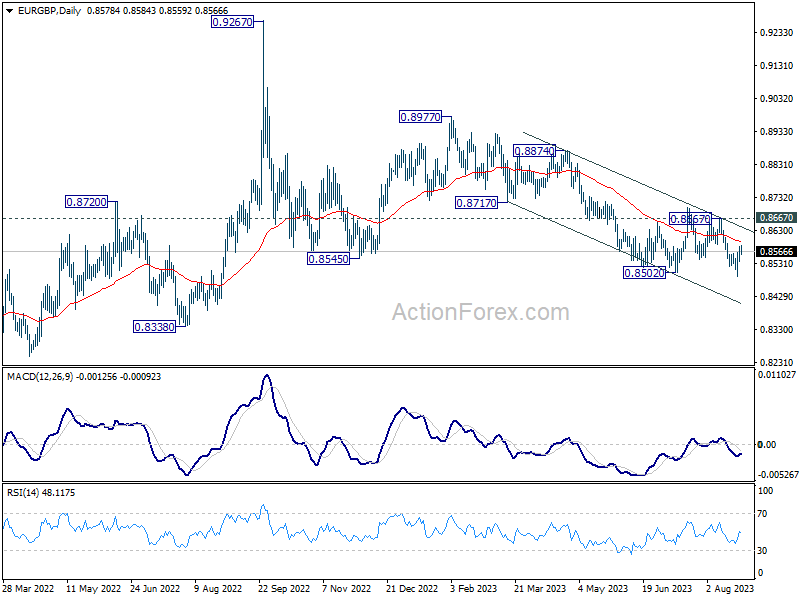
Intraday bias in EUR/GBP is now mildly on the upside with break of 0.8564 minor resistance. Stronger rebound could be seen but near term outlook will stay bearish as long as 0.8667 resistance holds. Break of 0.8419 support will resume larger fall from 0.8977.
In the bigger picture, the down trend from 0.9267 (2022 high) is seen as part of the long term range pattern from 0.9499 (2020 high). Further decline is in favor as long as 0.8667 resistance holds. Break of 0.8502 will resume the fall towards 0.8201 (2022 low).
EUR/AUD Daily Outlook
Daily Pivots: (S1) 1.6782; (P) 1.6819; (R1) 1.6882; More...
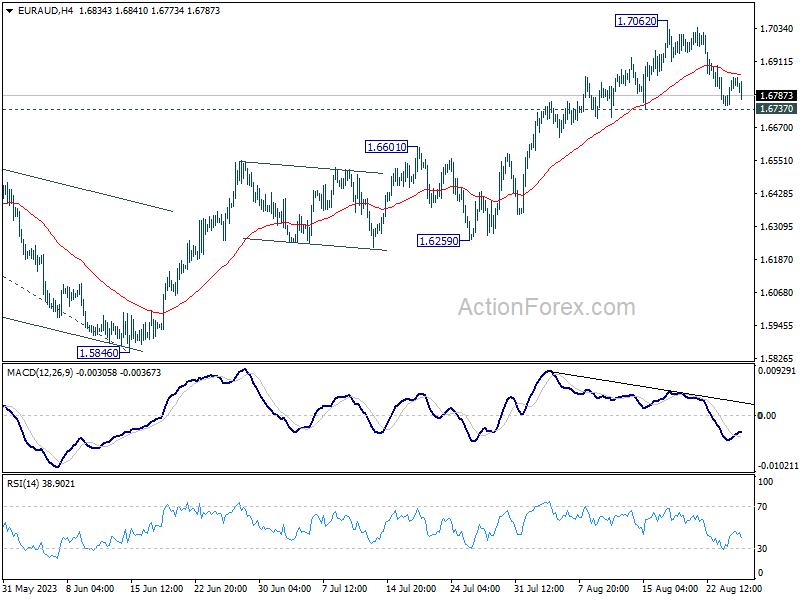
Intraday bias in EUR/AUD stays neutral at this point. Outlook also stays bullish with 1.6737 support intact. Break of 1.7062 will resume larger rise from 1.481 to 1.7377 projection level next. However, firm break of 1.6737 will bring deeper pull back to 1.6601 resistance turned support instead.
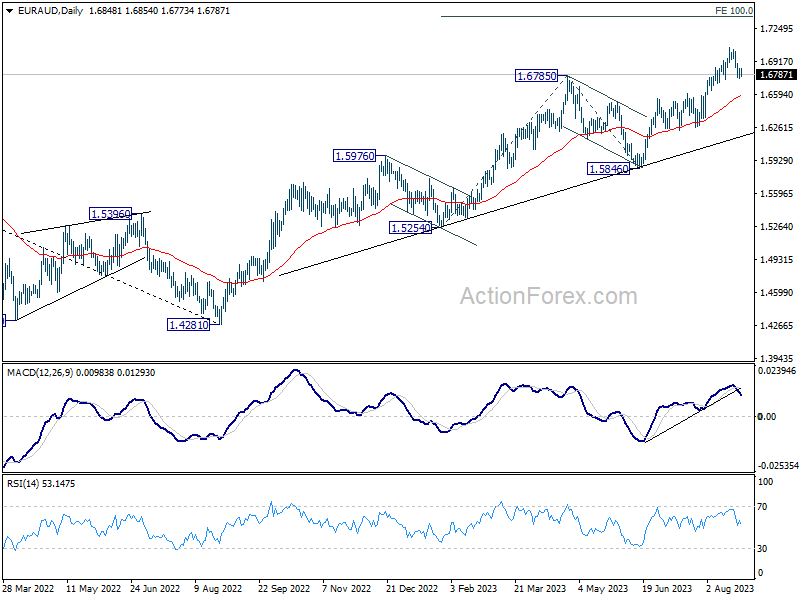
In the bigger picture, the rise from 1.4281 (2022 low) is in progress. Next target is 100% projection of 1.5254 to 1.6785 from 1.5846 at 1.7377. For now, outlook will stay bullish as long as 1.5846 support holds, even in case of another pull back.
EUR/CHF Daily Outlook
Daily Pivots: (S1) 0.9534; (P) 0.9550; (R1) 0.9578; More...
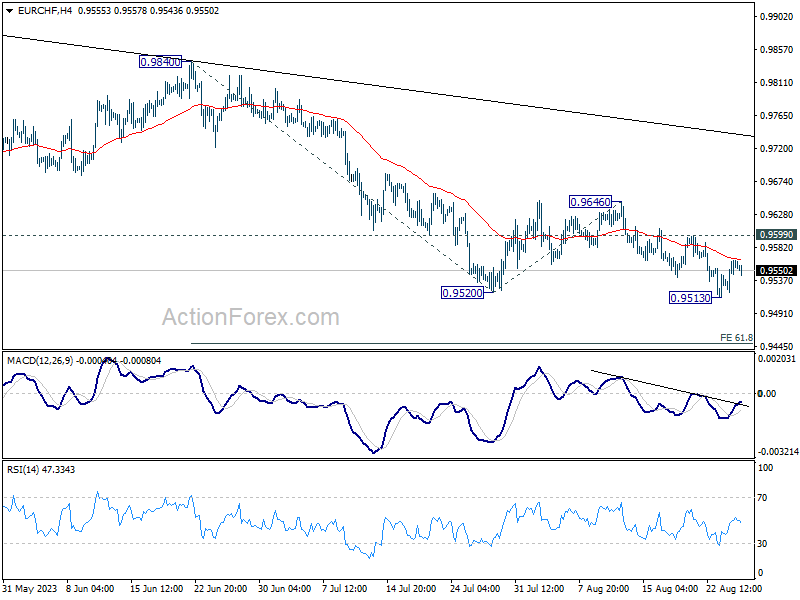
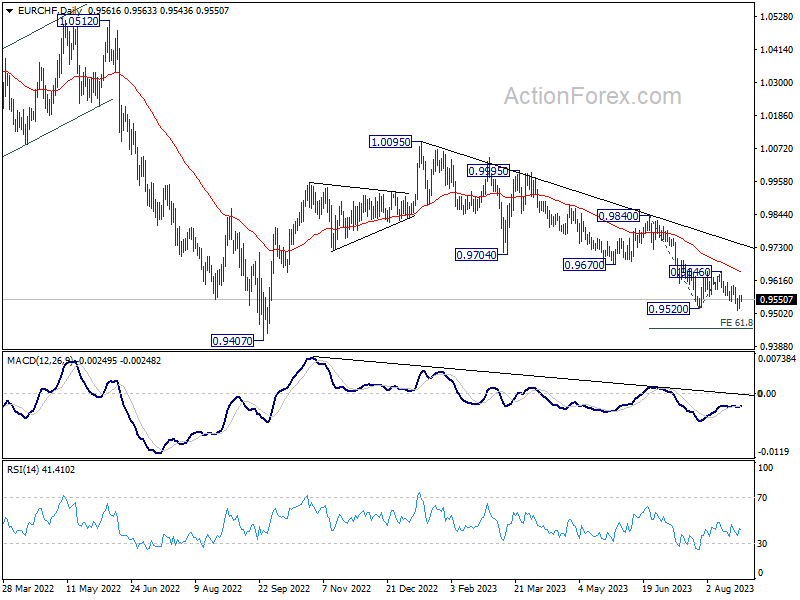
Intraday bias in EUR/CHF is turned neutral with current recovery. But further decline is expected as long as 0.9599 resistance holds. Break of 0.9513 will resume the whole fall from 1.0095 to 61.8% projection of 0.9840 to 0.9520 from 0.9646 at 0.9448.
In the bigger picture, medium term outlook is staying bearish as the pair is capped well below falling 55 W EMA (now at 0.9849). Down trend from 1.2004 (2018 high) is in favor to continue. Sustained break of 0.9407 will target 61.8% projection of 1.1149 to 0.9407 from 1.0095 at 0.9018. For now, this will remain the favored case as long as 0.9670 support turned resistance holds, in case of strong rebound.
USDCAD in a Sustained Rally, Eyeing April Highs
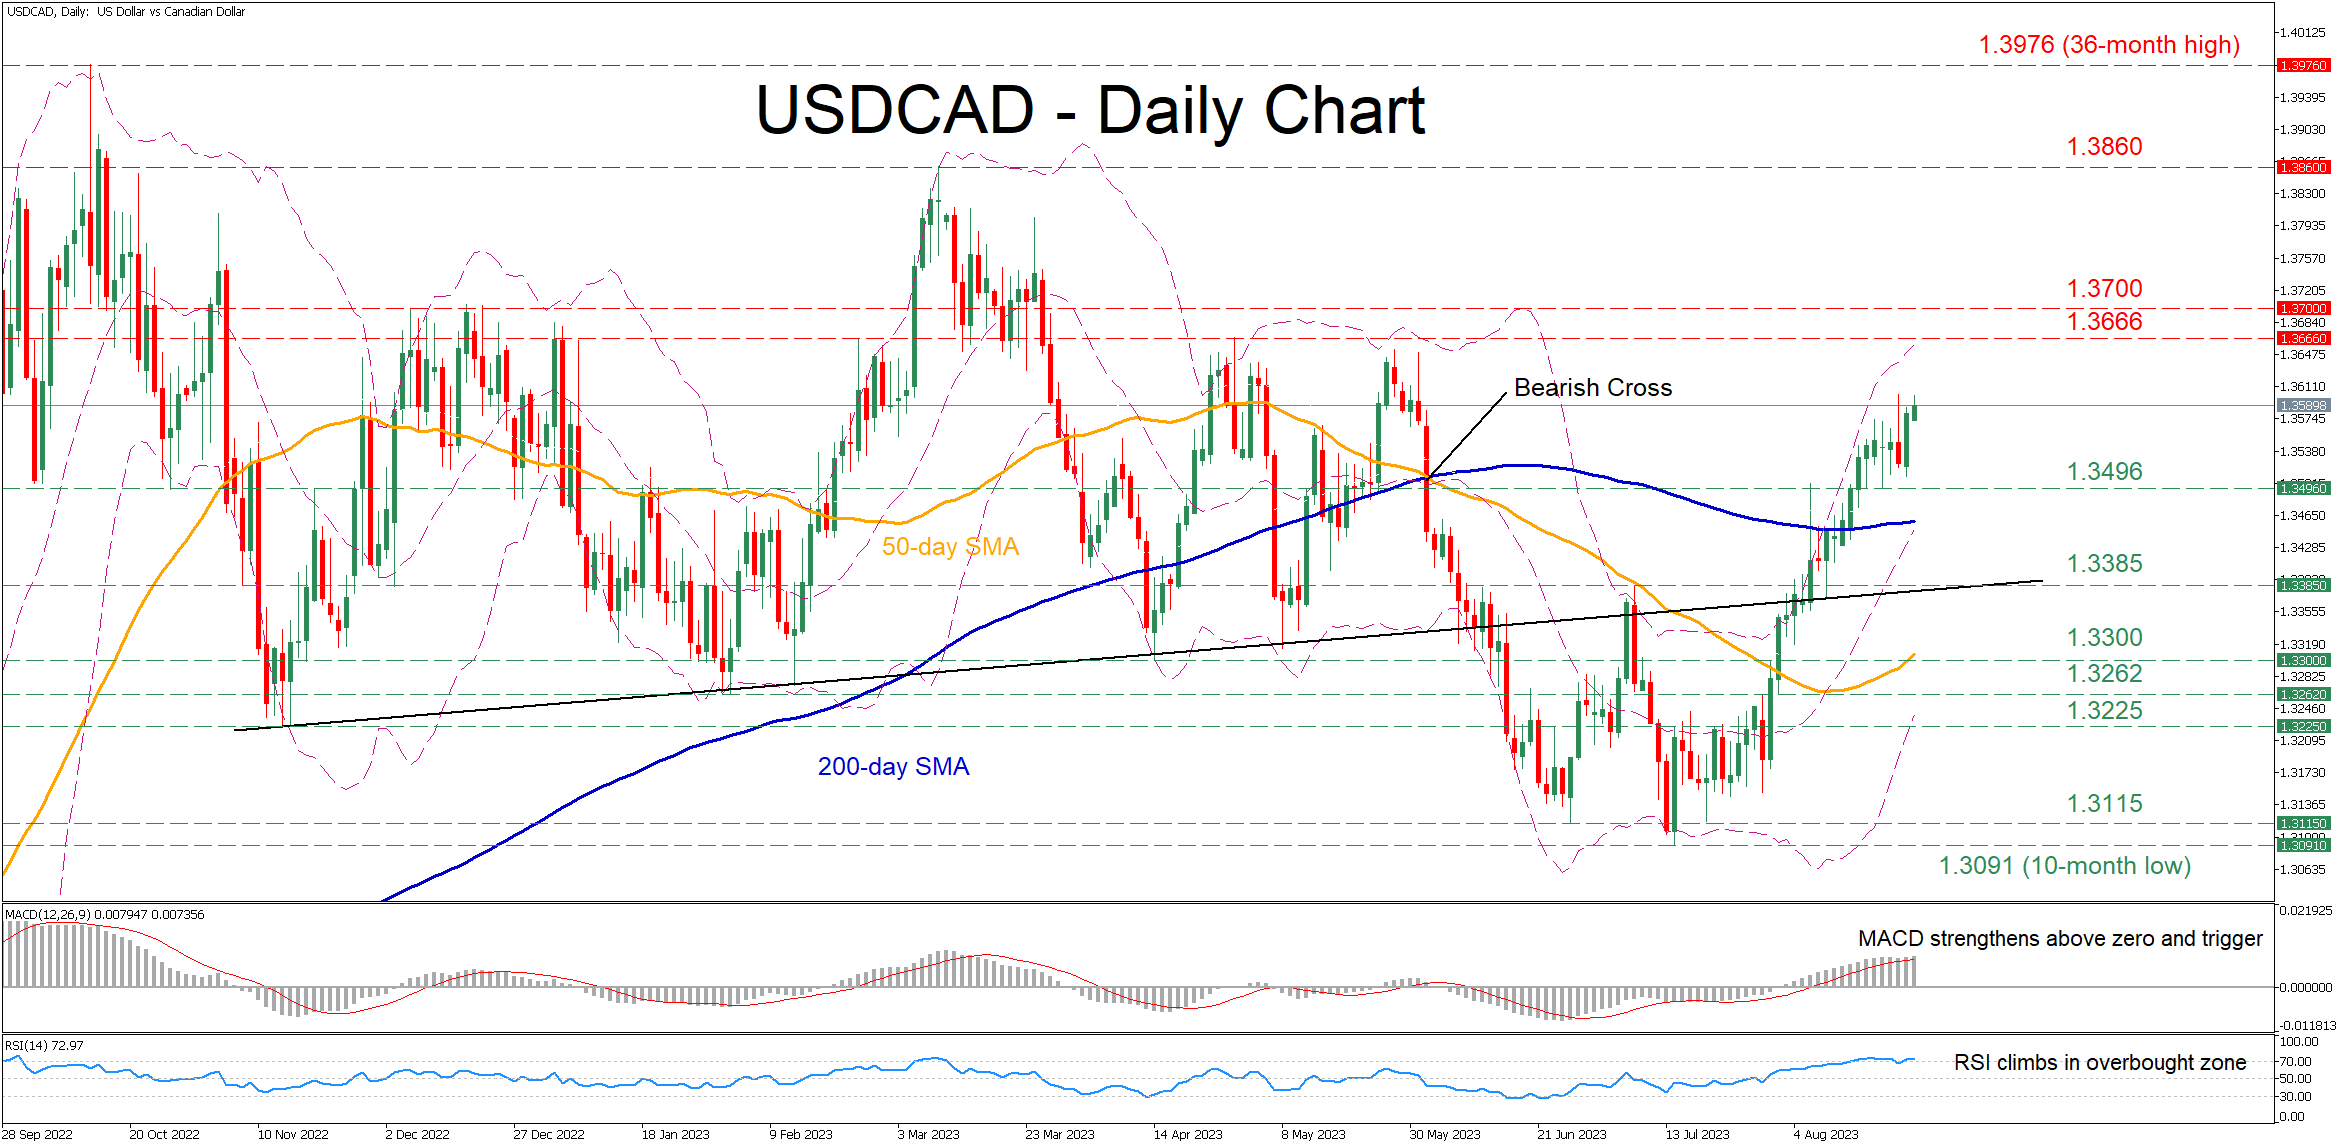
USDCAD had been stuck in a steep uptrend after finding its feet at the 10-month low of 1.3091 in mid-July. Moreover, the pair has sliced through important technical zones such as both the 50- and 200-day simple moving averages (SMAs), while posting consecutive fresh two-month highs in the last few daily sessions.
The momentum indicators currently suggest that the recent rally could be overstretched. Specifically, the MACD is strengthening above zero and its red signal line at its highest level since March, while the RSI is hovering within its 70-overbought territory.
Should the bulls attempt to push the price higher, immediate resistance could be found at the April peak of 1.3666. Breaking above that region, the pair might ascend towards the 1.3700 psychological mark, which held strong in December 2022. Further advances could then cease at the 2023 high of 1.3860 registered in March.
Alternatively, if the recent rally fizzles out, the price may retrace lower to test the recent support of 1.3496. A violation of that territory could open the door for the May resistance of 1.3385, which could now serve as support. Failing to halt there, the pair could extend its retreat towards the April bottom of 1.3300 ahead of the February low of 1.3262.
In brief, USDCAD has been staging a strong recovery, which accelerated after the pair pierced through the ascending trendline that connects its higher lows from November 2022 until early May. However, traders should not rule out a correction as the price has approached overbought conditions.
EURJPY Correcting in 7 Swing Within Bullish Trend
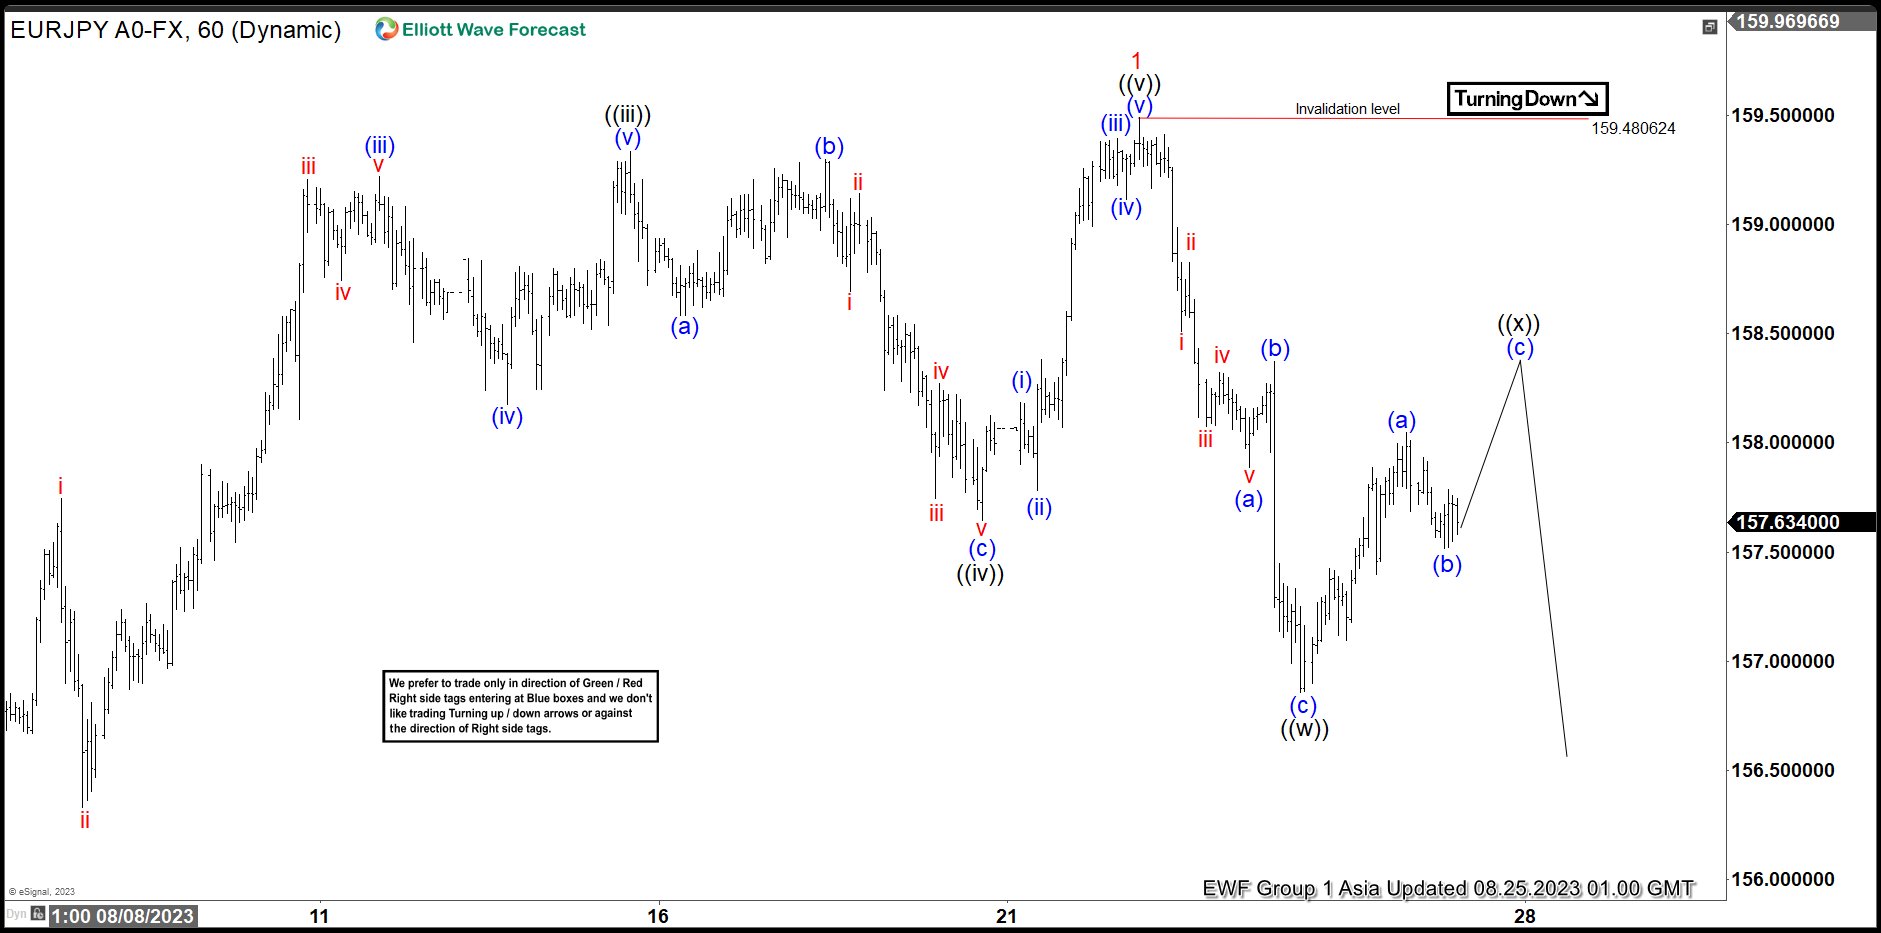
Short Term Elliott Wave view suggests cycle from 7.28.2023 low ended with wave 1 at 159.4 in 5 waves impulse. Up from 7.28.2023 low, wave ((i)) ended at 157.49 and pullback in wave ((ii)) ended at 155.53. Pair extends higher in wave ((iii)) towards 159.33 and pullback in wave ((iv)) ended at 157.66. Subdivision of wave ((iv)) unfolded as a zigzag Elliott Wave structure. Down from wave ((iii)), wave (a) ended at 158.58, and wave (b) ended at 159.29. Pair resumes lower in wave (c) towards 157.64 which completed wave ((iv)) in higher degree. Pair then resumed higher in wave ((v)) towards 159.48 which completed wave 1 in higher degree.
Wave 2 pullback is currently in progress as a 7 swing double three structure. Down from wave 1, wave (a) ended at 157.88 and wave (b) ended at 158.37. Pair resumed lower in wave (c) towards 156.85 which completed wave ((w)). Wave ((x)) rally is now in progress in 3 waves zigzag. Up from wave ((w)), wave (a) ended at 158.04. Near term, while below 159.48, expect the rally to fail in 3, 7, or 11 swing and pair to resume lower.
EURJPY 60 Minutes Elliott Wave Chart
EURJPY Elliott Wave Video
https://www.youtube.com/watch?v=U0P9xikm8h8
USD/CAD Daily Outlook
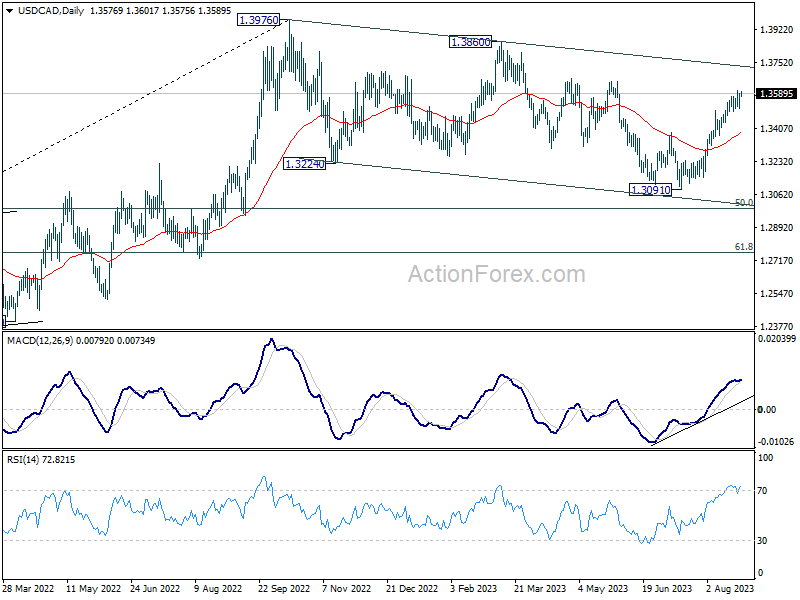
Daily Pivots: (S1) 1.3532; (P) 1.3561; (R1) 1.3611; More....
USD/CAD is staying in range below 1.3602 and intraday bias remains neutral. On the upside, break of 1.3602 will resume the whole rally from 1.3091 to 1.3653 resistance first. Decisive break there will confirm that correction from 1.3976 has completed, a target a test on this high. However, break of 1.3495 will indicate short term topping, on bearish divergence condition in 4H MACD, and turn bias to the downside for deeper pull back.
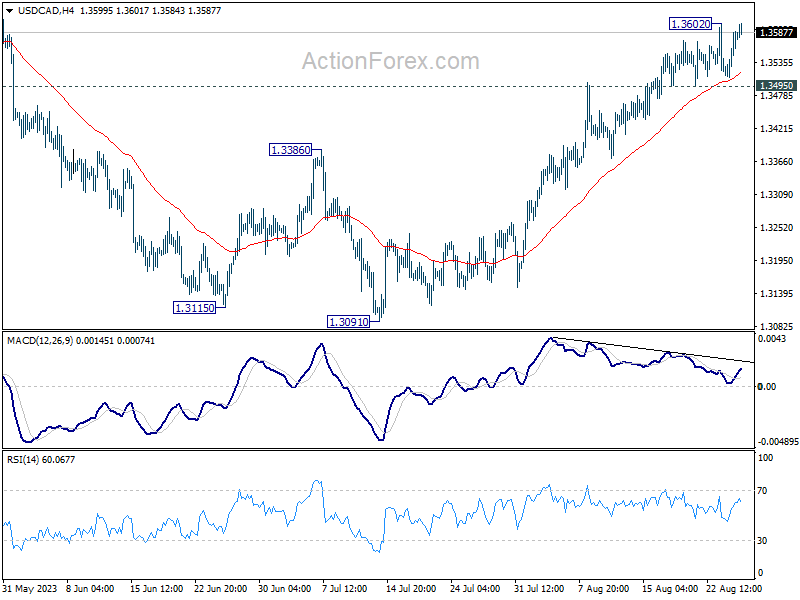
In the bigger picture, price actions from 1.3976 are viewed as a corrective fall only. Upon completion, rise from 1.2005 (2021 low) would resume through 1.3976. Next target is 61.8% projection of 1.2005 to 1.3976 from 1.3091 at 1.4309. In case of another fall, downside should be contained by 61.8% retracement of 1.2005 to 1.3976 at 1.2758.
AUD/USD Daily Report
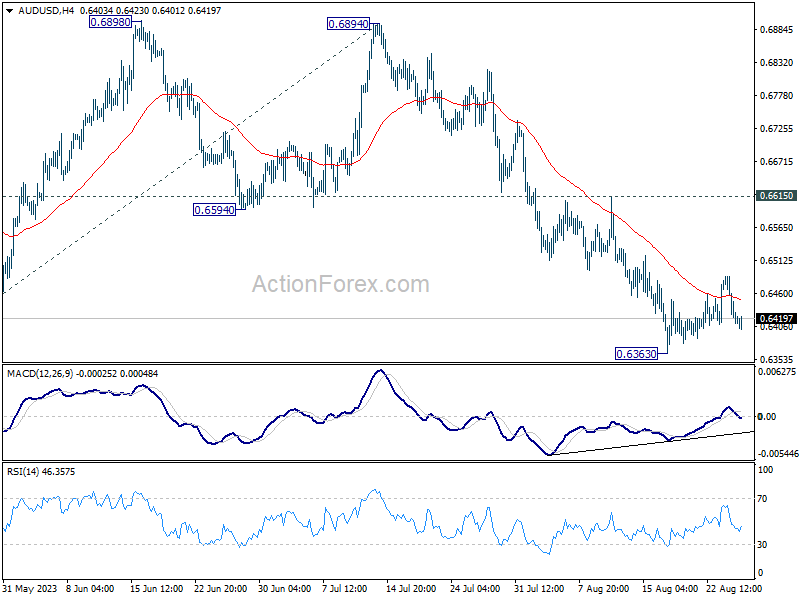
Daily Pivots: (S1) 0.6391; (P) 0.6439; (R1) 0.6467; More...
Intraday bias in AUD/USD stays neutral as consolidation from 0.6363 could extend. While stronger recovery cannot be ruled out, upside should be limited by 0.6615 resistance. Break of 0.6363 will resume larger fall from 0.7156 to 100% projection of 0.7156 to 0.6457 from 0.6894 at 0.6195.
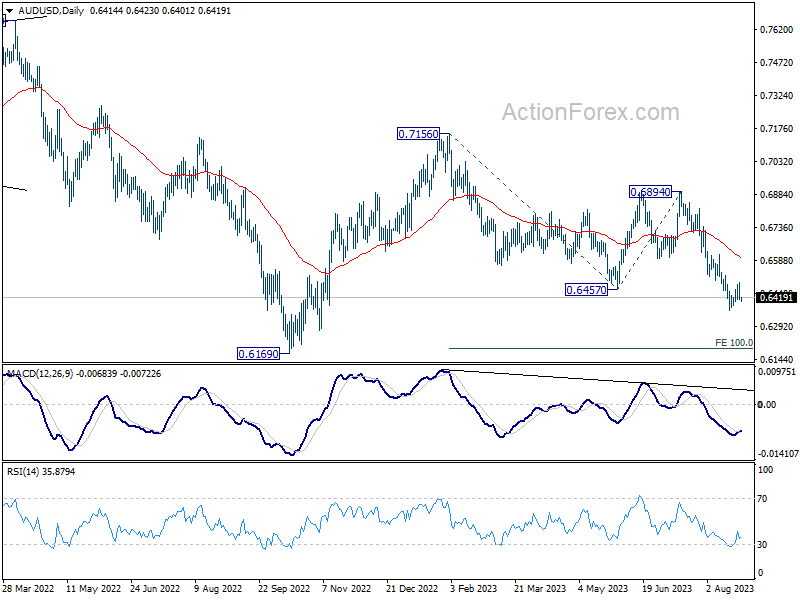
In the bigger picture, current development argues that the down trend from 0.8006 (2021 high) is still in progress. Decisive break of 0.6169 will target 61.8% projection of 0.8006 to 0.6169 to 0.7156 at 0.6021. This will now remain the favored case as long as 0.6894, in case of strong rebound.
USD/JPY Daily Outlook
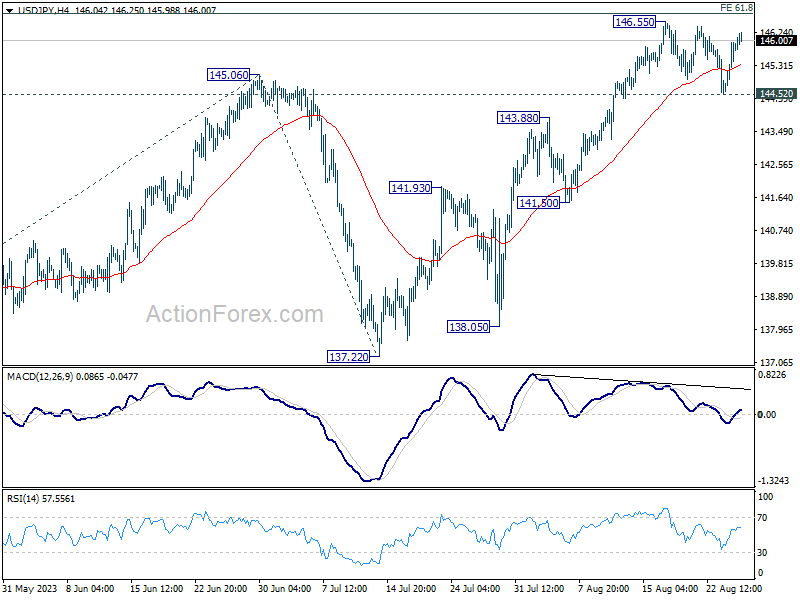
Daily Pivots: (S1) 144.98; (P) 145.47; (R1) 146.34; More...
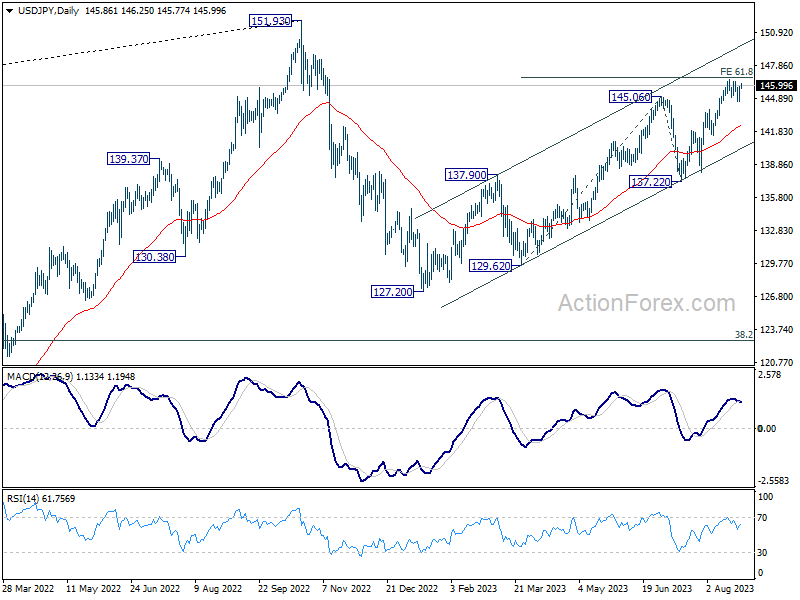
Intraday bias in USD/JPY stays neutral as it's still bounded in range. On the upside, sustained break of 61.8% projection of 129.62 to 145.06 from 137.22 at 146.76 will pave the way to retest 151.93 high. However, considering bearish divergence condition in 4H MACD, firm break of 144.52 support will be a sign of reversal, and turn bias back to the downside for 55 D EMA (now at 142.45).
In the bigger picture, overall price actions from 151.93 (2022 high) are views as a corrective pattern. Rise from 127.20 is seen as the second leg of the pattern and could still be in progress. But even in case of extended rise, strong resistance should be seen from 151.93 to limit upside. Meanwhile, break of 137.22 support should confirm the start of the third leg to 127.20 (2023 low) and below.
USD/CHF Daily Outlook
Daily Pivots: (S1) 0.8786; (P) 0.8819; (R1) 0.8878; More....
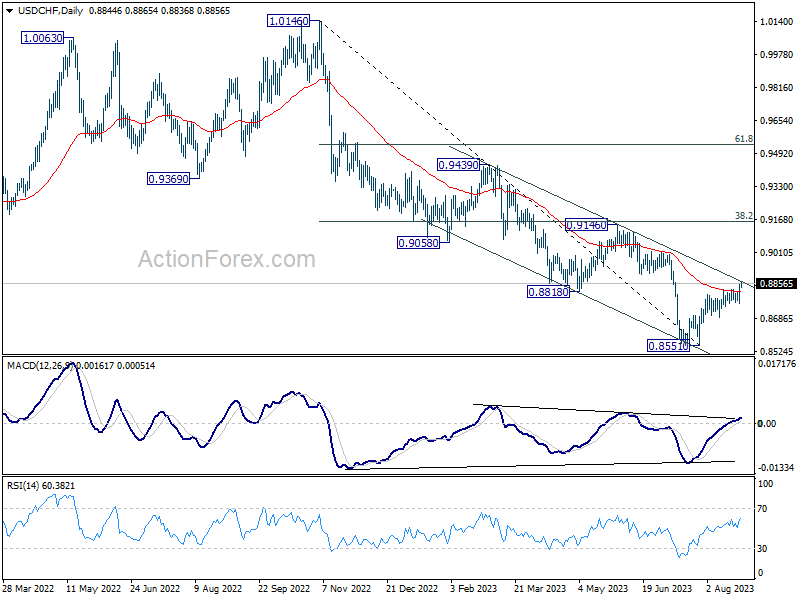
Intraday bias in USD/CHF remains on the upside at this point. Further rally should be seen to 0.9146 cluster resistance next. Strong resistance could be seen there to limit upside, at least on first attempt. On the downside, break of 0.8758 support is needed to indicate completion of the rebound from 0.8551. Otherwise, near term outlook is cautiously bullish in case of retreat.
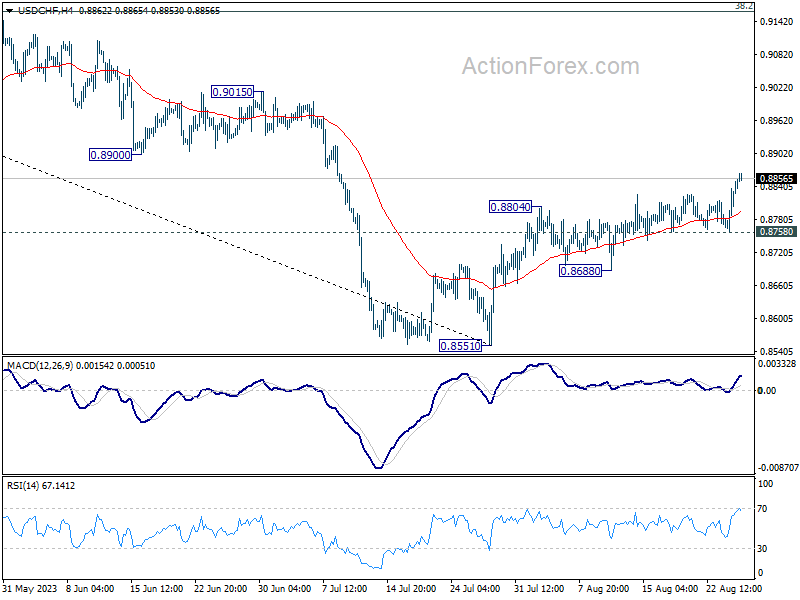
In the bigger picture, rebound from 0.8551 medium term bottom is currently seen as a correction to the downtrend from 1.0146 (2022 high). Further rally would be seen to 0.9146 cluster resistance (38.2% retracement of 1.0146 to 0.8551 at 0.9160), even as a correction. For now, medium term outlook is neutral at best as long as 0.8551 holds, until further developments.