Sample Category Title
Technical Outlook and Review
DXY:
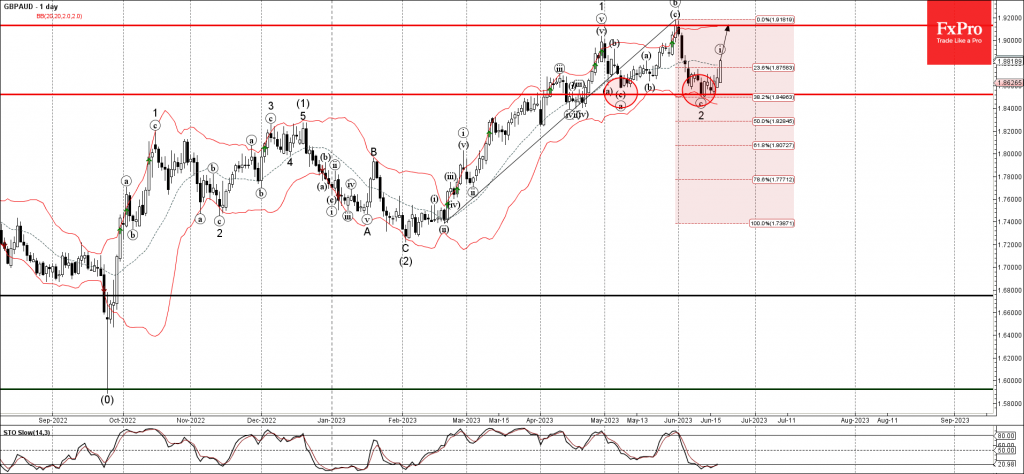
The DXY chart indicates a bearish momentum with the potential for a bearish continuation towards the first support at 102.10, which is a multi-swing low support, and the second support at 101.69, serving as an overlap support and aligning with the 145.00% Fibonacci Extension.
On the upside, the first resistance at 102.70 represents an overlap resistance, coinciding with the 38.20% and 50% Fibonacci Retracement levels, while the second resistance at 1980.08 is also an overlap resistance, aligning with the 78.60% Fibonacci Retracement.
EUR/USD:
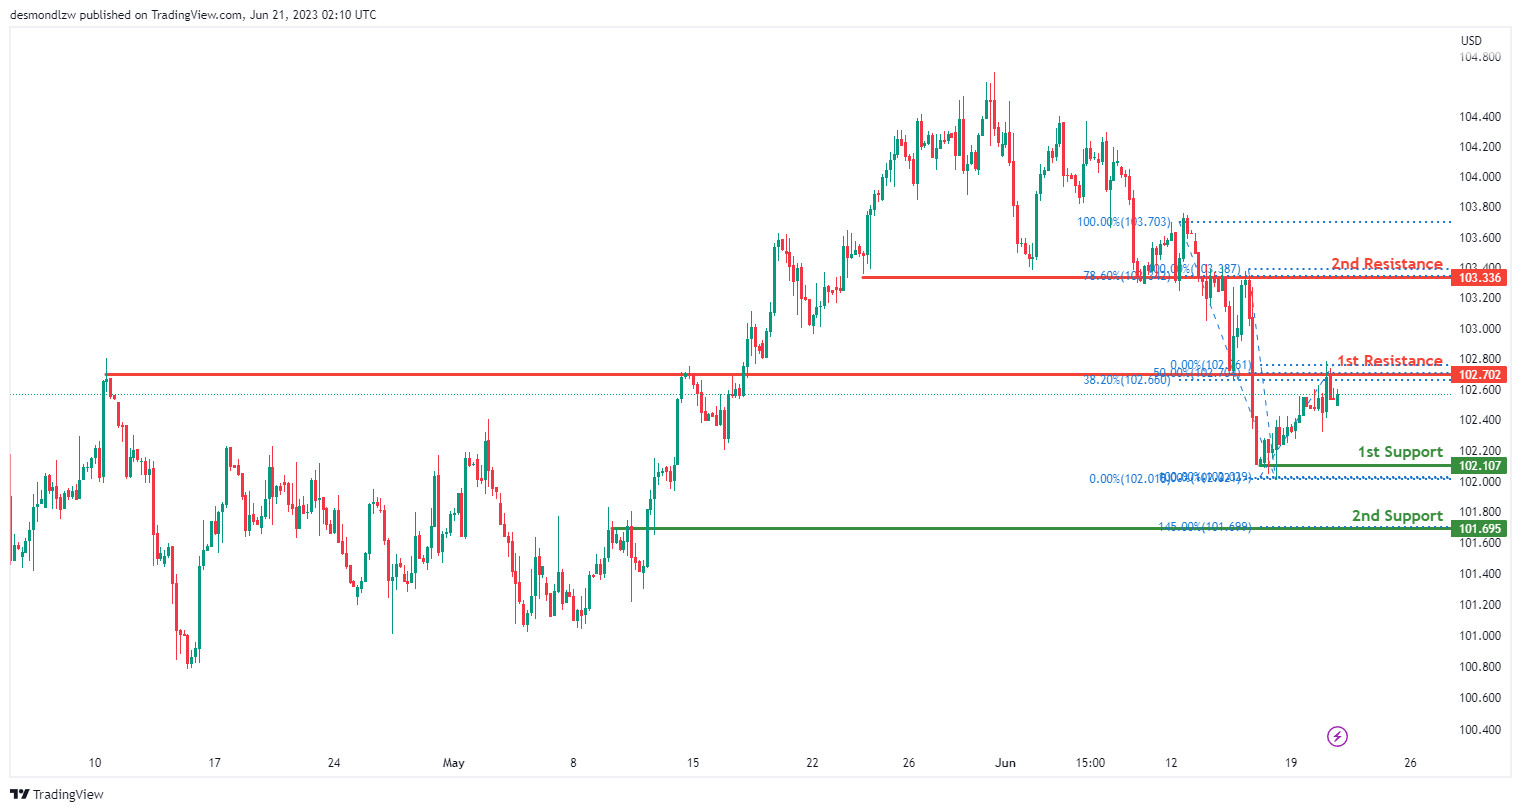
The EUR/USD chart currently exhibits a neutral momentum, suggesting a lack of clear directional bias in the market.
There is a potential for price to fluctuate between the first support level at 1.0905, which is an overlap support and coincides with the 23.60% Fibonacci Retracement, and the second support level at 1.0846, serving as a pullback support and aligning with the 38.20% Fibonacci Retracement.
On the upside, the first resistance at 1.0949 represents an overlap resistance, while the second resistance at 1.1000 acts as a swing high resistance, aligning with the 78.60% Fibonacci Retracement.
GBP/USD:
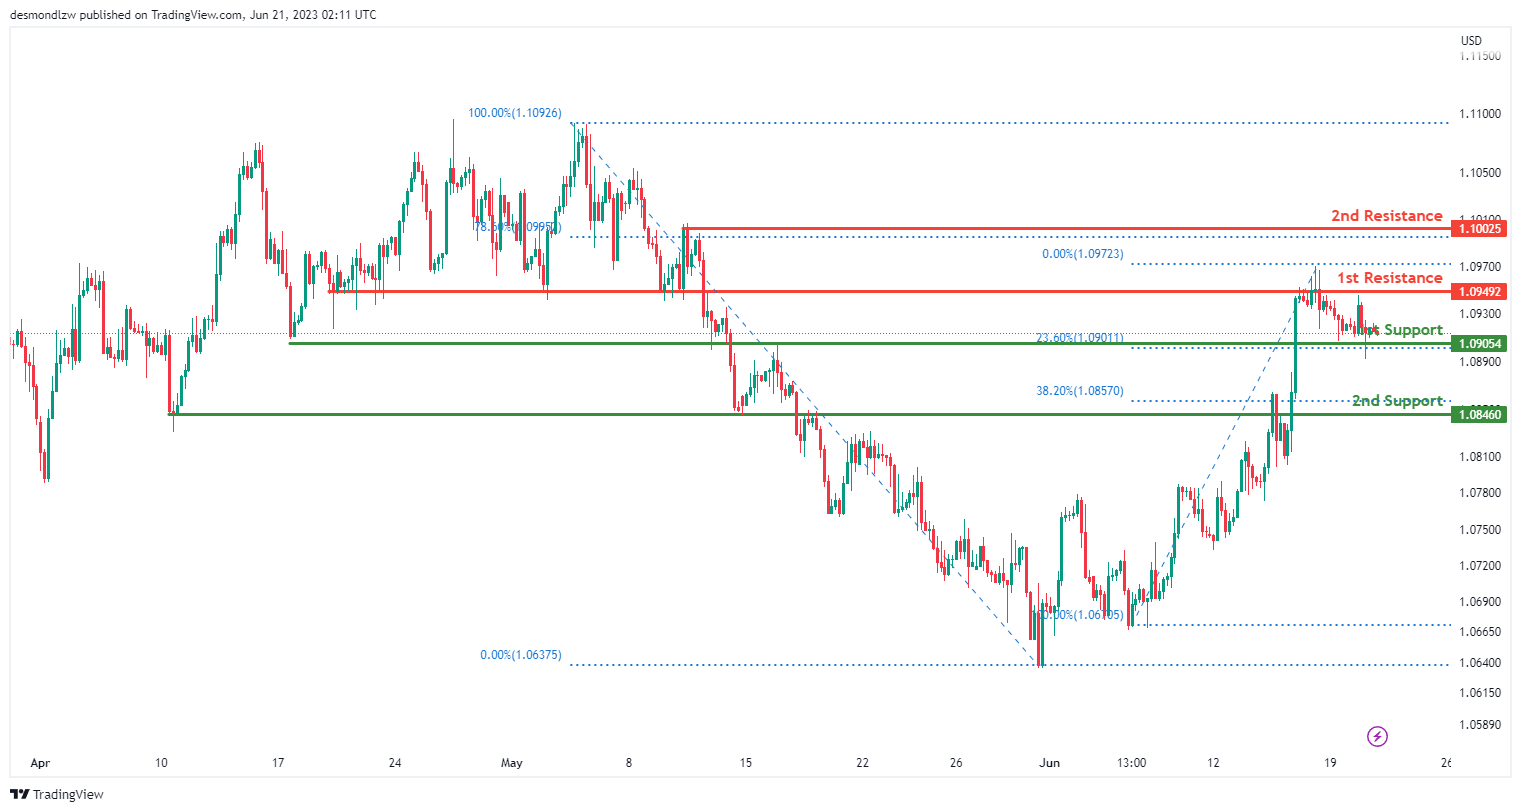
The GBP/USD chart currently demonstrates a bearish momentum, indicating a downward trend in the market.
There is a potential for a bearish continuation towards the first support level at 1.2681, which serves as a pullback support and aligns with both the 38.20% and 50% Fibonacci Retracement levels.
Additionally, the second support level at 1.2536 acts as a pullback support and aligns with the 61.80% Fibonacci Retracement.
On the upside, the first resistance at 1.2823 represents a swing high resistance.
USD/CHF:
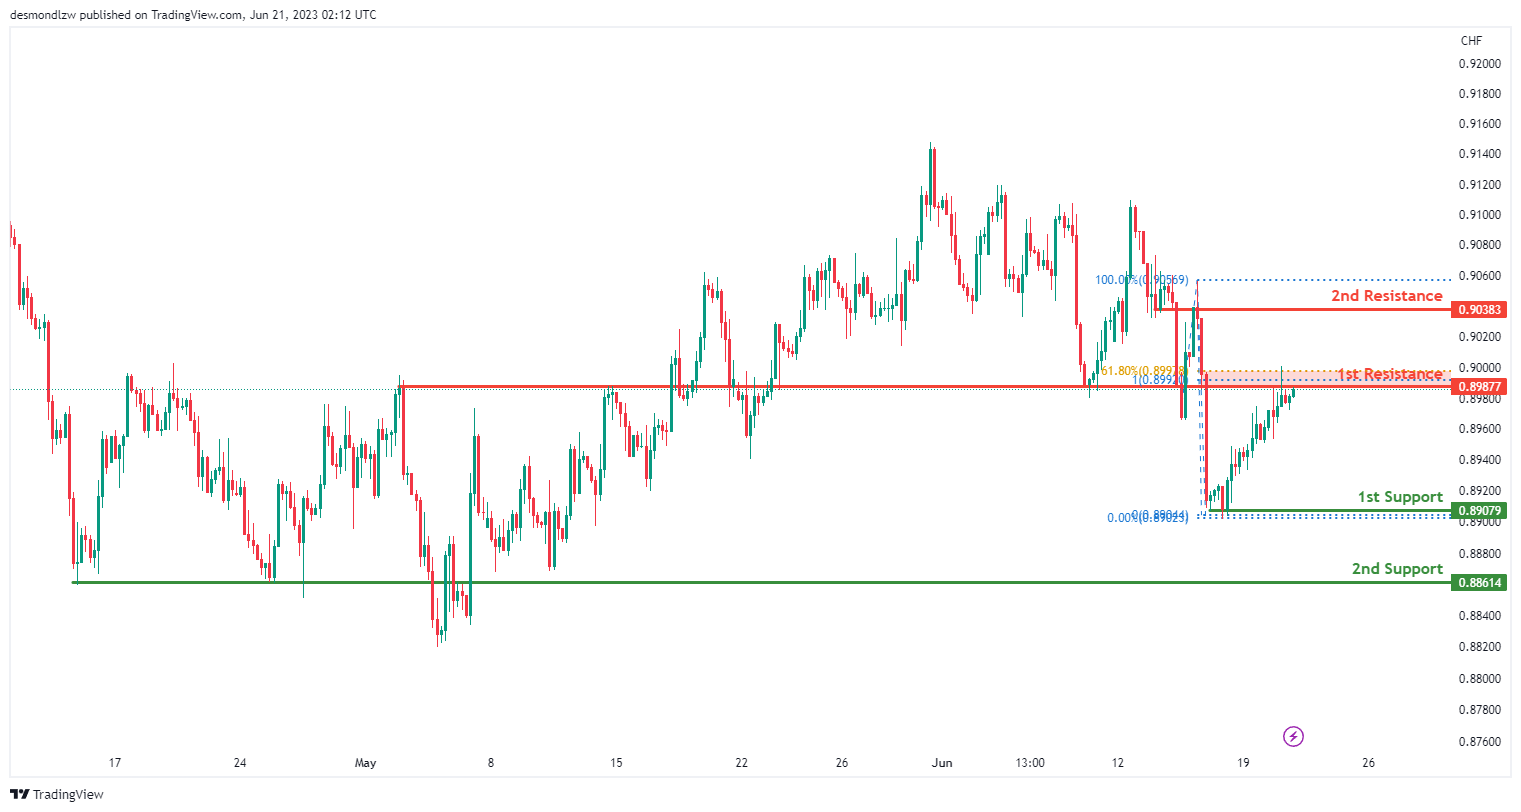
The USD/CHF chart currently exhibits a bearish momentum, indicating a downward trend in the market.
There is a potential for a bearish reaction off the first resistance level at 0.8987, which is an overlap resistance and aligns with both the 61.80% Fibonacci Retracement and 100% Fibonacci Projection.
On the downside, the first support level at 0.8907 represents a swing low support, while the second support level at 0.8861 acts as a pullback support.
Additionally, the second resistance level at 0.9038 functions as a pullback resistance.
USD/JPY:
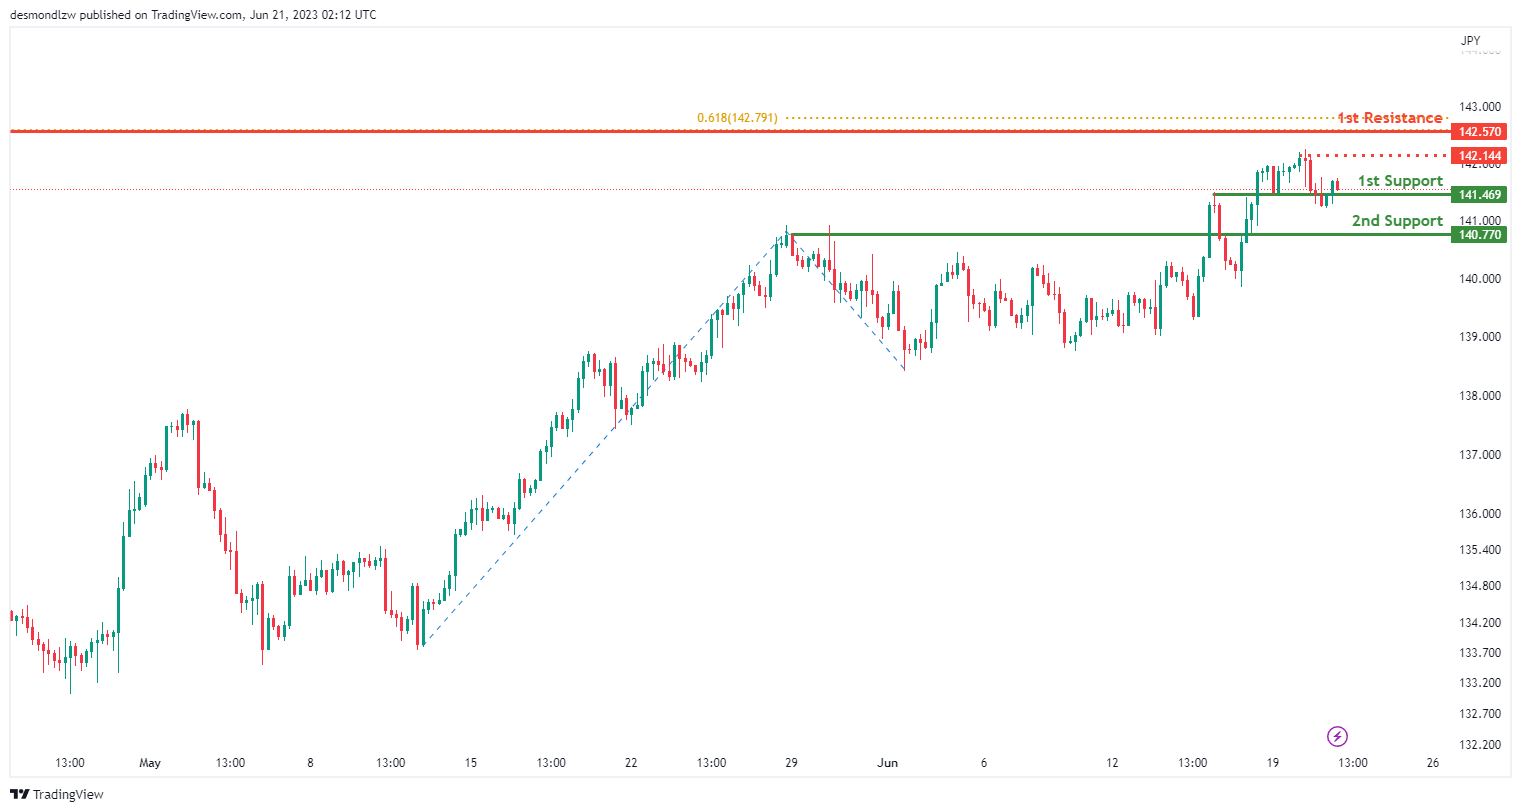
The USD/JPY chart demonstrates a bearish momentum, indicating a downward trend in the market.
There is a possibility of a short-term rise towards the first resistance level at 142.57, followed by a reversal and a drop towards the first support level at 141.46.
The first support at 141.46 is considered significant as it represents an overlap support, while the second support at 140.77 acts as a pullback support.
On the upside, the first resistance level at 142.57 is notable, coinciding with the 61.80% Fibonacci Retracement level. Additionally, the intermediate resistance at 142.20 functions as a swing high resistance.
USD/CAD:
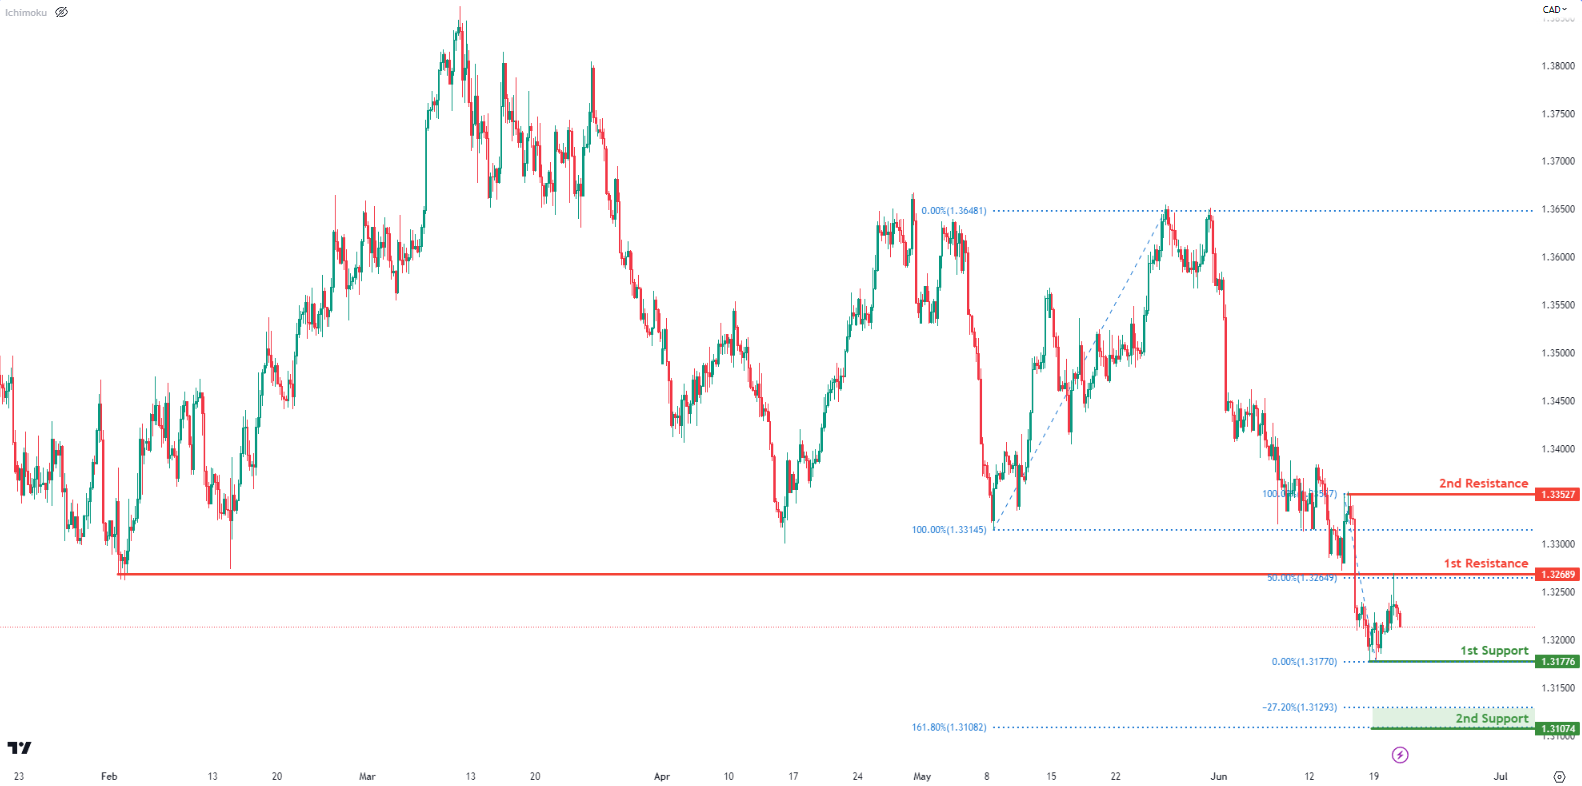
Price has reversed strongly from our 1st resistance at 1.3268 which is a major pullback resistance and also a short term 50% Fibonacci retracement. A reversal from this level could see prices drop down to test the 1st support level at 1.3177 which is a recent swing low support.
Breaking the 1st support level could see prices drop to the 2nd support level at 1.3107 which is a -27.2% Fibonacci expansion and a larger 161.8% Fibonacci extension.
AUD/USD:
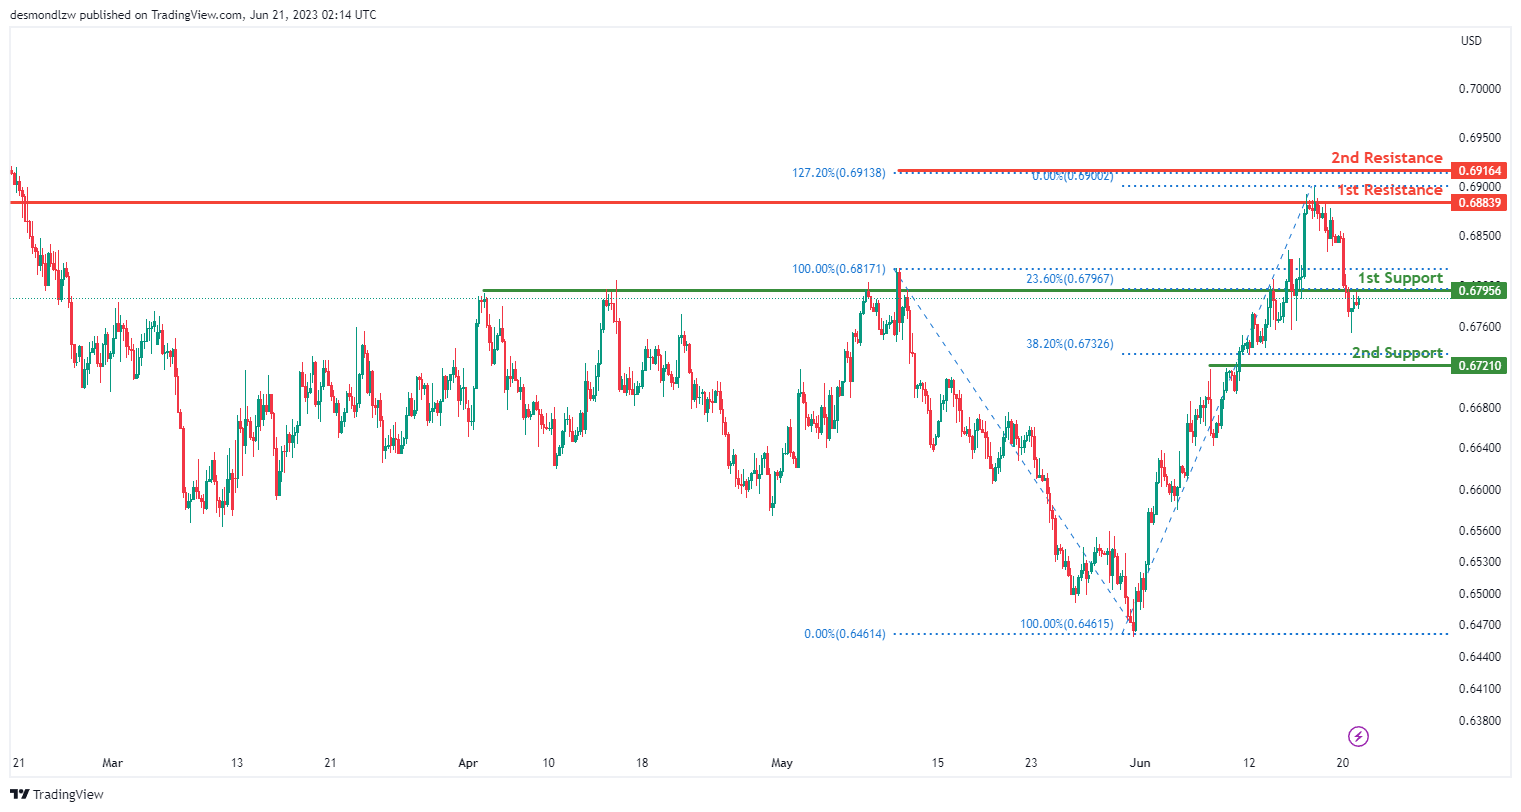
The AUD/USD chart demonstrates a bearish momentum, indicating a downward trend in the market.
There is a potential for a bearish break off the first support level at 0.6795, which is identified as a pullback support and aligns with the 23.60% Fibonacci Retracement. This could lead to a drop towards the second support level at 0.6721, which serves as another pullback support and coincides with the 38.20% Fibonacci Retracement.
On the upside, the first resistance level at 0.6883 represents a significant swing high resistance. Additionally, the second resistance level at 0.6916 is identified as a Fibonacci Extension level, further contributing to its significance.
NZD/USD
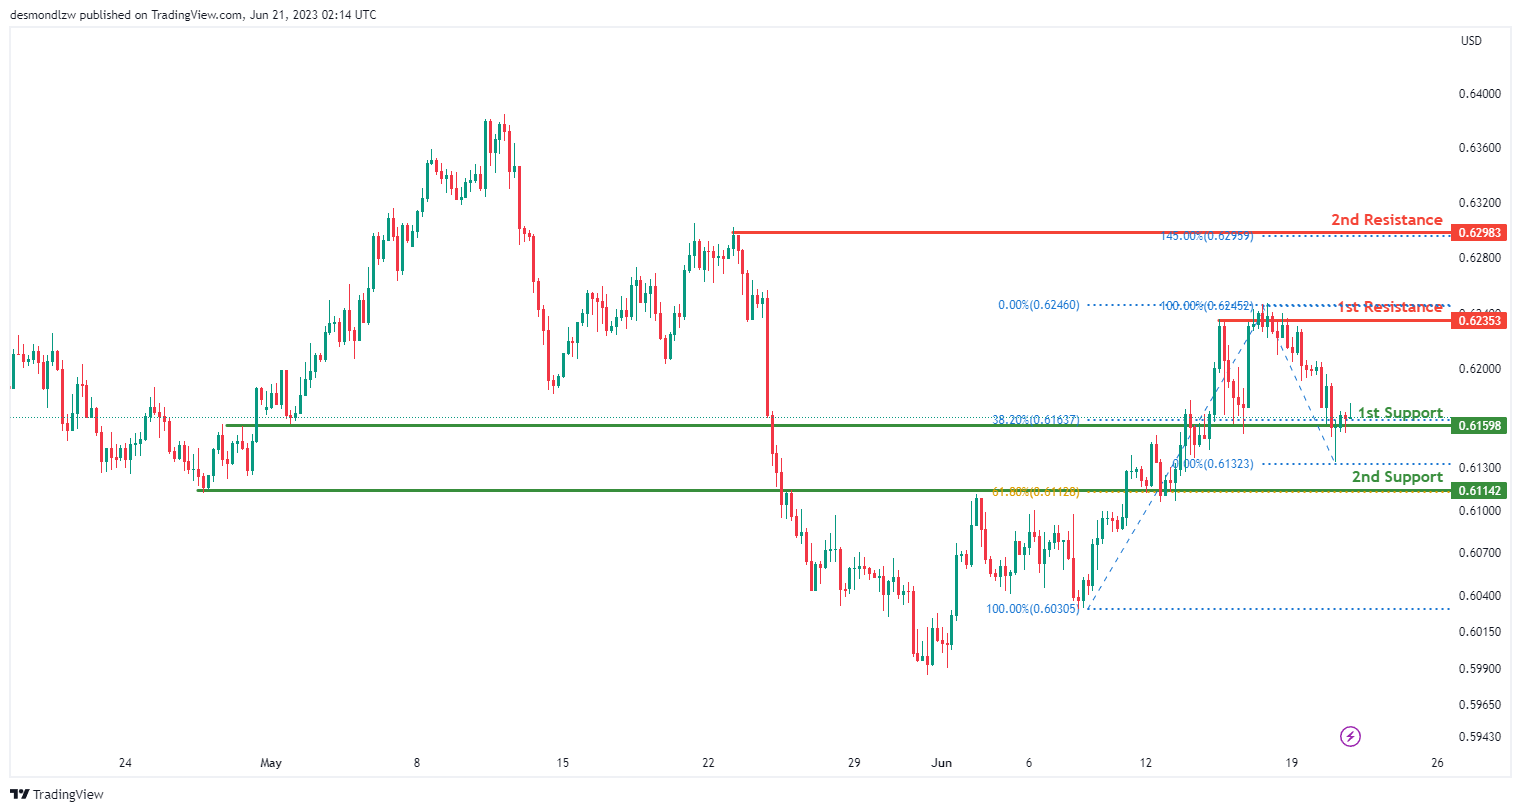
The NZD/USD chart indicates a weak bullish momentum, suggesting a bullish bounce off the first support level and move towards the first resistance level.
The 1st support sits at 0.6160 which is an overlap support and aligns with the 38.2% Fibonacci retracement level while the 2nd support lies at 0.6114 which is an overlap support taht aligns witht he 61.8% Fibonacci retracement level.
On the upside, the first resistance level at 0.6235 represents a multi-swing high resistance, while the second resistance level at 0.6306 acts as a swing high resistance.
Furthermore, the 2nd resistance sits at 0.6298 which is an overlap resistance that aligns wit the 145.00 Fibonacci extension level.
DJ30:
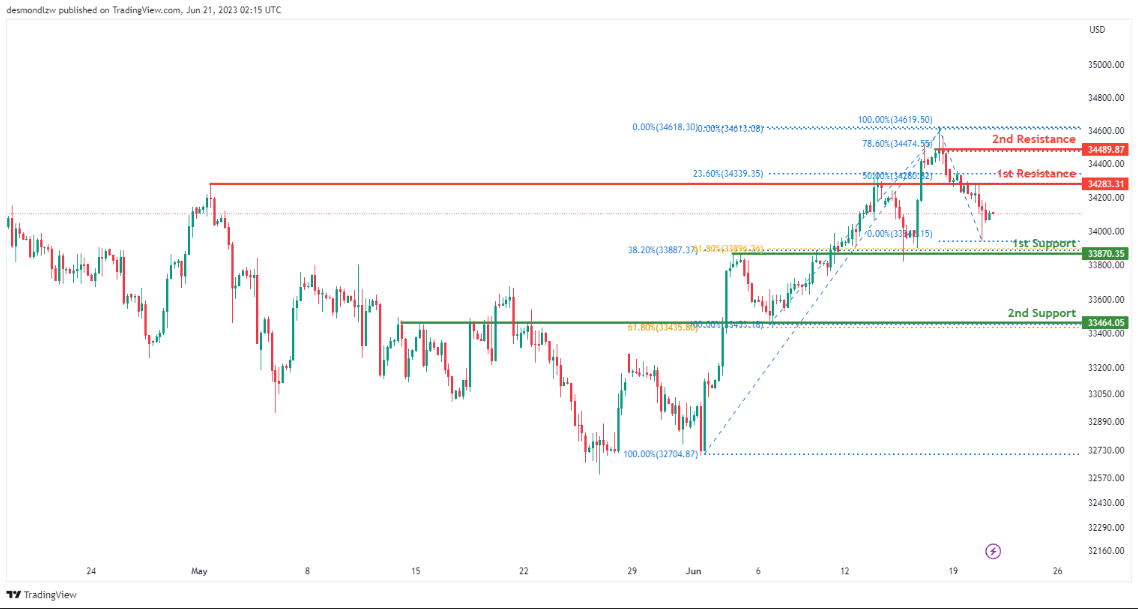
Price is currently approaching a major support at 33870 which is a 38.2% Fibonacci retracement and also an overlap support. It is worth noting that price is seeing higher lows suggesting that we’re still in a bullish trend.
A bounce from here could see prices rise up to test the 34783 level which is a big overlap resistance.
Breaking the 1st support could trigger another move down to the 2nd support at 33464 which is a 61.8% Fibonacci retracement.
GER30:
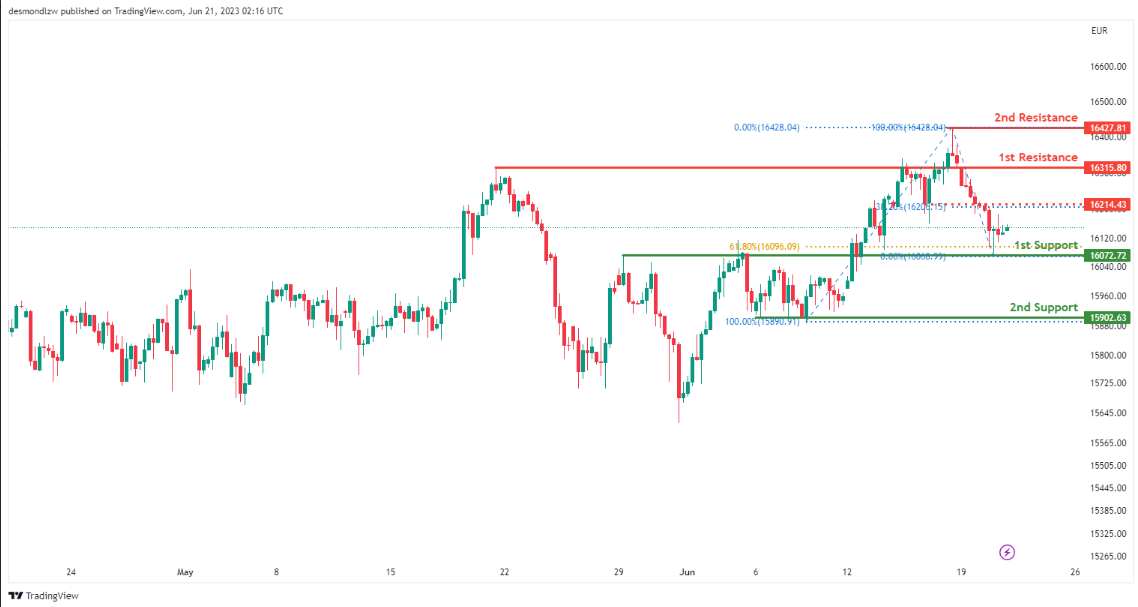
Price is currently testing a key overlap support at 16072 which also happens to be a short term 61.8% Fibonacci retracement. If price were to bounce from here, we could see it first test the intermediate resistance at 16234 which is a short-term pullback resistance. Breaking that level could accelerate it up towards 1st resistance at 16315 which is an overlap resistance.
The 2nd support level is down at 15902 which is a recent significant swing low support – this would be the level to watch out for if price were to break the 1st support level.
US500
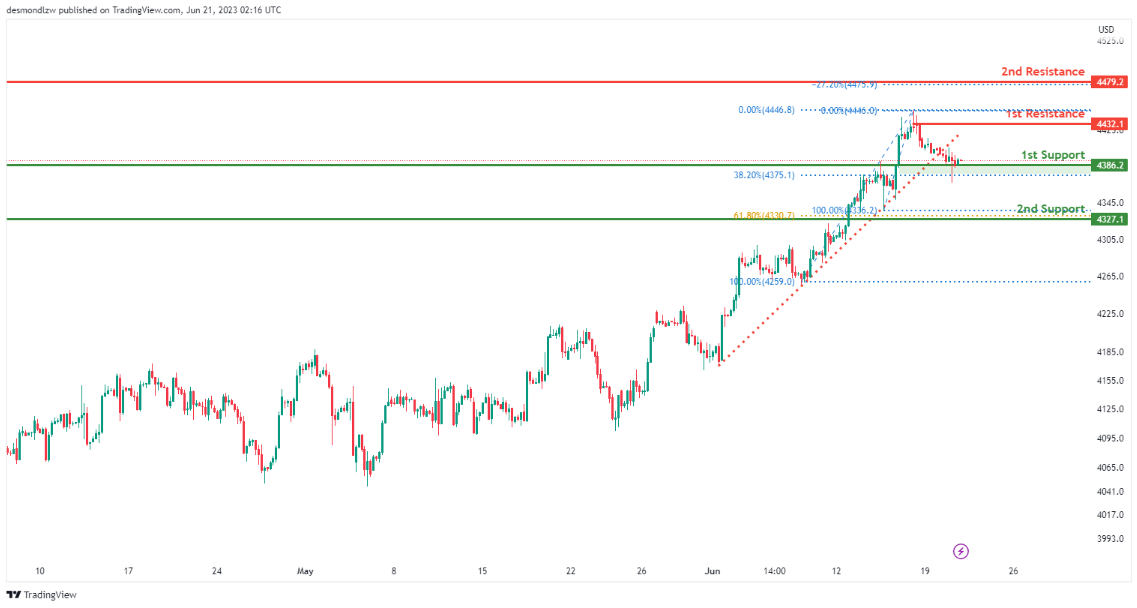
Price is currently testing the 1st support level at 4386 which is a major pullback support level. It is worth noting that price has already broken a short term ascending trend line which suggest we might be seeing a bearish breakout towards the 2nd support level. However, the key level to watch out for to trigger that move would be the 1st support level – which also coincides with the 38.2% Fibonacci retracement.
The 2nd support is down at 4327 which is a 61.8% Fibonacci retracement while the 1st resistance we’re looking at is the recent swing high resistance at 4432.
BTC/USD:
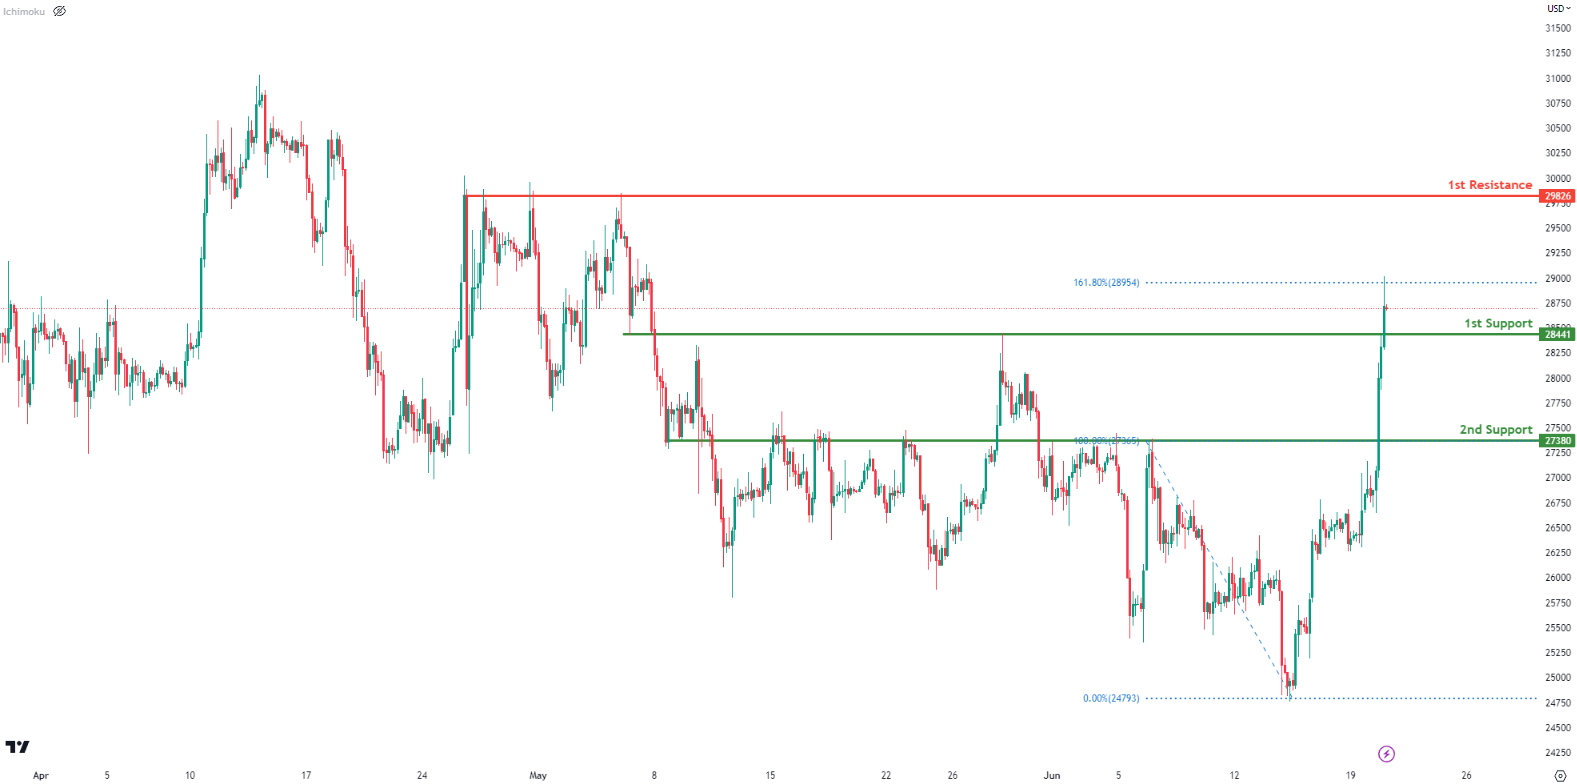
Price has broken a key resistance-turned-support at 28441 which is now a pullback support. We could potentially see prices accelerate up towards the 1st resistance at 29826 which is a multi-swing high resistance level.
It’s worth noting that price is currently testing the 161.8% fibonacci extension which is at 28954 – this could see prices reverse towards the 28441 level first before a potential bounce.
If price were to break the 1st support, we could see a bigger drop towards the 27380 level which is a key overlap support level.
ETH/USD:
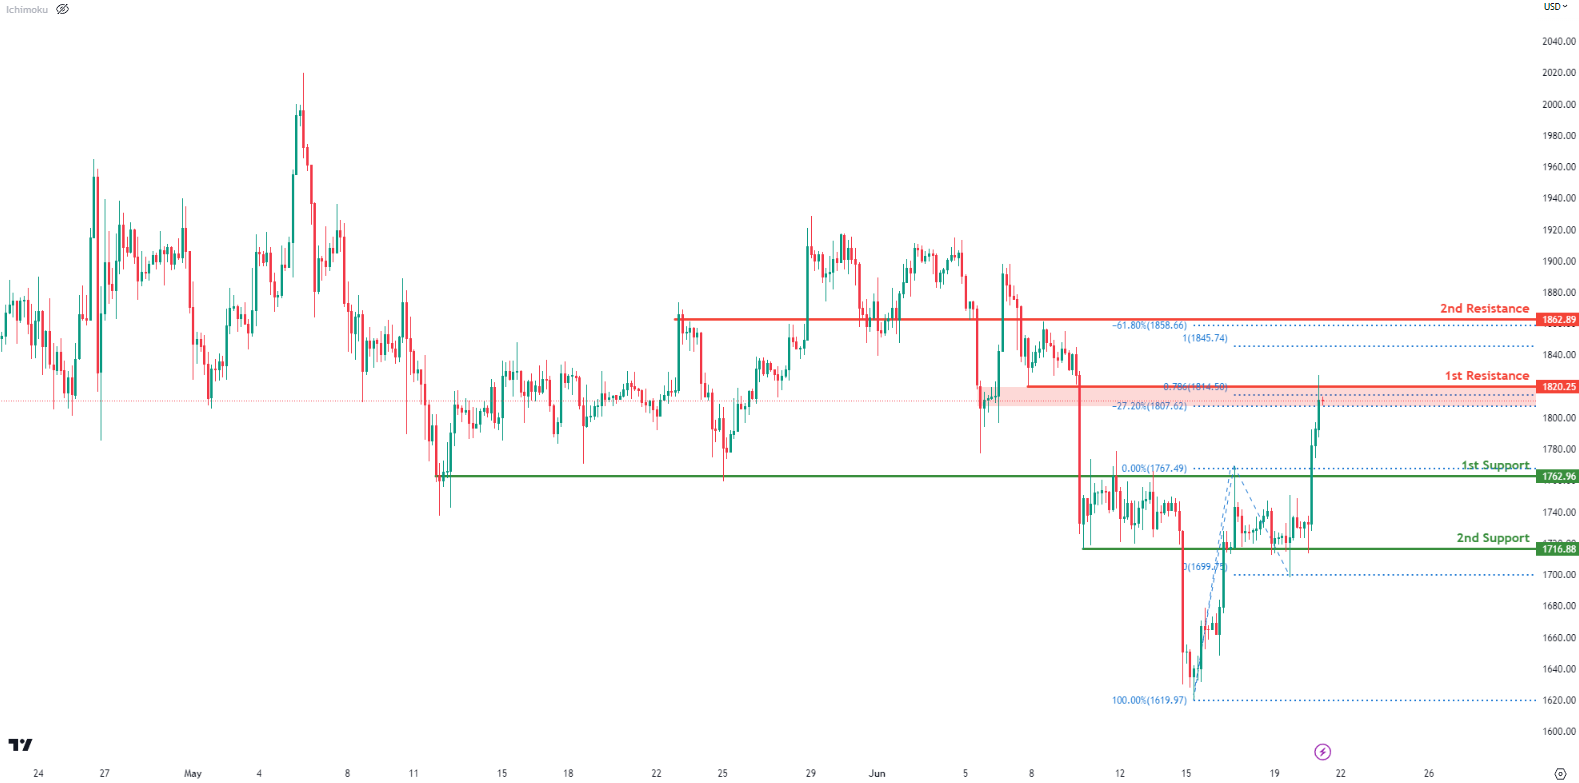
Price is currently testing a major resistance level at 1820 which is a -27% Fibonacci expansion and 78.6% Fibonacci projection. It also happens to be a pullback resistance. We could see a reversal from here to take prices back down to 1st support at 1762 which is an overlap support level.
If price were to break the 1st resistance, the next resistance we are looking at is up at 1862 which is an overlap resistance and a -61.8% Fibonacci expansion.
However, if prices were to reverse and break the 1st support, the next key support level to watch out for is 2nd support down at 1716 which is also an overlap support level.
WTI/USD:
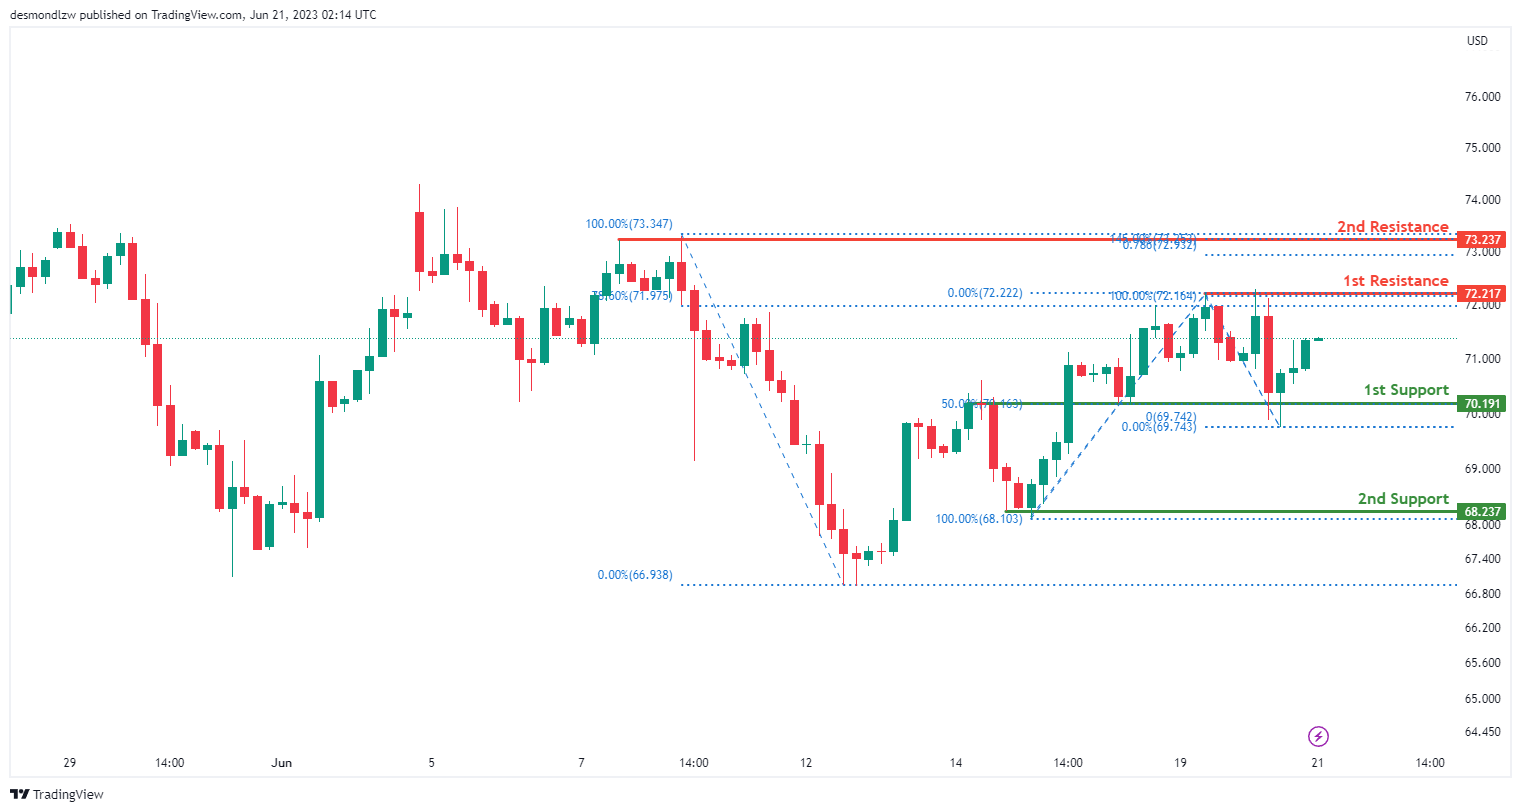
The WTI chart currently indicates a bullish momentum, suggesting an upward trend in the market.
There is a potential for price to continue its bullish movement towards the 1st resistance level at 72.22 which is an overlap resistance level and coincides with the 78.6% Fibonacci retracement. The 2nd resistance level sits at 73.24 which is an overlap resistance.
On the support side, the 1st support level sits at 70.19 which is verlap support level and coincides with the 50% Fibonacci retracement. Additional support can be found at the second support level of 68.24, which acts as a swing-low support.
XAU/USD (GOLD):
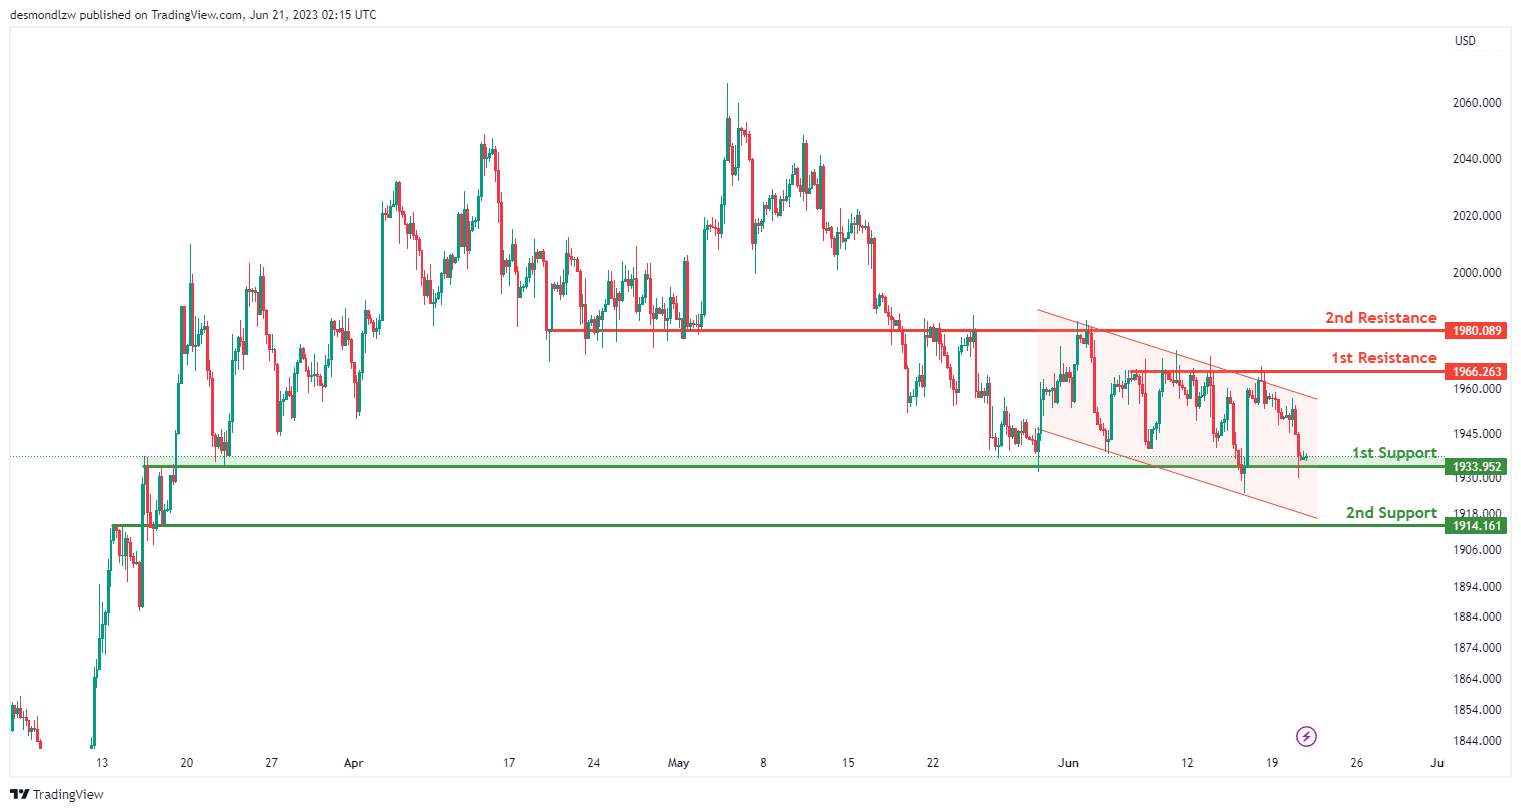
The XAU/USD chart currently exhibits a bearish momentum, indicating a downward trend in the market. This is supported by the price being in a bearish descending channel.
There is a possibility of a bearish continuation towards the first support level at 1933.95, which is identified as an overlap support. Additionally, the second support level at 1914.16 acts as another overlap support.
On the upside, the first resistance level at 1966.26 represents a multi-swing high resistance. Furthermore, the second resistance level at 1980.08 is identified as an overlap resistance.
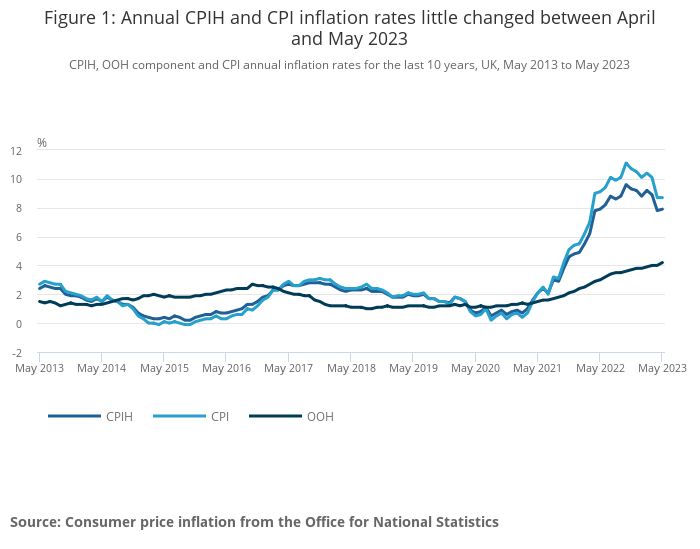
UK CPI unchanged at 8.7% yoy in May, core CPI rose to 7.1% yoy
UK annual CPI was unchanged at 8.7% yoy in May, above expectation of 8.5% yoy. Core CPI (excluding energy, food, alcohol and tobacco) accelerated to 7.1% yoy, up from prior month's 6.8% yoy, and the highest rate since March 1992. CPI goods eased from 10.0% yoy to 9.7% yoy. But CPI services rose from 6.9% yoy to 7.4% yoy. For the month, CPI rose 0.7% mom, slowed from April's 1.2% mom, but was well above expectation of 0.4% mom.
Also released. RPI ticked down from 11.4% yoy to 11.3% yoy, above expectation of 11.1% yoy. PPI input came in at -1.5% mom, 0.5% yoy, versus expectation of -0.6% mom, 1.2% yoy. PPI output was at -0.5% mom, 2.9% yoy, versus expectation of -0.1% mom, 3.6% yoy. PPI output core was at -0.3% mom, 4.1% yoy, versus expectation of 0.1% mom, 4.7% yoy.
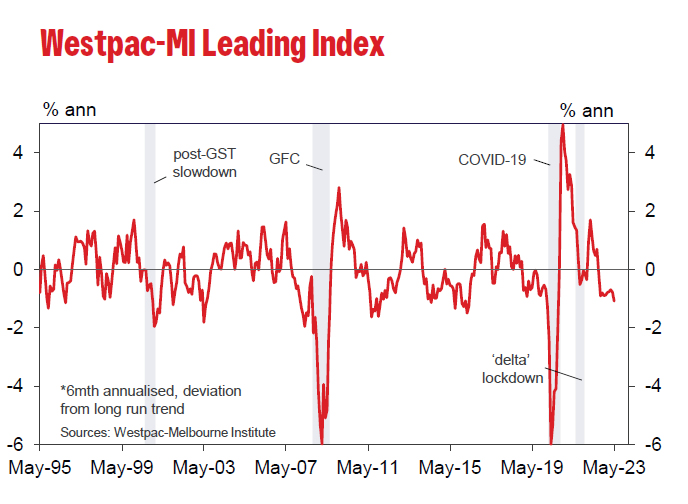
Australia’s Westpac leading index fell to -1.09%, weakness to extend into 2024
Australia Westpac Leading Index growth rate fell from -0.78% to -1.09% in May. This is the lowest read of the growth rate since the pandemic. The tenth consecutive negative print for the index. The negative Index growth rates point to below-trend economic growth.
Westpac expects the weakness to extend through 2023 and into 2024. Westpac recently revised down growth forecast 2023 and 2024, from 1% and 1.5% to 0.6% and 1.0% respectively. This weakness in the economy is centred around consumers but also reflects slowing global economy; downturn in dwelling construction; and progressive weakening in labour market.
Regarding RBA policy, Westpac expects the central bank to raise cash rate by a further 0.25% at July 4 meeting. "As we saw at the June Board meeting, we expect that the July meeting will see these considerations of inflation risks again overriding concerns about the poor growth outlook."
BoJ Adachi: Appropriate to continue monetary easing with YCC
BoJ board member Seiji Adachi voiced support for continued monetary easing amid a climate of significant uncertainty regarding price outlook. Adachi relayed these views during a discussion with business leaders in Kagoshima.
Adachi said, "My view is that it's appropriate to continue monetary easing with the yield curve control framework." He added, "The shape of the yield curve has become smooth overall and there is improvement in market functioning."
"Amid huge uncertainty over the price outlook, there are upside and downside risks. In the long run, however, the downside risks appear to be larger," he warned. These risks, according to Adachi, must be carefully considered when deciding on changes to monetary policy.
Adachi also noted an interesting shift in public's perception of inflation, suggesting that Japan's long-standing deflationary mindset is starting to change. "We're seeing some changes in the public's deflationary mindset, or the perception that prices won't rise," he said.
"In a sense, we're moving closer to achieving our price target. But there's high uncertainty over our baseline inflation outlook, so it's premature to tweak monetary policy," Adachi concluded.
Fed nominees Jefferson, Cook and Kugler prioritize tackling inflation
Three nominees for key roles at Fed, including two sitting Fed Governors, have pledged to make tackling inflation their primary concern if their nominations are confirmed. This commitment was made in prepared remarks ahead of confirmation hearings before Senate Banking Committee on Wednesday.
Philip Jefferson, the nominee for vice chair, recognized the multifaceted challenges facing the economy including inflation, banking-sector stress, and geopolitical instability. Jefferson said, "The Federal Reserve must remain attentive to them all. Inflation has started to abate, and I remain focused on returning it to our 2 percent target."
Lisa Cook, who is nominated for a new 14-year term, echoed Jefferson's concerns about inflation. She stated, "The American economy is at a critical juncture, and it will be essential for the FOMC to act as needed to bring inflation back to our 2% inflation target."
Adriana Kugler, the nominee chosen by President Joe Biden to fill the vacancy left by Lael Brainard earlier this year, reiterated the same sentiment. Kugler emphasized, "If confirmed, I am deeply committed to setting monetary policy to reduce inflation and promote maximum employment, and to foster the resilience of the financial sector to support job creation and economic growth."
Can Fed Chair Powell Wake Up Dollar Bulls?
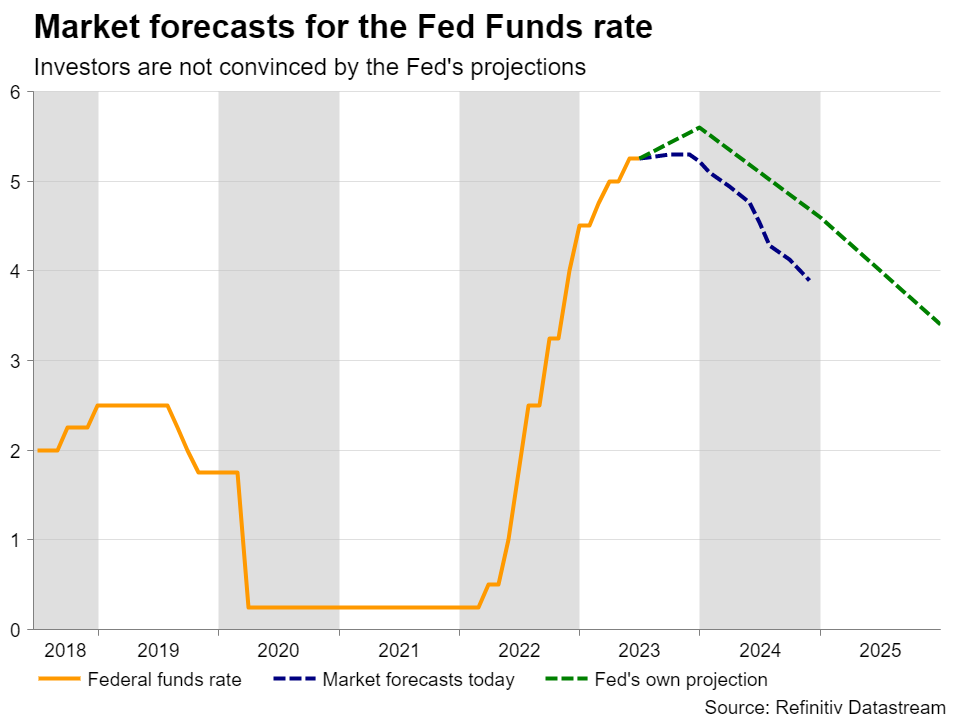
Despite the Fed’s updated dot plot last week signaling that two more rate hikes may be on the cards, market participants are finding it hard to believe it. Fed Chair Powell did not convince them either when he held the press conference following the decision. However, he is being given another opportunity to pass his message this week as he is testifying before Congress on Wednesday and Thursday at 14:00 GMT.
Investors don’t believe the Fed
At last week’s meeting, the Fed decided to hit the pause button, skipping a hike for the first time since March 2022. However, it was more than clear that this was not the end of the tightening crusade, rather than a small break to evaluate incoming data and how prior increases may have affected the world’s largest economy. After all, the updated ‘dot plot’ pointed to 50bps worth of additional rate hikes later this year before the end credits roll.
Having said that though, market participants remained unconvinced that this could be the case, continuing to price in only one more quarter-point hike and a series of rate cuts through next year, despite Fed Chair Powell saying at the press conference that any rate cuts are “a couple of years out.”
Powell gets a second chance to pass the message
This week, Chair Powell will have another opportunity to convince the financial community about the Committee’s intentions, on Wednesday and Thursday, when he is testifying before Congress. With the PMIs suggesting easing price pressures, the CPI slowing faster than expected, and wage growth softening as well, it may be hard for the Fed Chief to find convincing arguments regarding the need for two additional rate hikes. After all, the full effect of the prior increases is not fully felt by the economy yet.
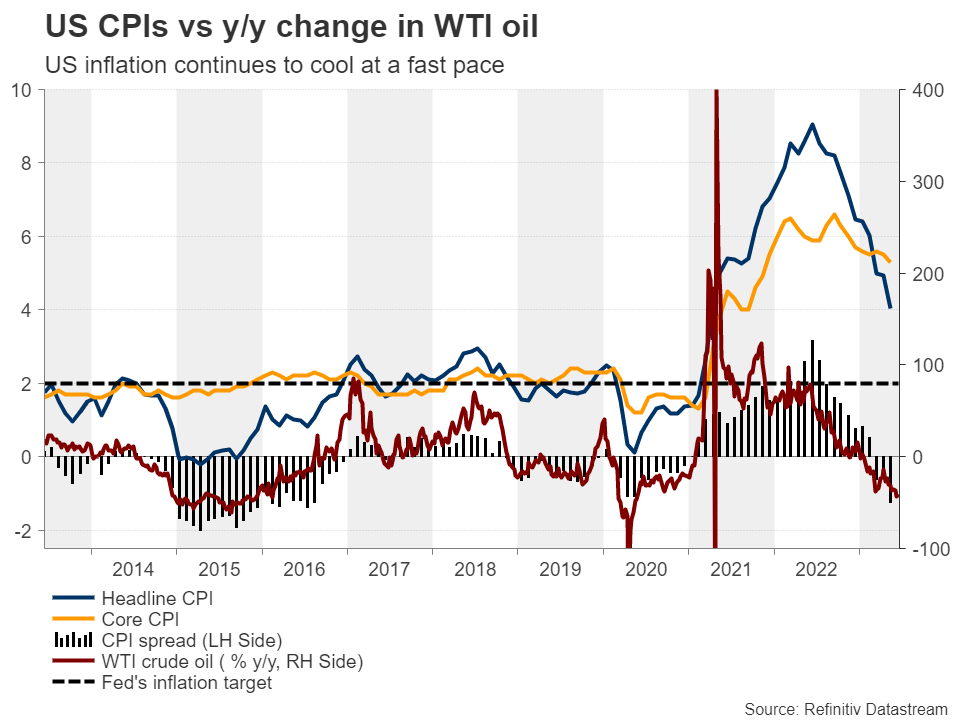
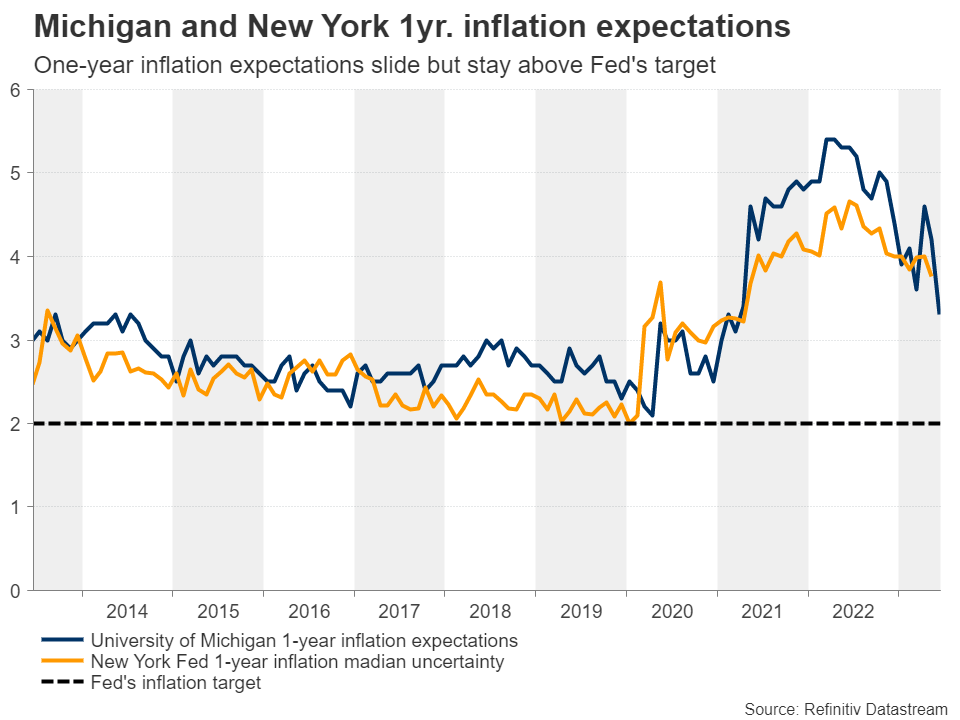
A relatively reasonable argument may be that, despite also sliding notably, inflation expectations suggest that in a year’s time, inflation will still be above the Fed’s 2% target. The University of Michigan is calculating a 3.3% y/y rate for next June, while the New York Fed model is pointing to a higher 3.76% rate. So, taking these rates as a given, it may be unwise for the Fed to start cutting rates massively next year.
Dollar could gain, but bullish reversal still premature
So, if Powell highlights the need for higher-for-longer rates because there is still a long way to go before the job is done, the dollar could gain and equities could correct lower. Nevertheless, with inflation expectations not being an accurate forecasting tool, but rather a comparison tool and a moving untouchable target, calling for a bullish trend in the dollar would still be premature.
Incoming data pointing to further cooling of price pressures could translate into further declines in inflation expectations and perhaps allow market participants to maintain their rate-cut bets for early next year. Currently, conditional upon a July or September hike, they even see more than 50bps worth of reductions by next May.
With the BoE expected to deliver 140bps worth of additional rate hikes, Fed cut bets are likely to keep pound/dollar in an uptrend for a while longer, especially if UK policymakers adopt a more aggressive stance when they meet on Thursday.
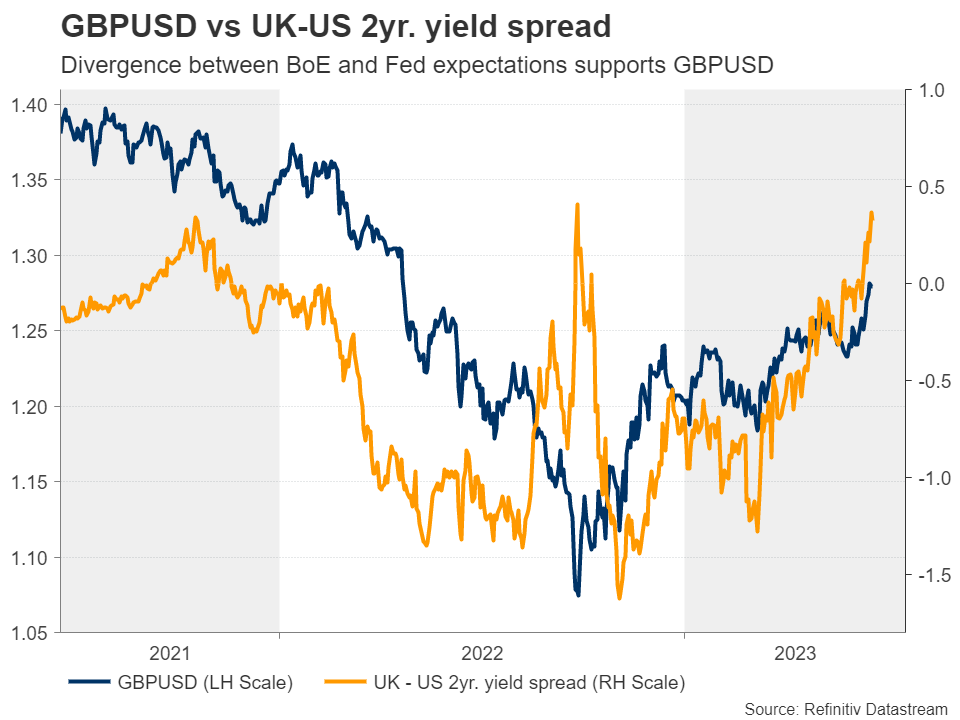
Pound/dollar uptrend may be destined to continue
Just last Thursday, Cable emerged above the 1.2670 barrier, which offered resistance on May 10 this year and back on May 27, 2022, confirming a higher high on the daily chart and signaling the continuation of the prevailing medium-term uptrend.
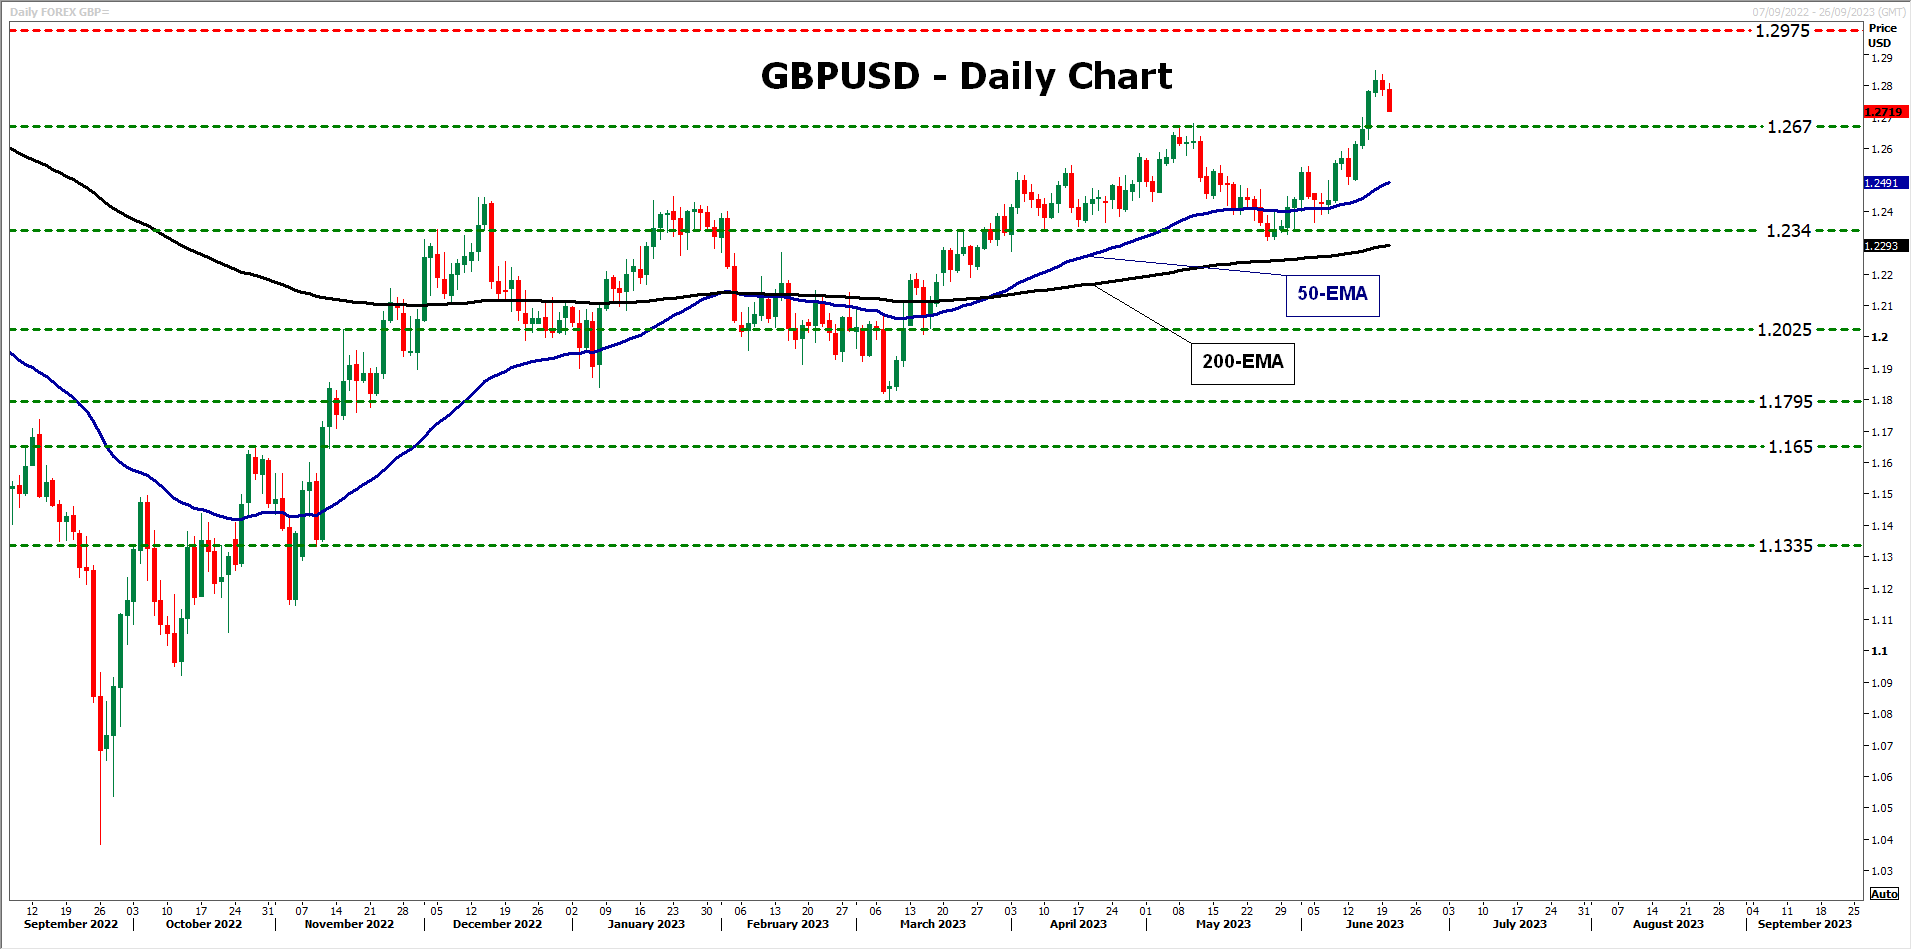
The pair is currently in a sliding mode, but even if it continues for a while longer due to Powell appearing in his hawkish suit, the bulls could recharge from above the key 1.2340 zone and push the pair up again. A potential catalyst for the rebound may be a hawkish BoE on Thursday. The rebound could take the price back above 1.2670 and perhaps aim for the 1.2975 zone, which acted as key support between March and April 2022.
Now, if pound/dollar falls below 1.2340, it will enter its flat zone and thus, the outlook may be considered neutral. For the picture to turn bearish, a break below 1.1795 may be required. Such a dip could initially target the 1.1650 level, the break of which could see scope for declines towards the low of November 9 at 1.1335.
Bitcoin Price Rallies After Crucial Bullish Breakout
Key Highlights
- Bitcoin price is gaining pace above $27,500.
- BTC broke a major bearish trend line with resistance at $25,900 on the 4-hour chart.
- EUR/USD is consolidating gains above the 1.0880 support.
- The UK Consumer Price Index could decline from 8.7% to 8.4% in May 2023 (YoY).
Bitcoin Price Technical Analysis
Bitcoin price started a recovery wave from the $24,750 zone. BTC/USD climbed higher above the $26,500 and $27,000 resistance levels.
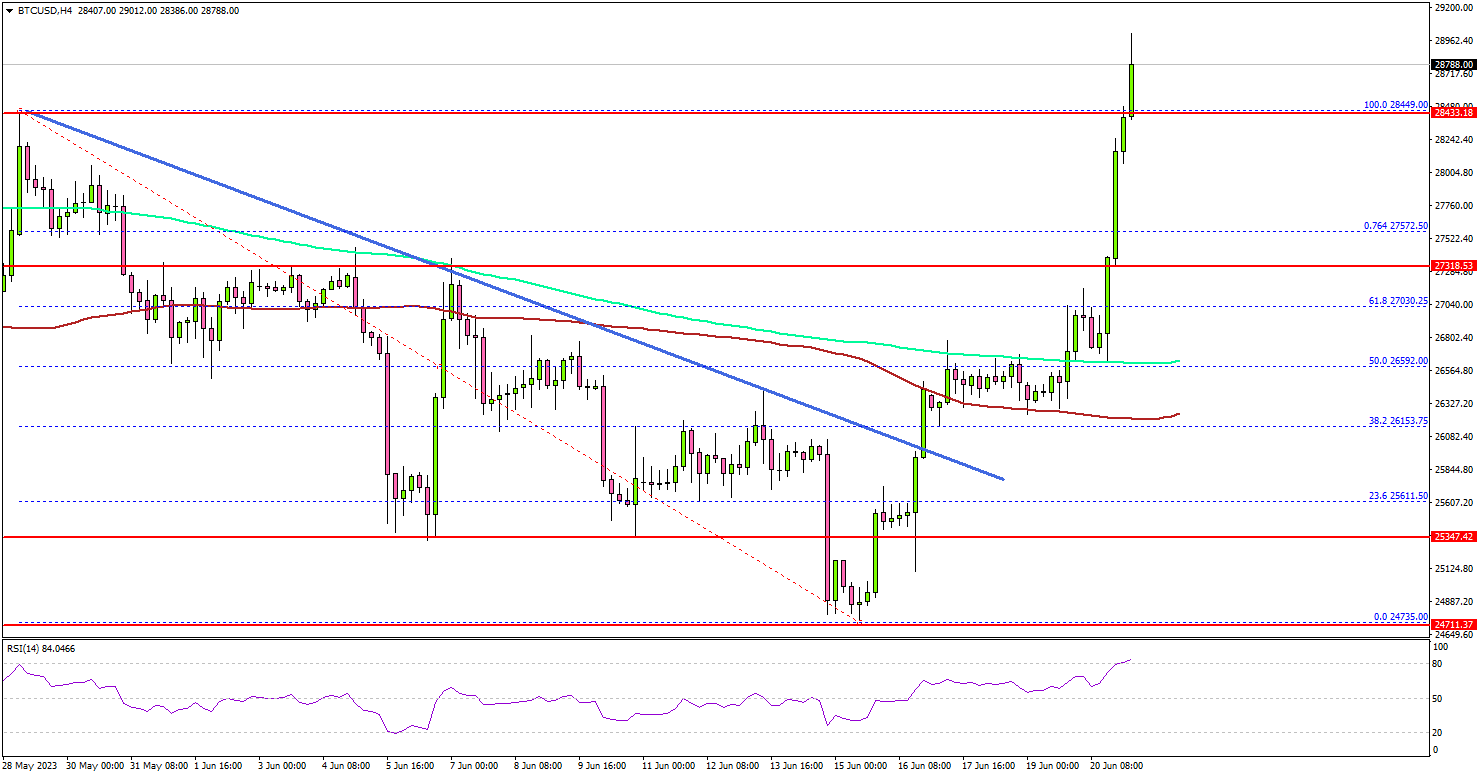
Looking at the 4-hour chart, the price was able to surpass the $26,500 resistance zone and a major bearish trend line with resistance at $25,900.
There was a clear move above the 61.8% Fib retracement level of the downward move from the $28,449 swing high to the $24,735 low. It is now trading above the 100 simple moving average (red, 4 hours) and the 200 simple moving average (green, 4 hours).
On the upside, the price is facing resistance near the $29,000 level. The first major resistance is near the $29,200 level (a multi-touch zone).
A successful close above the $29,200 level might spark another bullish wave. In the stated case, the price may perhaps rise toward the $30,000 level.
If not, Bitcoin might decline again and trade below the $27,500 support. The next major support is near the $27,200 level. If there is a downside break and a close below $27,200, Bitcoin might revisit the $26,000 zone in the coming days.
Economic Releases
- UK Consumer Price Index for May 2023 (YoY) – Forecast +8.4%, versus +8.7% previous.
- UK Core Consumer Price Index for May 2023 (YoY) – Forecast +6.8%, versus +6.8% previous.
- Federal Reserve Chair Jerome Powell testifies before Congress.
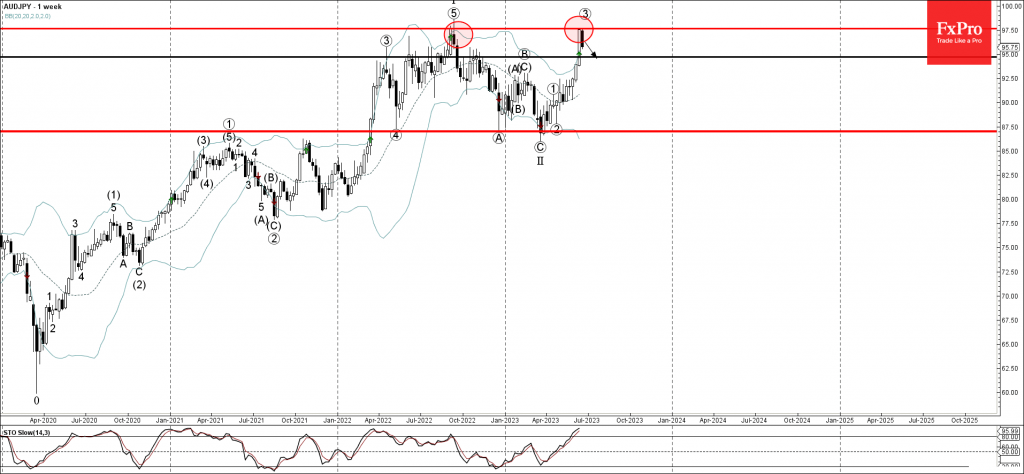
AUDJPY Wave Analysis
- AUDJPY reversed from resistance level 97.50
- Likely to fall to support level 95.00
AUDJPY currency pair recently reversed down from the resistance level 97.50, which stopped the weekly uptrend in the middle of last year.
The downward reversal from the resistance level 97.50 stopped the previous weekly upward impulse sequence from March .
Given the strength of the resistance level 97.50 and the overbought weekly Stochastic, AUDJPY can be expected to correct down further to the next string support level 95.00.
GBPAUD Wave Analysis
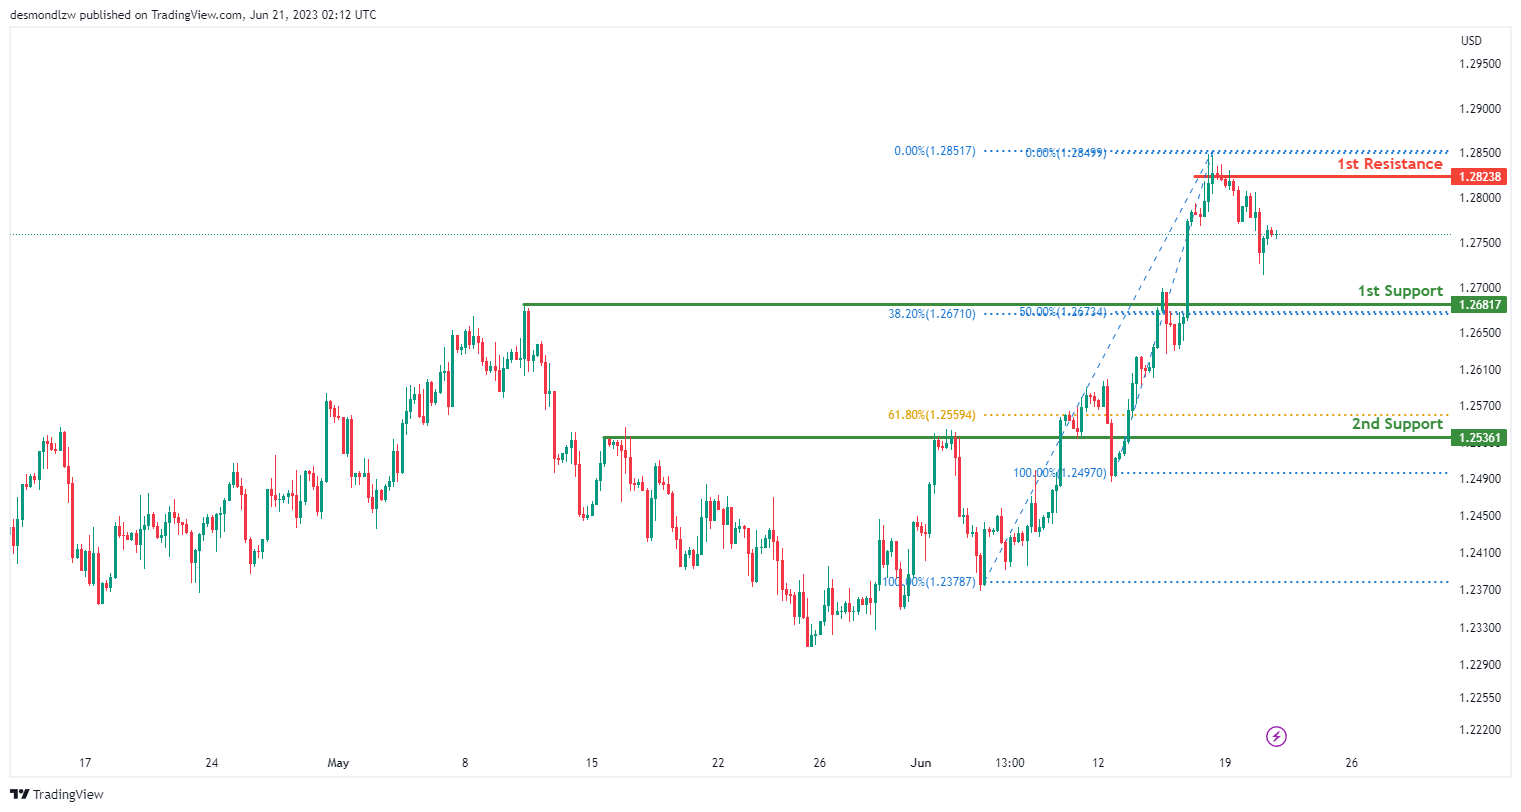
- GBPAUD rising inside impulse wave 3
- Likely to reach resistance level 1.9130
GBPAUD currency pair continues to rise inside the minor impulse wave 3, which started earlier with the daily Bullish Engulfing from the support level 1.8525.
The active minor impulse wave 3 belongs to the intermediate impulse sequence (3) from February.
Given the prevailing uptrend, GBPAUD can be expected to rise further toward the next resistance level 1.9130 (which stopped the previous impulse wave (c) at the end of last month).