Sample Category Title
Bitcoin Testing a Downtrend
Market picture
Crypto market capitalisation rose 0.8% to $1.073 trillion, close to its level of 10 days ago. Bitcoin was a major contributor to the rally, rising 1.6% to $28.8K, while Ethereum gained just 0.4% to $1730. Among the top altcoins, Solana (+3.5%) stands out, with other altcoins ranging from -1.2% (XRP) to +1.6% (Polygon).
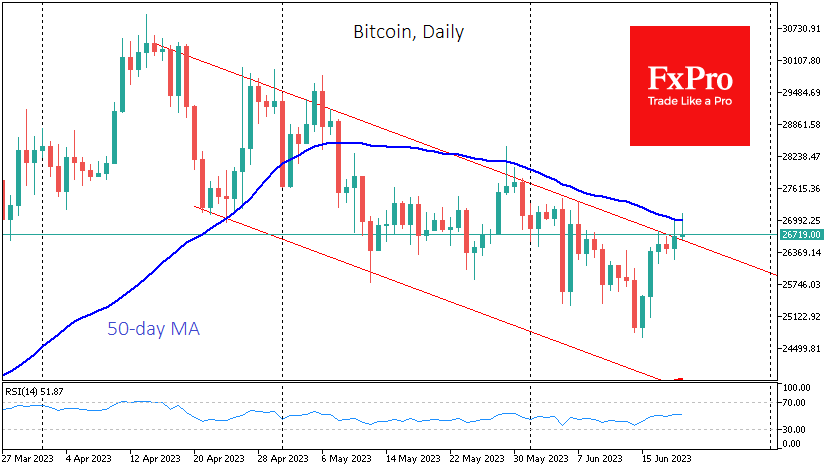
For the fifth day out of the last six, Bitcoin has breached the upper boundary of its bearish range and tested the 50-day moving average near $27K. Although the price has now breached the channel’s upper boundary, a break of the downtrend cannot be declared until a close above $27.2K, the previous local high, is achieved. A reversal from current levels offers a downside of more than 10% with the potential for a drop to the 200-day moving average.
According to CoinShares, investment in crypto funds fell by a paltry $5 million last week, but net outflows continued for the ninth consecutive week. Retail traders helped push Bitcoin above $26K, according to Glassnode, which noted an increase in activity from addresses controlling between 0.1 and 1 BTC.
News background
MicroStrategy founder Michael Saylor said that recent SEC actions against crypto have made it clear to the industry that it is doomed to be bitcoin-centric. According to him, BTC is the only institutional-level asset.
US crypto payments company Wyre announced it was shutting down after a decade of operation due to difficult bear market conditions. After fintech company Bolt terminated a $1.5bn acquisition agreement in September 2022, the platform was on the brink of bankruptcy.
Ethereum developers discussed details of a future update to the Deneb consensus level during a conference call that will be part of Dencun hard fork. The minimum balance for ETH network validators is proposed to be increased from 32 ETH to 2048 ETH, attempting to improve blockchain efficiency.
The International Monetary Fund (IMF) is working on a global infrastructure for central bank digital currencies (CBDCs) and legislation to control the movement of funds in CBDCs, said IMF chief Kristalina Georgieva.
Gold Stuck in Range, Downside Risks Rise
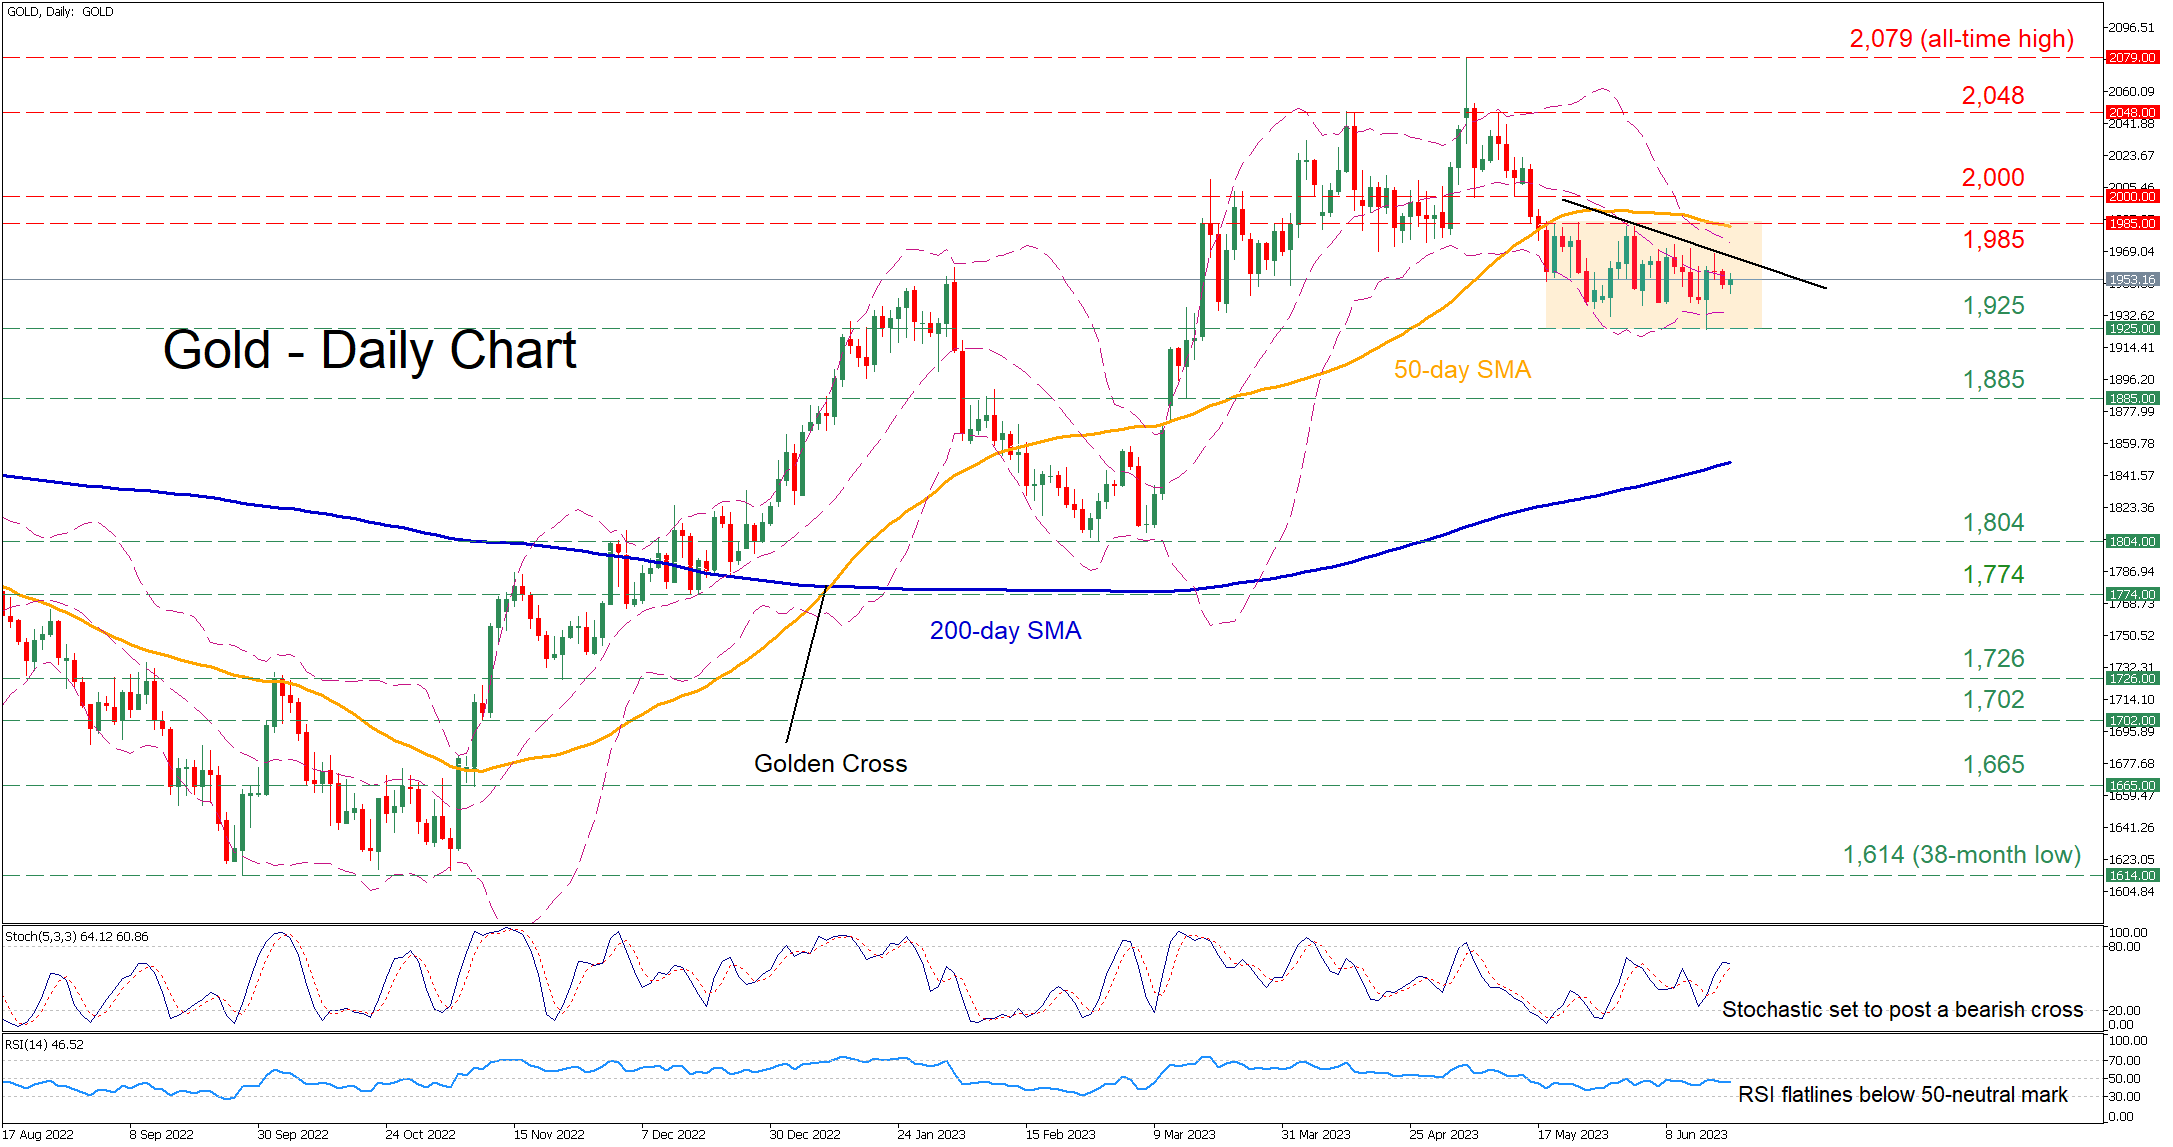
Gold experienced a pullback after peaking at the all-time high of 2,079 in early May, falling beneath its 2,000 psychological mark and the 50-day simple moving average (SMA). Although bullion has been stuck within a tight range for the past month, the formation of a structure of lower highs is hinting at a deteriorating technical picture.
The momentum indicators currently suggest that near-term risks are tilted to the downside. Specifically, the stochastic oscillator is set to post a bearish cross, while the RSI has flatlined beneath its 50-neutral mark.
Should the bearish near-term structure extend, the price could initially challenge the recent three-month low of 1,925. If that floor collapses, the spotlight could turn to 1,885 before the 2023 bottom of 1,804 gets tested. Even lower, the 1,774 hurdle may provide downside protection.
Alternatively, if the price manages to break above the restrictive trendline that connects the recent lower highs, initial resistance could be found at 1,985, which overlaps with the 50-day SMA. Conquering this barricade, the bulls could aim at the crucial 2,000 psychological mark before 2,048 comes under examination. Piercing through the latter, the price could revisit its record high of 2,079.
Overall, gold has been directionless in the past month, but the short-term oscillators are slowly tilting towards the bearish side. Therefore, a failure to break through the descending trendline might trigger a significant retreat.
Hang Seng Index Technical: Minor Uptrend Intact
- Hang Seng Index has dropped by -2.4% since last Friday’s high ex-post interest rate cuts by PBoC.
- Short-term uptrend from 31 May 2023 low remains intact as it still trades above the 200-day moving average.
- Key support to watch will be at 19,090.
This is a following-up analysis of our earlier publication, “Hang Seng Index Technical: Potential breakout from channel resistance” dated on 9 June 2023 .
The Hong Kong 33 Index (a proxy for the Hang Seng Index futures) has staged the expected bullish breakout and almost met the first resistance of 20,300 as it rallied by +5% from 9 June to an intraday high of 20,205 last Friday, 16 June in light of a shift in the China central bank, PBoC conservative targeted monetary policy stance to a more accommodating approach as it cut 3 key interest rates within two weeks; 7-day reverse repos, 1-year medium-term lending facility, and the 1-year & 5-year loan prime rates today, 20 June that are being used to price corporates/consumer loans and mortgages respectively.
Since Monday, 19 June, the Index has tumbled by -2.4% which seems to have fallen victim to the “buy the rumours, sell on the actual news release” mantra as today’s cut on the loan prime rates have been almost fully priced in.
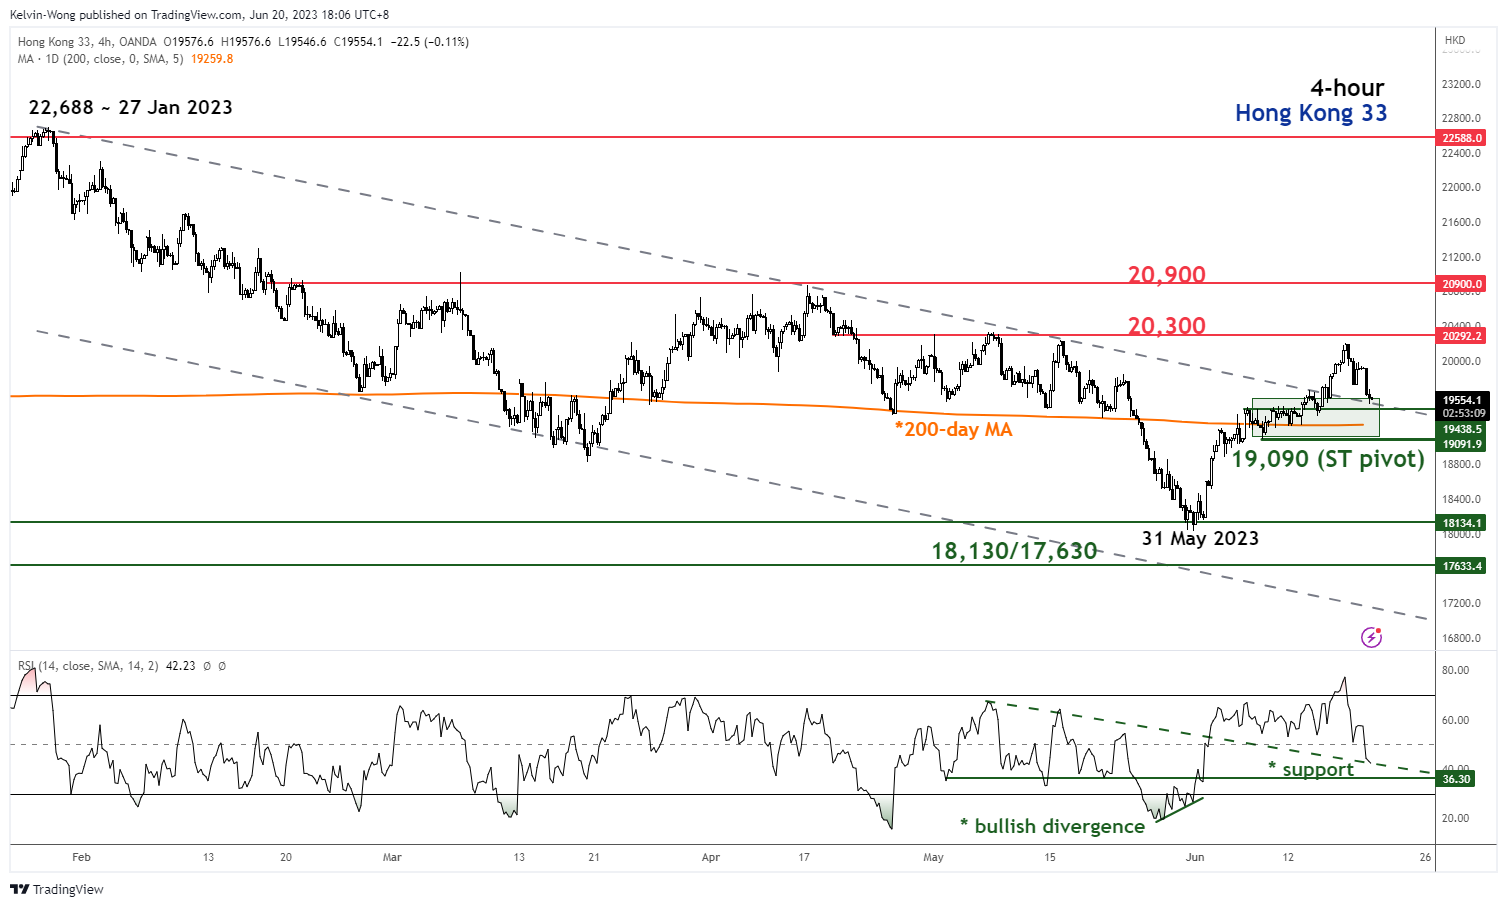
Fig 1: Hong Kong 33 minor short-term trend as of 20 Jun 2023 (Source: TradingView, click to enlarge chart)
The current drop in price actions is now coming close to a key pull-back support area
The Index is now hovering right above the former descending channel resistance and now turns pull-back support at 19,440 and the 200-day moving average coming in as support at around 19,090.
Also, the 19,440/19,090 support area confluences with 38.2% and 50% Fibonacci retracement of the minor short-term uptrend phase from the 31 May 2023 low to the 16 June 2023 high.
The momentum indicator is also at a parallel/corresponding support
The 4-hour RSI oscillator, a momentum indicator has exited from its overbought area, and it has now reached a corresponding support zone of 42%/36% which may lead to a potential positive reversal in price actions.
19.090 key short-term pivotal support to maintain the minor short-term uptrend phase with intermediate resistances coming in at 20,300 and 20,900.
On the other hand, a break below 19,090 negates the bullish tone to expose the 18,130/17,630 key medium-term support.
USD/JPY at the High of the Year
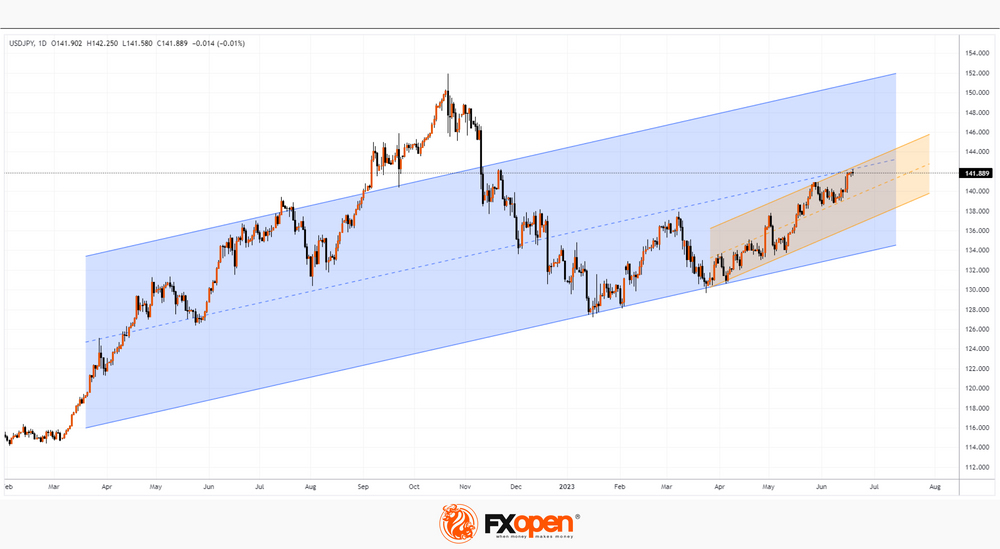
This morning, the Japanese currency weakened to 142.25 yen per US dollar for the first time since November 2022.
This is a consequence of the difference in the monetary policies of the two countries. Last week, the Fed, although it paused in raising the rate, said that it could be raised before the end of the year. On the other hand, the Bank of Japan on Friday maintained its commitment to ultra-soft monetary policy.
The USD/JPY chart shows that the rate is moving within a long-term ascending channel (shown in blue), and today it is near its median line — it can serve as resistance, which can at least slow down the growth of the rate. Or even promote a pullback within the channel shown in yellow.
However, the series of higher lows that has been going on since March 2023 suggests that bulls are dominating the USD/JPY market and may be trying to break the median line.
US Return Could Boost Activity, Focus Remains on BoE and UK Inflation
Stock markets remain slightly in the red on Tuesday but activity should pick up with the return of Wall Street from the long bank holiday weekend.
The focus this week remains on the central banks and whether we are as close to the end of the tightening cycle as everyone wants to believe. While there is the temptation to take what the Fed and others say with a small pinch of salt given their record over the last couple of years and the fact that any pivot was always likely to come late, they have been proven more accurate recently on their assertion that rates need to keep rising.
Markets have been overly optimistic this year and there may be an element of luck on the central bank side - keen to not underestimate inflation again, they were always going to remain hawkish as long as feasibly possible - but the data simply hasn't justified changing course yet.
That may change over the next couple of months but so far, especially in the UK, the turnaround in inflation has been more akin to a container ship performing a U-turn than a speedboat as many hoped. That may not dramatically increase the terminal rate but it may ensure it remains there much longer. Rate cuts this year look more fantasy than reality now.
The BoE will be hoping for some good news from the UK inflation data tomorrow but I'm guessing policymakers are approaching it with a sense of dread rather than hope. We're not likely to see any significant progress from the May data but avoiding another nasty surprise may be viewed as a win, allowing the MPC to proceed with 25 basis points rather than 50 which markets are pricing in a 30% chance of at this stage.
Oil remains choppy but flat and in lower range
Oil prices are relatively flat today, mirroring yesterday's session which was broadly choppy but ultimately directionless. Crude has rebounded strongly since falling toward its 2023 lows early last week but remains in its lower range, roughly between $70-$80 per barrel and it's showing little sign of breaking that in the short term.
While some believe the market will be in deficit later in the year, aided by the Saudi-driven OPEC+ cuts, which could support prices closer to what we saw late last year and early this, the economy remains one significant downside risk to this amid an adjustment in the markets toward higher rates for longer.
Gold drifting as we await more data
Gold has started the week slightly softer but very little has changed, in that it remains in the $1,940-$1,980 range that it has spent the vast majority of the last month. It was a very quiet start to the week which is why gold has basically continued to drift and that may continue until we see a significant change in the data.
The Fed last week made it perfectly clear that it doesn't believe it's done and its commentary this week, including Chair Powell's appearing in Congress on Wednesday, isn't likely to change in any significant way from that. It will be interesting to see if we get any response to UK inflation data as a potential signal of stickiness more broadly but then, there's every chance it could be viewed as a UK issue, rather than an indication of something more, considering how much more the country has struggled until now.
Bitcoin's recent trend remains against it despite recovery
Bitcoin drifted a little higher at the start of the week and is continuing to do so today. The move back toward $25,000 may have worried some but it's recovered relatively well since then. The recent trend remains against it and until it breaks the pattern of lower highs - recovery rallies that fall short of recent peaks before falling again - it will continue to look vulnerable. A break below $25,000 could be another blow although gains this year would still remain extremely healthy.
AUD/USD – Aussie Slides after Dovish RBA Minutes
- RBA minutes state that the rate hike decision was close
- China’s central bank trims key lending rates
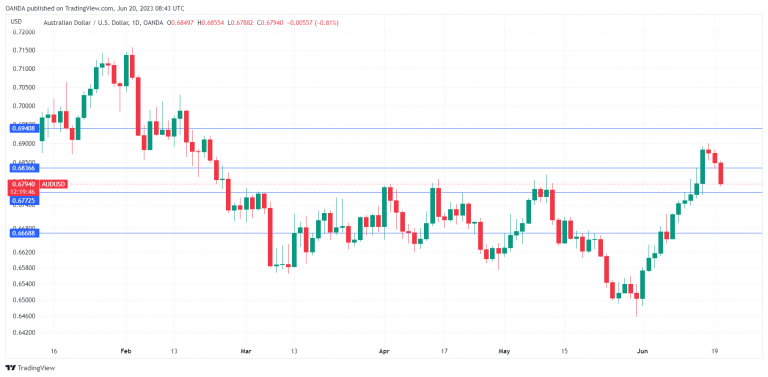
The Australian dollar has hit a bump in the road and is down 1% this week. In the European session, AUD/USD is trading at 0.6795, down 0.80% on the day.
RBA minutes – rate decision was close
The Reserve Bank of Australia has a habit of surprising the markets. The RBA’s rate hike earlier this month was a shocker, as the markets had expected rates to remain unchanged. The minutes of the meeting, released today, indicated that the decision was “finely balanced” between a pause and a hike. In support of a pause, members noted that the sharp increases in rates raised the possibility of the economy stalling. In the end, however, concerns over persistent inflation won the day as the Bank voted to hike rates by 0.25%.
The takeaway from the dovish minutes is that the RBA was very close to taking a pause and will be open to holding rates at the July meeting, depending on the data, especially inflation. The Australian dollar has fallen sharply today as investors have lowered their expectations over future rate hikes.
The RBA has backed up hawkish words with action, raising rates to 4.1%, the highest level since 2011. Still, inflation has been stickier than expected, and headline inflation jumped in April from 6.3% to 6.8%. The core rate fell from 6.9% to 6.5%, but that is incompatible with the target of 2%. The RBA has projected that inflation will not fall to 2% until mid-2025, which means more hikes are likely, barring a sharp drop in inflation.
China’s central bank announced on Tuesday that it was cutting key lending rates, in a move to boost investment and consumption. The post-pandemic recovery has been slow, and soft demand for exports has been bad news for Australia, as China is a key trading partner. China posted 4.5% growth in the first quarter, which was better than expected, but key indicators such as retail spending and industrial output missed expectations in May.
AUD/USD Technical
- 0.6772 is under pressure in support. Below, there is support at 0.6668
- 0.6836 and 0.6940 are the next resistance lines
GBP/JPY Daily Outlook
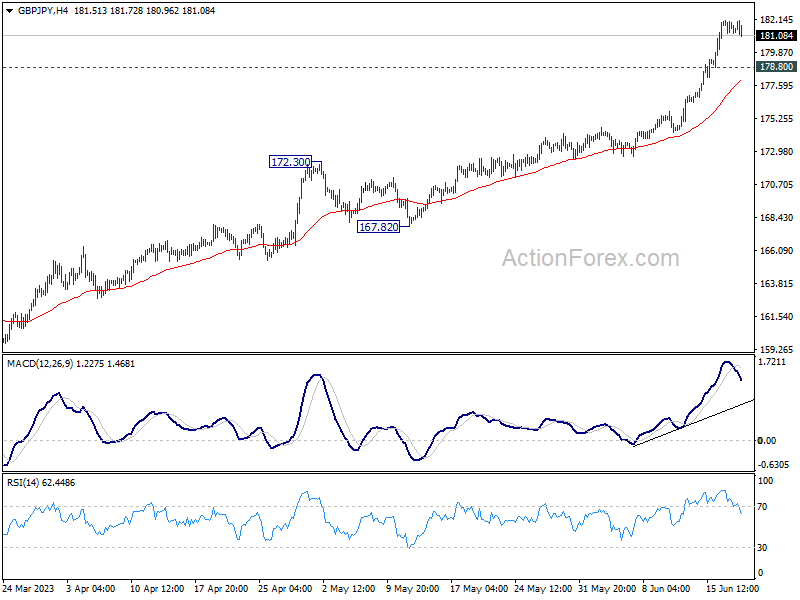
Daily Pivots: (S1) 181.20; (P) 181.68; (R1) 182.13; More...
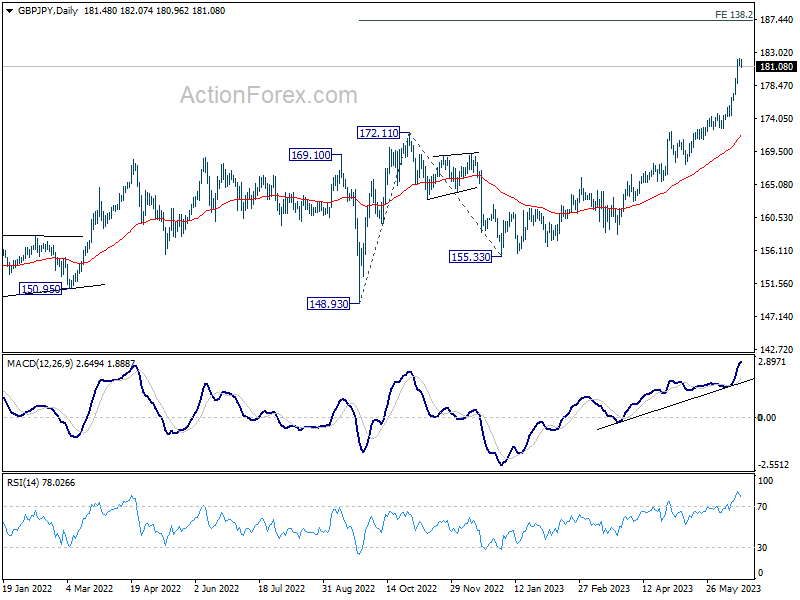
GBP/JPY continues to lose upside momentum as seen in 4H MACD, but there is no clear sign of topping yet. Further rally is expected to 138.2% projection of 148.93 to 172.11 from 155.33 at 187.36. On the downside, below 178.80 minor support will turn intraday bias neutral and bring consolidations first, before staging another rise.
In the bigger picture, up trend from 123.94 (2020 low) is extending. Next target is 195.86 (2015 high). For now, medium term outlook will remain bullish as long as 172.11 resistance turned support holds, even in case of deep pull back.
EUR/JPY Daily Outlook
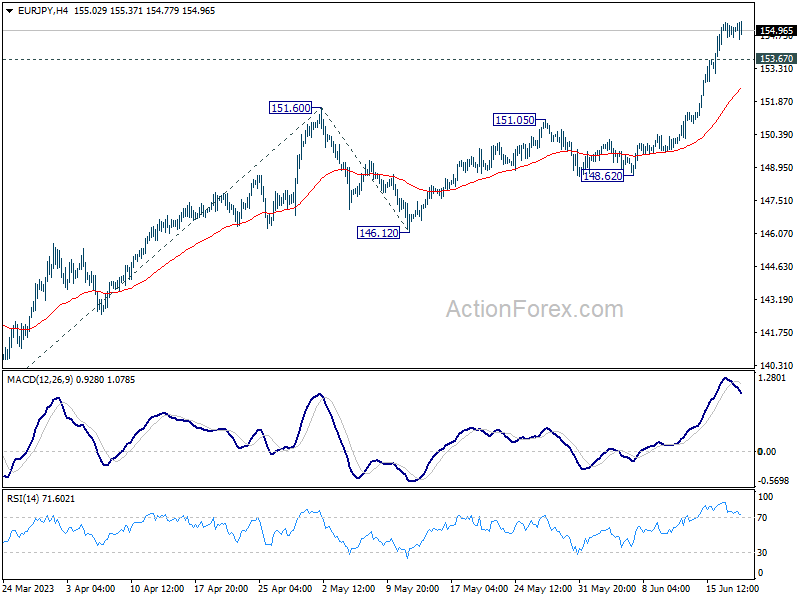
Daily Pivots: (S1) 154.68; (P) 155.05; (R1) 155.44; More....
EUR/JPY continues to lose upside momentum as seen in 4H MACD. But there is not clear sign of topping yet. Further rise is expected to 100% projection of 139.05 to 151.60 from 146.12 at 158.67. On the downside, though, below 153.67 minor support will turn intraday bias neutral and bring consolidations first, before staging another rise rally.
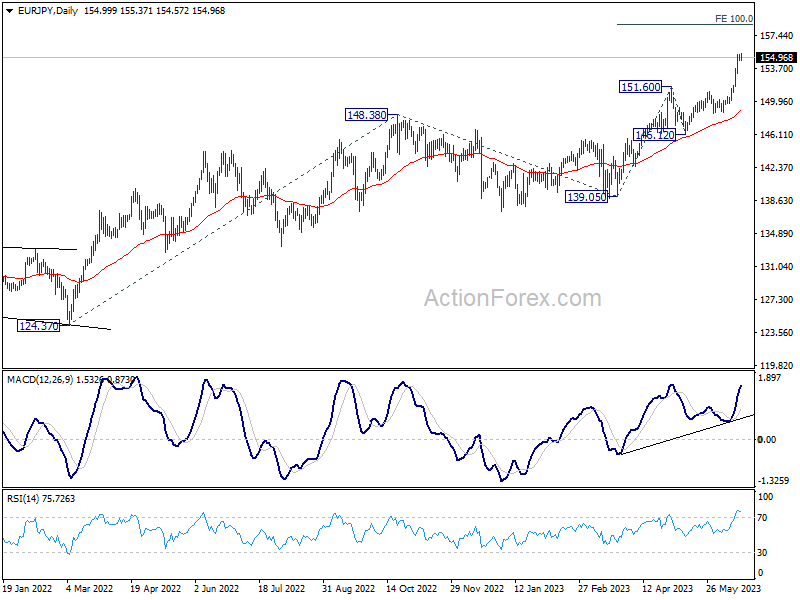
In the bigger picture, rise from 114.42 (2020 low) is in progress. Next target is 100% projection of 124.37 to 148.38 from 138.81 at 162.82. For now, medium term outlook will remain bullish as long as 148.38 resistance turned support holds, even in case of deep pull back.
EUR/GBP Daily Outlook
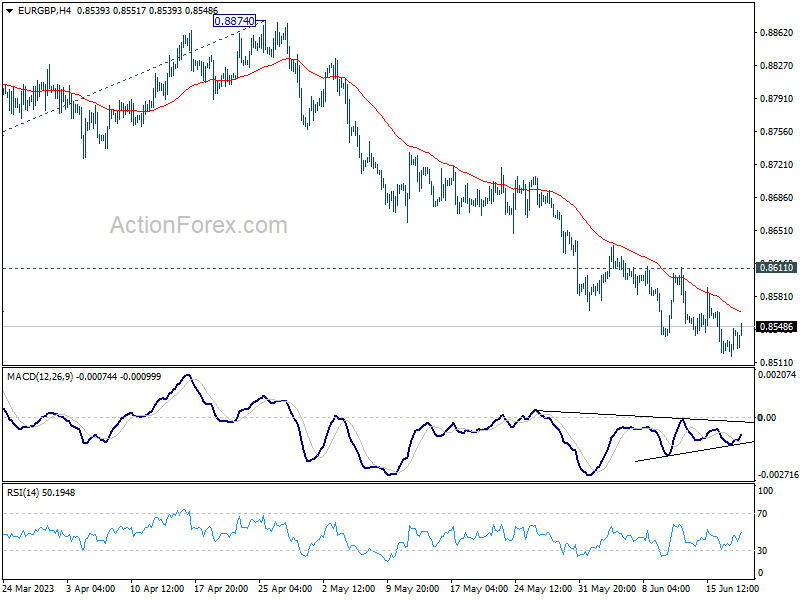
Daily Pivots: (S1) 0.8520; (P) 0.8534; (R1) 0.8550; More...
While EUR/GBP is losing downside momentum as seen in 4H MACD, there is no clear sign of bottoming yet. Further decline is expected as long as 0.8611 resistance holds. Fall from 0.8977 should target 161.8% projection of 0.8977 to 0.8717 from 0.8874 at 0.8453. However, break of 0.8611 resistance will indicate short term bottoming, and turn bias back to the upside for stronger rebound.
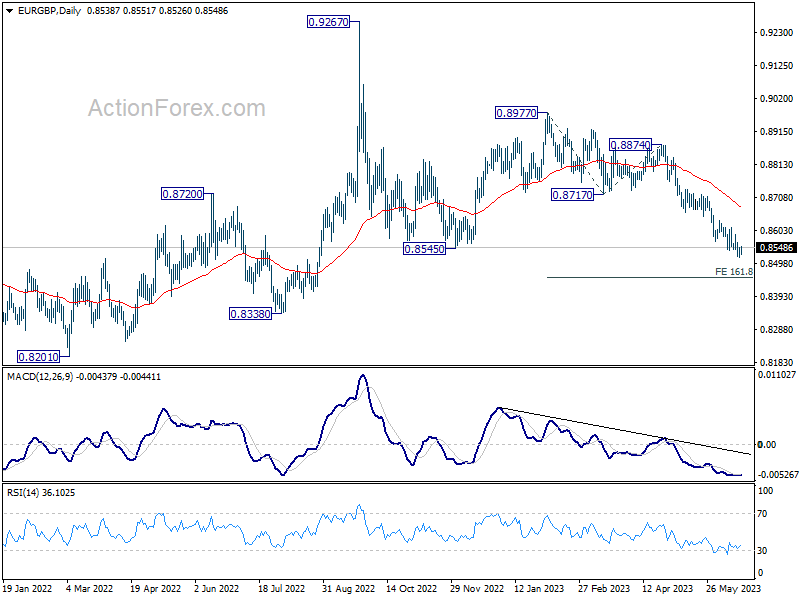
In the bigger picture, the down trend from 0.9267 (2022 high) is still in progress. It's seen as part of the long term range pattern from 0.9499 (2020 high). Deeper fall would be seen towards 0.8201 (2022 low). But strong support should be seen from there to bring reversal. This will now remain the favored case as long as 0.8717 support turned resistance holds.
EUR/AUD Daily Outlook
Daily Pivots: (S1) 1.5883; (P) 1.5943; (R1) 1.6004; More...
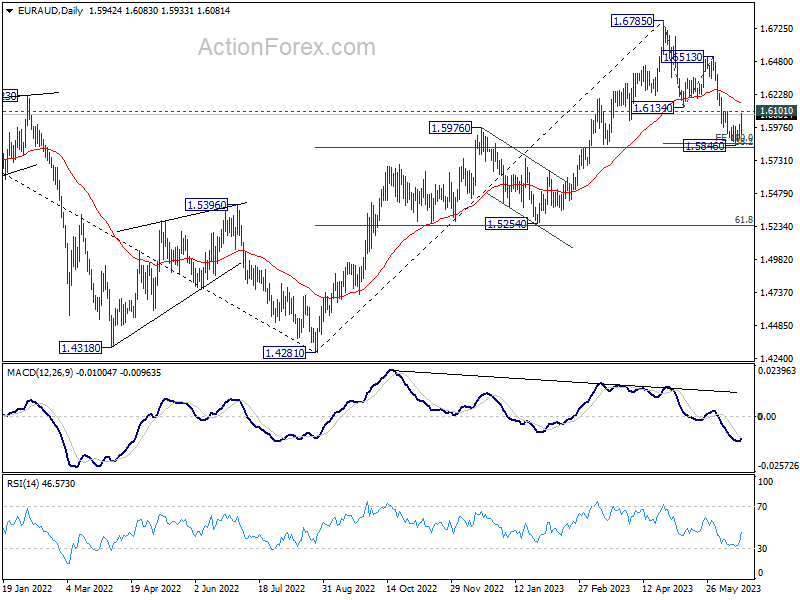
Intraday bias in EUR/AUD remains neutral first, and focus in on 1.6101 support with today's rebound. Decisive break there will confirm short bottoming at 1.5846. Correction from 1.6785 could also have completed with three waves down, after hitting 100% projection of 1.6785 to 1.6134 from 1.6513 at 1.5862. Intraday bias will be turned back to the upside for 1.6513 resistance next.
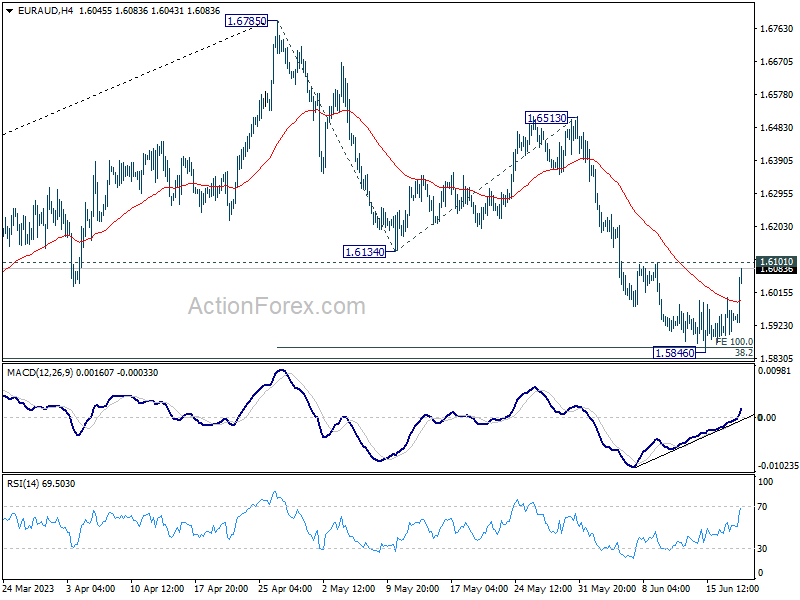
In the bigger picture, price actions from 1.6785 are seen as a correction to up trend from 1.4281 (2022 low) only. Strong support should be seen around 38.2% retracement of 1.4281 to 1.6785 at 1.5828 to complete the first leg and bring rebound. However, sustained trading below 1.5828 will raise the chance of trend reversal and target 61.8% retracement at 1.5238.