Sample Category Title
EUR/CHF Daily Outlook
Daily Pivots: (S1) 0.9765; (P) 0.9783; (R1) 0.9800; More...
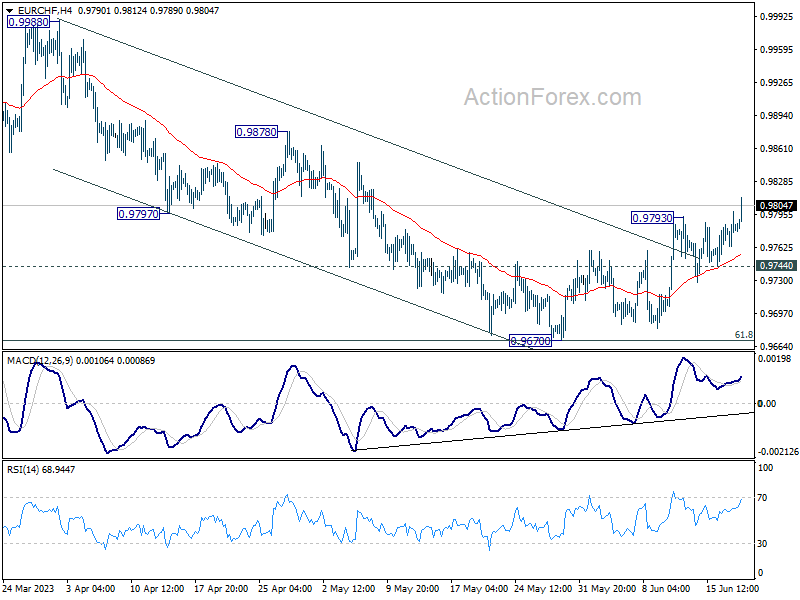
EUIR/CHF's rebound from 0.9670 resumed by breaking through 0.9793 and intraday bias is back on the upside. Sustained trading above 55 D EMA (now at 0.9777) will add to case that whole correction from 1.0095 has completed. Further rise should then be seen to 0.9878 resistance next. On the downside, below 0.9744 minor support will turn intraday bias neutral first.
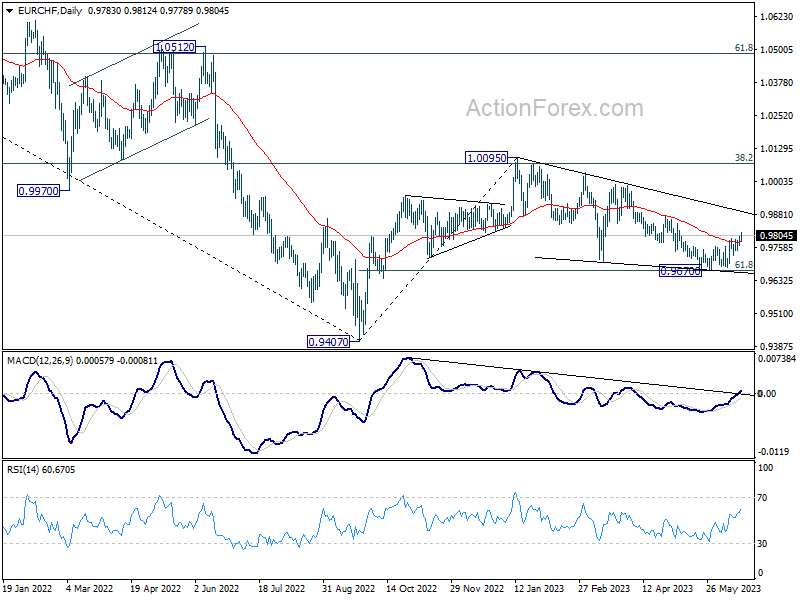
In the bigger picture, prior rejection by 38.2% retracement of 1.1149 to 0.9407 at 1.0072 suggests that medium term outlook is staying bearish. The pair is also capped below 55 W EMA (now at 0.9924). Down trend from 1.2004 (2018 high) is not complete yet and is in favor to resume through 0.9407 at a later stage. However, decisive break of 1.0095 resistance will raise the chance of bullish trend reversal. Rise from 0.9407 should then target 1.0505 cluster resistance (2020 low at 1.0505, 61.8% retracement of 1.1149 to 0.9407 at 1.1484).
Brent Crude Oil Price Sees Slight Decline as Energy Demand Concerns Persist
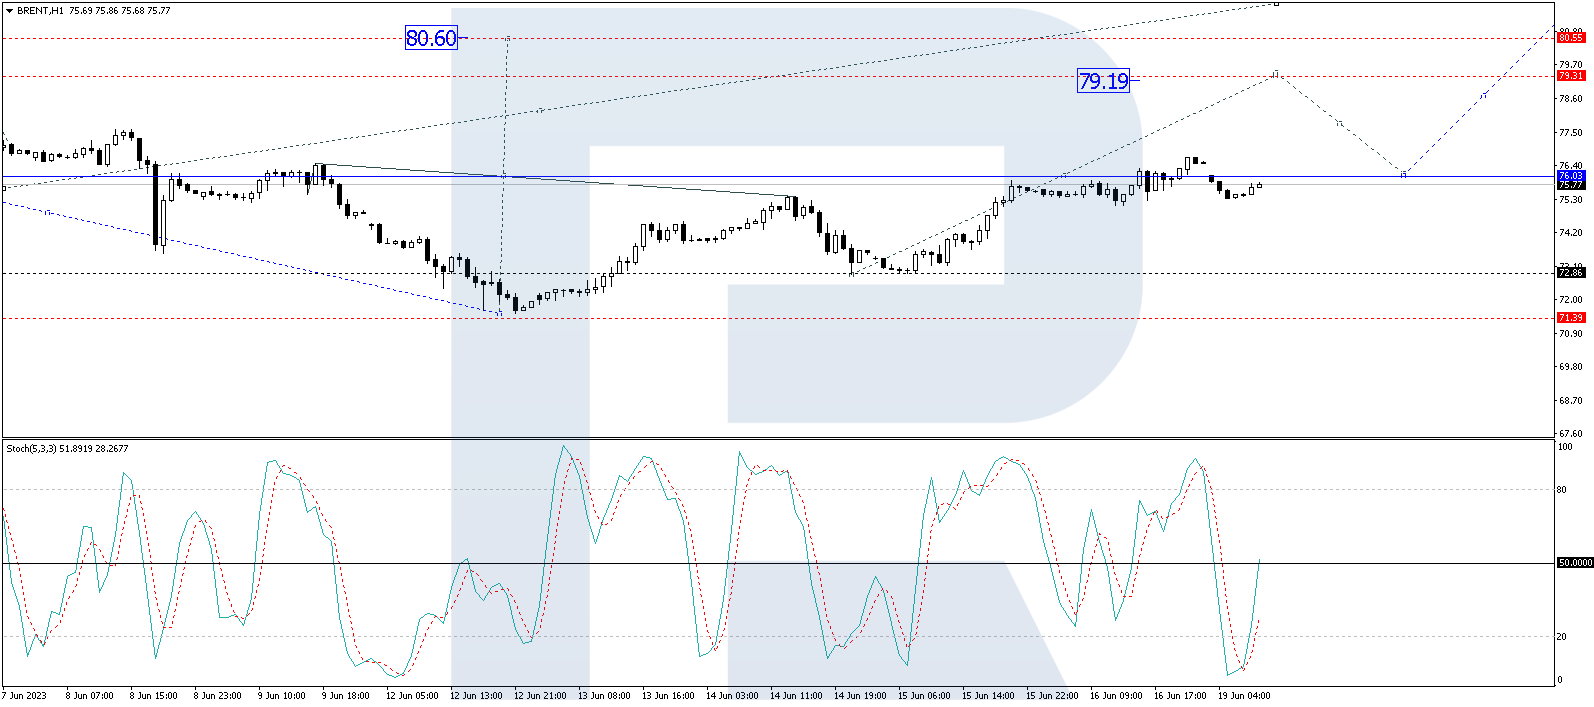
The price of Brent crude oil commenced the new week in June with a marginal decline, reaching $75.70 per barrel.
Investor uncertainty regarding the expansion of energy demand remains a significant factor restricting the potential for price increases in the "black gold" market. There are currently no clear indications from global economies, particularly the United States and China, suggesting a rapid acceleration in GDP growth. Moreover, various pressures on economies, such as disruptions in the supply chain and subdued consumer demand, further contribute to this situation.
It is worth highlighting the weakened position of the US dollar, which provides some local support for oil prices. During periods of US currency depreciation, commodities tend to become more appealing for investment.
Technical Analysis:
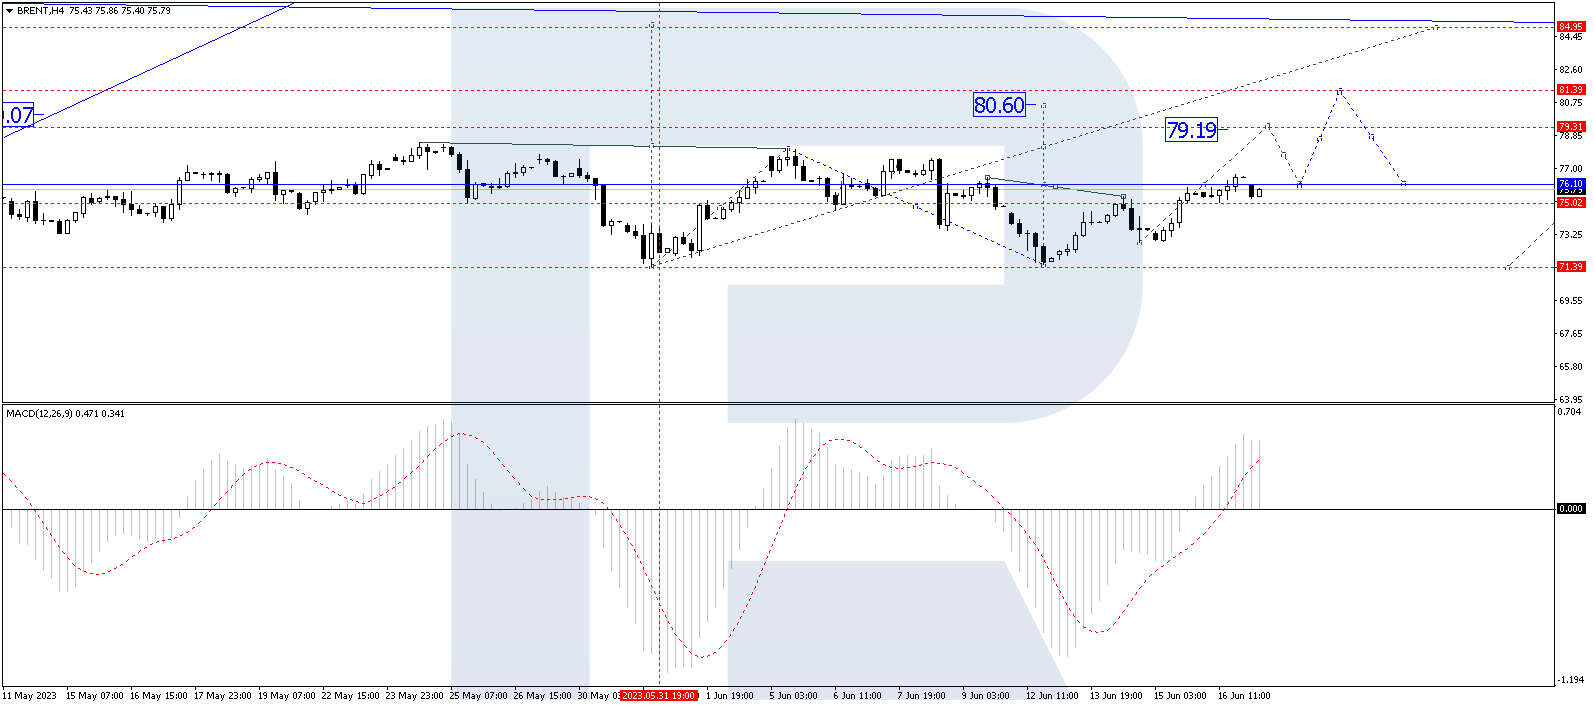
On the H4 timeframe, Brent crude oil appears to be forming the structure of a third upward wave. Currently, it has risen to 76.06, and the market continues to consolidate around this level. There is a possibility of a breakout above this range, leading to the continuation of the third wave towards 79.19. Following the attainment of this level, a corrective pullback to 76.66 cannot be ruled out. Subsequently, there is a potential for further growth towards 80.60. The technical analysis supports this scenario, as the MACD indicator's signal line has recently broken above the zero level, displaying confident growth towards new highs.
On the H1 timeframe, Brent has already formed an upward wave structure, reaching 76.06. The market is presently consolidating around this level, indicating a pattern of a continued upward trend. The projected target for this wave of growth is 79.30. Technical confirmation is provided by the Stochastic oscillator, with its signal line surpassing the level of 50 and exhibiting steady growth towards 80.
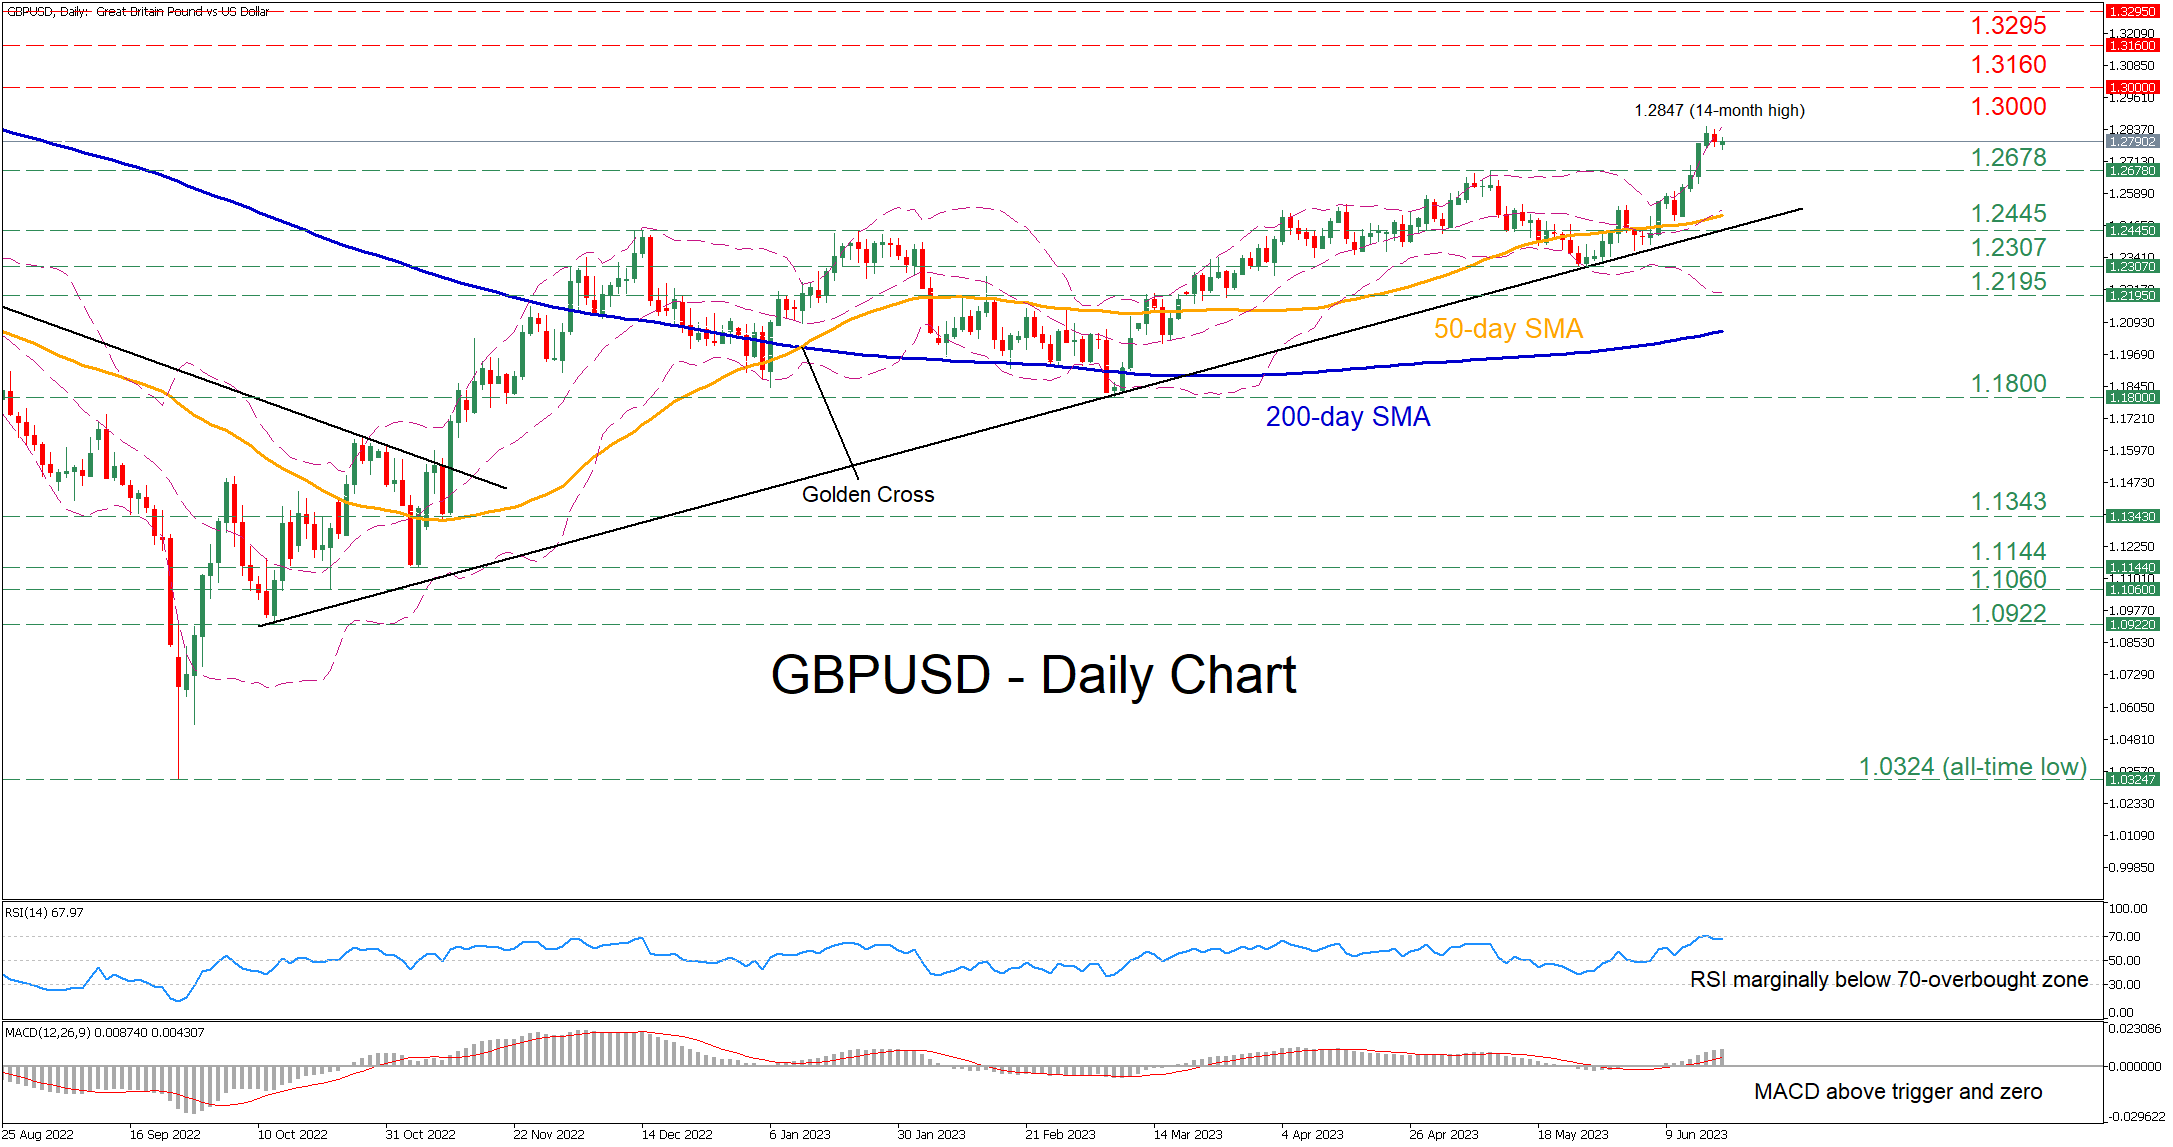
GBPUSD Surges to Fresh 14-Month High
GBPUSD has been in a prolonged uptrend since October 2022 supported by its long-term ascending trendline. Even though the pair stormed to a fresh 14-month high of 1.2847 on Friday, it quickly pared some gains due to reaching overbought conditions.
The momentum indicators currently suggest that bullish forces are holding the upper hand. Specifically, the RSI is hovering slightly below its 70-overbought mark, while the MACD is strengthening above its red signal line in the positive zone.
Should buying pressures intensify and the price jump to fresh multi month highs, immediate resistance could be found at the 1.3000 psychological mark. Surpassing that zone, the pair might ascend towards the March 2022 low of 1.3160, which could serve as resistance in the future. A violation of that territory may set the stage for the March 2022 high of 1.3295.
Alternatively, if the pair reverses lower, the previous high of 1.2678 could act as the first line of defense. Should that floor collapse, the spotlight may turn to 1.2445 before the May low of 1.2307 comes under examination. Further retreats could then cease at 1.2195, which served both as resistance and support in the past months.
Overall, GBPUSD seems to have the necessary momentum to edge higher and extend its structure of higher highs. However, a downside correction should not be ruled out as the pair has approached overbought conditions.
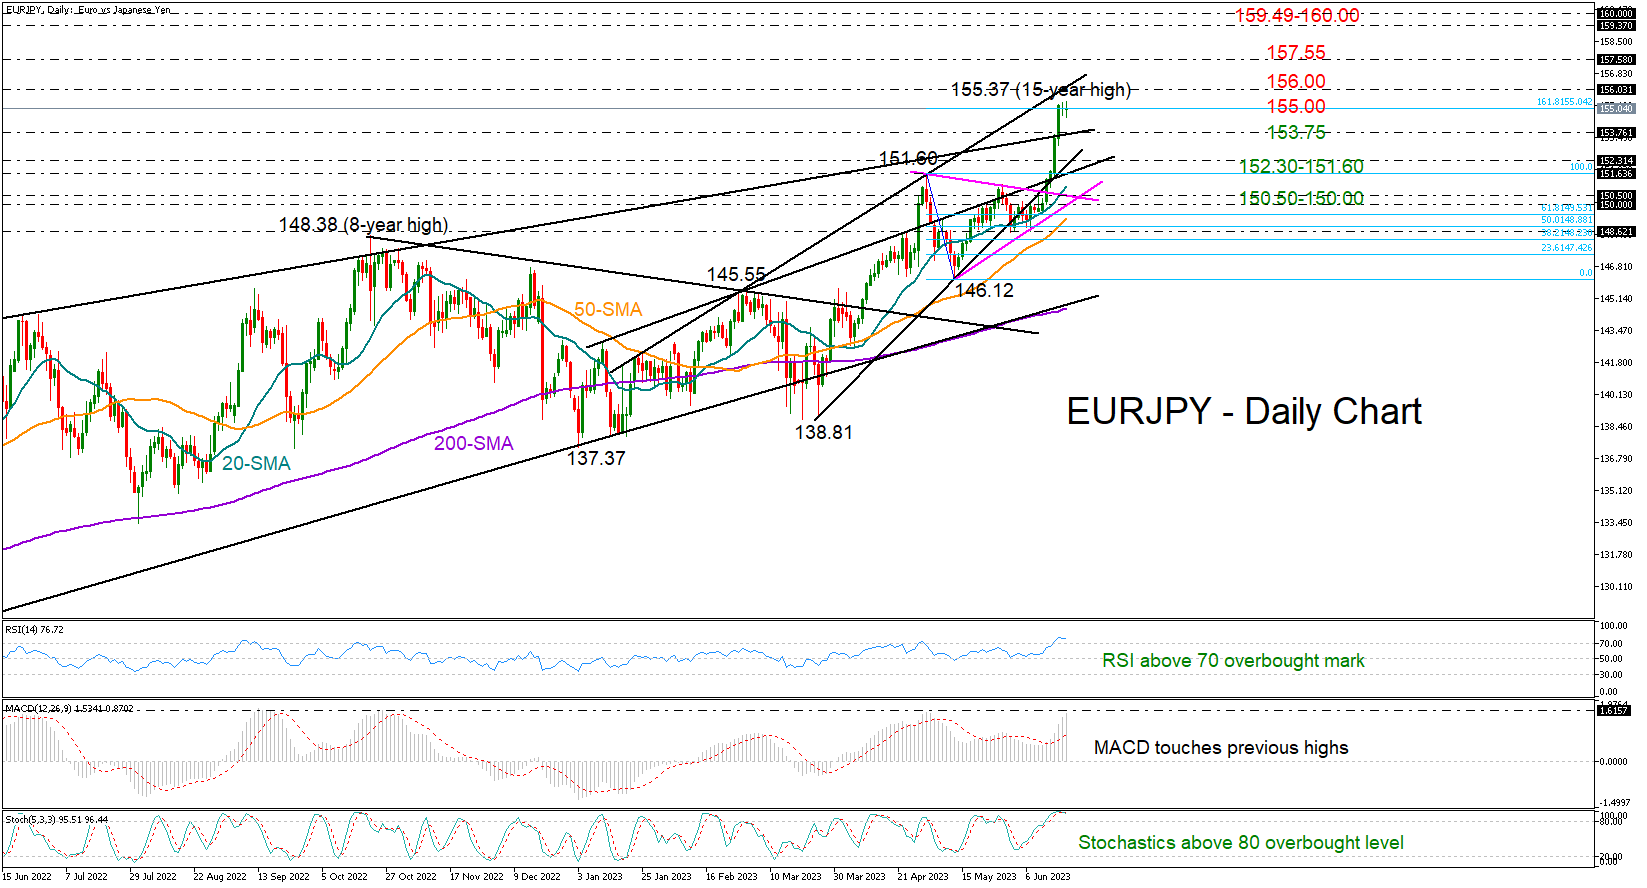
Where Next for EURJPY?
EURJPY experienced a huge week after a bullish triangle breakout, appreciating by more than 3.0% to an almost 15-year high of 155.37 in what was the fastest rally in more than a decade.
The bulls are trying to revive their positive momentum near their recent highs as the RSI and the stochastic oscillator are flagging overbought conditions. Note that the MACD is currently testing a former peak area, raising some caution too.
The nearest obstacle could be around 156.00, where the resistance trendline which connects all the highs from January 18 is positioned. A significant extension higher could lift the price up to the 2007-2008 constraining zone of 159.40-160.00, unless the 157.55 barrier cools upside pressures beforehand.
In the case the price stalls around the 161.8% Fibonacci extension of the 151.60-146.12 downfall at 155.00, the focus will turn to the broken long-term ascending line from August 2020 at 153.75. Failure to pivot there might provoke a quick downfall into the 152.30-151.60 area, where April's ascent topped. The 20-day simple moving average (SMA) is converging to the same region, while slightly lower, the pair may look for support within the 150.50- 150.00 territory before the 50-day SMA comes under examination.
All in all, the latest spike in EURJPY could motivate some profit-taking, especially if the pair proves unable to claim the 155.00-156.00 zone.
Markets Slip Ahead of Powell’s Testimony
Asian markets flashed red on Tuesday, following the disappointing stimulus from Chinese banks.
A sense of discontent lingered across Asia this morning amid the lack of fresh stimulus from Beijing and smaller than expected cut in China’s key lending benchmarks. European futures are pointing to a negative open with investors adopting a guarded approach ahead of key risk events. In the currency space, the dollar is creeping higher amid the risk-off sentiment while gold remains trapped within a range.
US markets were closed on Monday for the Juneteenth holiday so volumes were lacklustre, but this could be another volatile week for global financial markets. All eyes will be on Fed Chair Jerome Powell’s semi-annual report to Congress, Fed speeches, and the Bank of England meeting among other key events.
Focus on Jerome Powell testimony
Fed Chair Jerome Powell will be under the spotlight this week as he provides his semi-annual monetary policy report to Congress on Wednesday and Thursday.
Powell is widely expected to repeat comments from his post-Fed meeting press conference, which had a hint of caution but still opened the door to higher rates down the road. As things stand, the latest dot plot indicates two more 25-basis point rate hikes in the coming months. Investors will be closely watching the testimony for any fresh clues on the timing of the rate increases. Should Powell strike a hawkish note, this could boost the dollar. Alternatively, if he is more downbeat and fails to provide fresh clues, this may weaken the dollar. It may also be worth keeping a close eye on speeches from Federal Reserve Bank of St. Louis President James Bullard and New York President John Williams on Tuesday which could offer additional insight ahead of Powell’s testimony.
Commodity spotlight – Gold
Gold remains trapped within a range on the daily charts with support at $1932 and resistance at $1985. The precious metal needs a fresh fundamental spark to breakout of its current range, and this could come in the form of Powell’s testimony, Fed official’s speeches, or US economic data. Gold bulls could push prices beyond the $1985 resistance on growing expectations around the Fed’s hiking campaign coming to an end. This may be fuelled by cautious remarks from Powell or Fed officials. Alternatively, prices may sink below $1932 if a hawkish Powell boosts the dollar and fuels expectations around US rates remaining higher for longer.
USD/JPY: The Pair is Expected to Depreciate in a New Trend
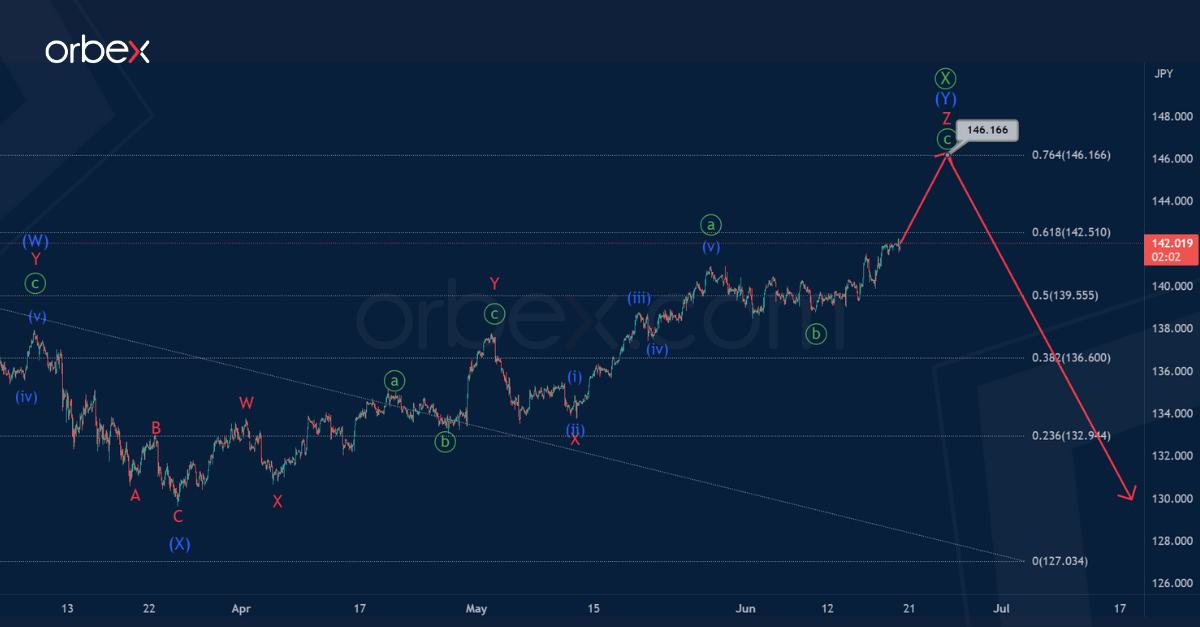
The USDJPY currency seems to be forming a bearish trend. Most likely, the trend takes the form of a double zigzag Ⓦ-Ⓧ-Ⓨ, within which the sub-waves Ⓦ-Ⓧ are completed.
The wave Ⓧ is a double zigzag consisting of intermediate sub-waves (W)-(X)-(Y).
At the moment, the market may be at the very beginning of the primary wave Ⓨ. Probably, this wave will have a standard zigzag shape (A)-(B)-(C).
The end of the first impulse sub-wave (A) is possible near the minimum of 129.64.
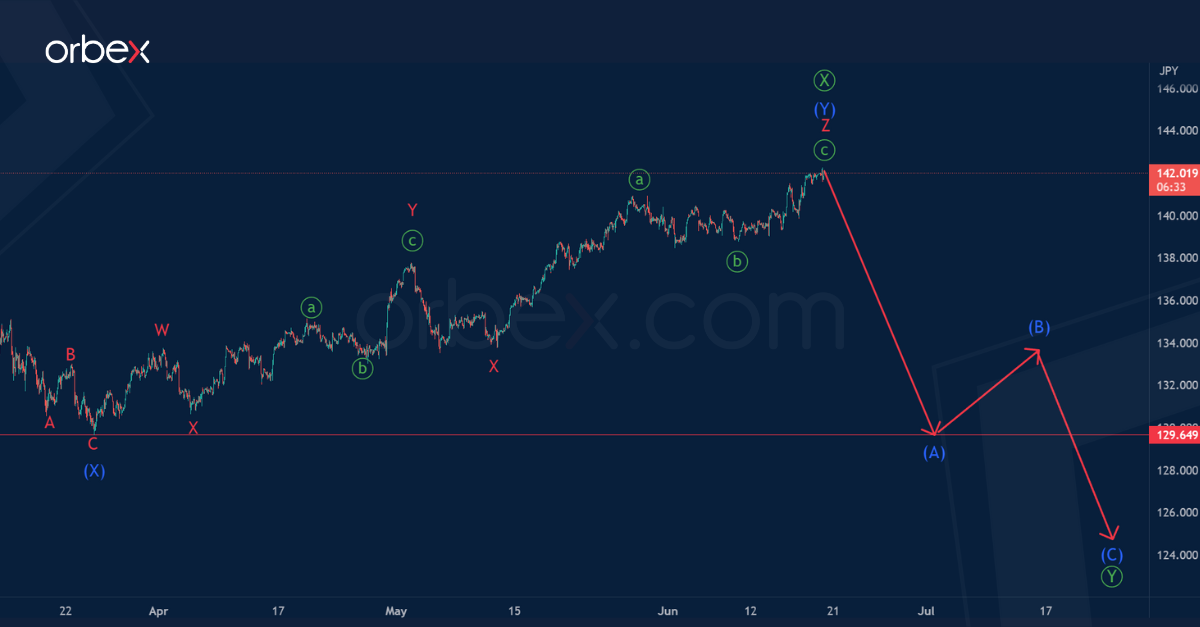
However, in an alternative scenario, the wave Ⓧ continues to build.
In waves Ⓧ, we see completed intermediate sub-waves (W) and (X).
Most likely, the final actionary wave (Y) is being constructed on the last section of the chart, the internal structure of which hints at a triple zigzag W-X-Y-X-Z.
We expect a bullish movement towards 146.16, where the primary wave Ⓧ will be at 76.4% of wave Ⓦ.
EUR Hits Resistance
EUR/USD sees limited pullback
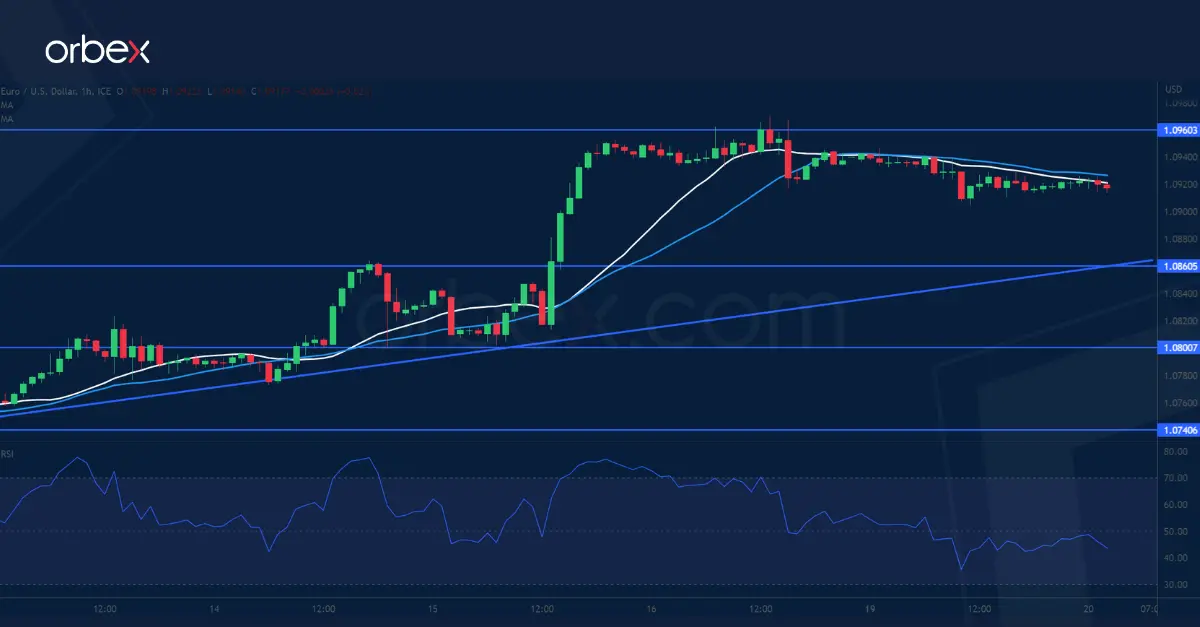
The euro retreated after the ECB's chief economist tempered expectations of more hikes after the summer. The pair is grinding the support-turned-resistance of 1.0960 from the start of the mid-May sell-off. The RSI’s repeatedly overbought condition may temper the bullish drive and prompt buyers to take some chips off the table. Mean reversion would send the euro to 1.0860 over the rising trend line where follow-up interest could be expected. A successful bounce and a close above 1.0960 would expose this year’s peak of 1.1090.
NZD/USD tests key supply area
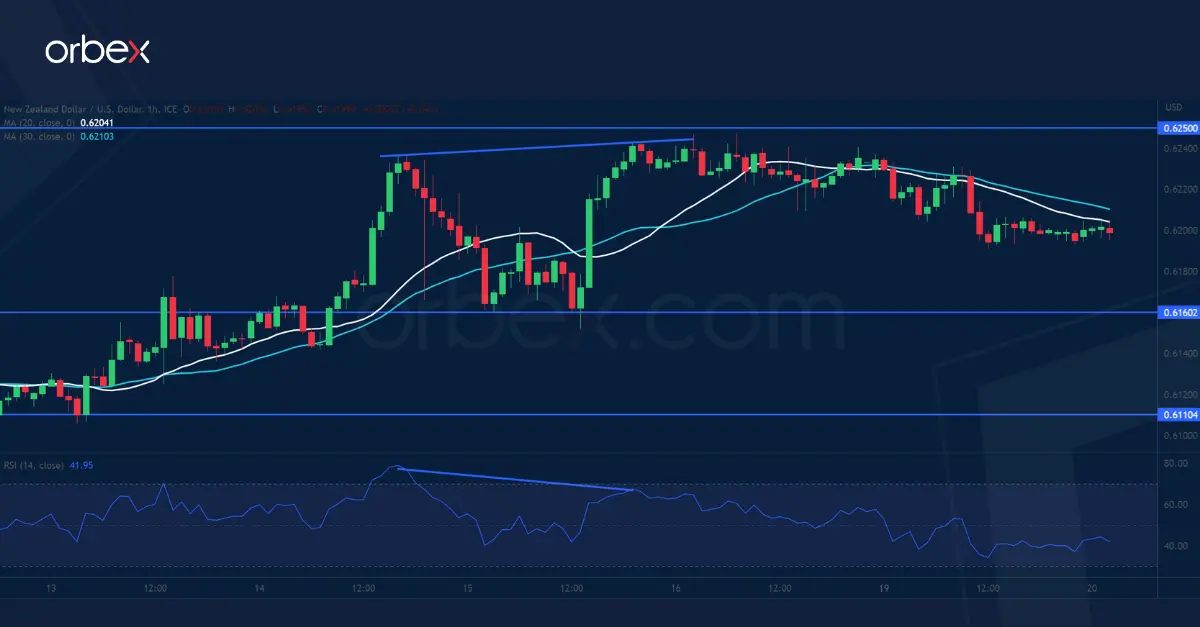
The New Zealand dollar slips over a cautious mood amid thin liquidity early this week. The price is at a crossroads as it grinds the supply zone 0.6250-0.6300. A bearish RSI divergence shows a loss of momentum as the bulls take profit. Still, a series of higher lows is a sign of a strong bullish pressure building up over the past two weeks and a decisive break above 0.6250 would force the remaining sellers out and open the door to the major daily resistance of 0.6380. 0.6160 is the closest support to assess buyers’ commitment.
Dow Jones 30 probes support
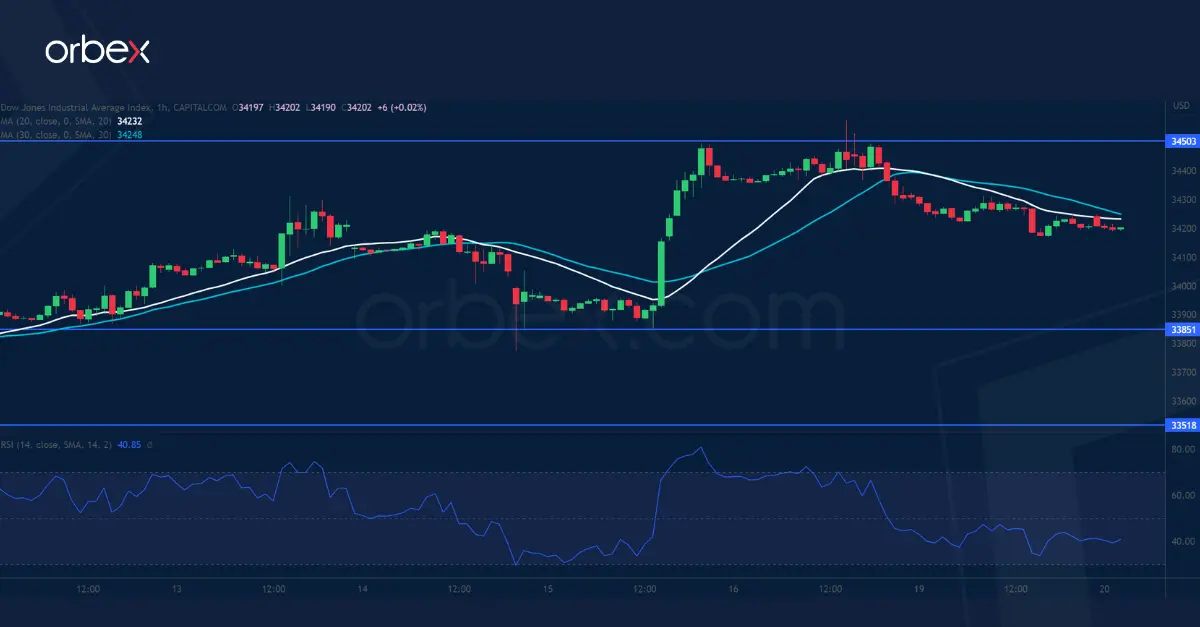
The Dow Jones 30 steadies as the market remains hopeful of a Fed pivot. A close above the daily resistance of 34300 after a botched attempt has helped the bulls regain control of the direction, with a bullish MA cross on the daily chart supporting the recovery in market sentiment. A close above 34500 would bring the index to the new supply area between last December’s spike at 34900 and the psychological level of 35000. The recent dip at 33850 is the first support and 33500 on the 20-day SMA the bulls’ second layer of defence.
EUR/USD Daily Outlook
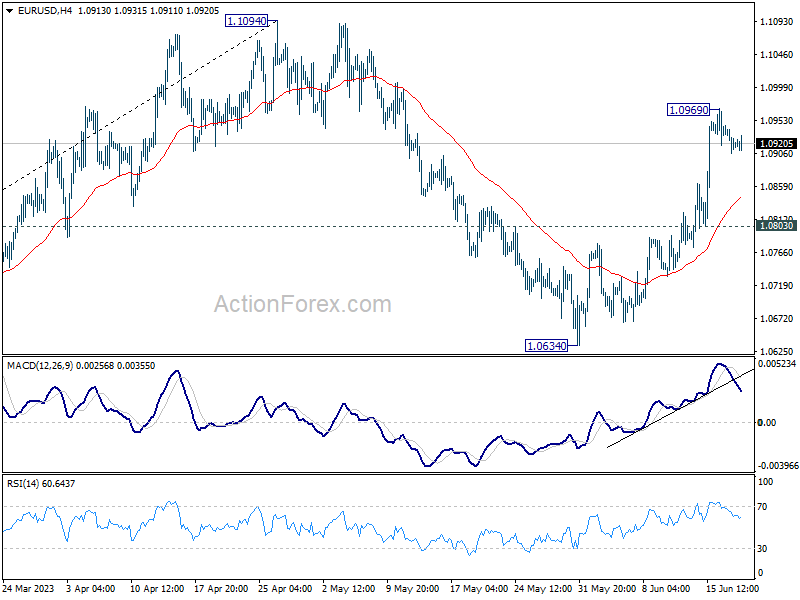
Daily Pivots: (S1) 1.0903; (P) 1.0925; (R1) 1.0942; More...
Intraday bias in EUR/USD remains neutral for consolidation below 1.0969 temporary top. Further rally is expected as long as 1.0803 support holds. On the upside, above 1.0969 will resume the rise from 1.0634 to retest 1.1094 high. Decisive break there will confirm resumption of whole up trend from 0.9534. However, firm break of 1.0803 will extend the corrective pattern from 1.1094 with another falling leg, targeting 1.0634 and below.
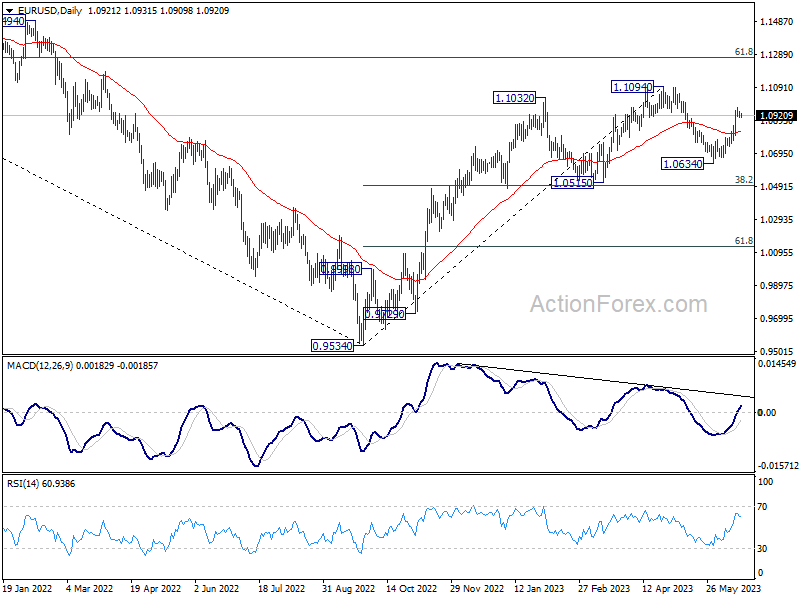
In the bigger picture, as long as 1.0515 support holds, rise from 0.9534 (2022 low) would still extend higher. Sustained break of 61.8% retracement of 1.2348 (2021 high) to 0.9534 at 1.1273 will solidify the case of bullish trend reversal and target 1.2348 resistance next (2021 high).
GBP/USD Daily Outlook
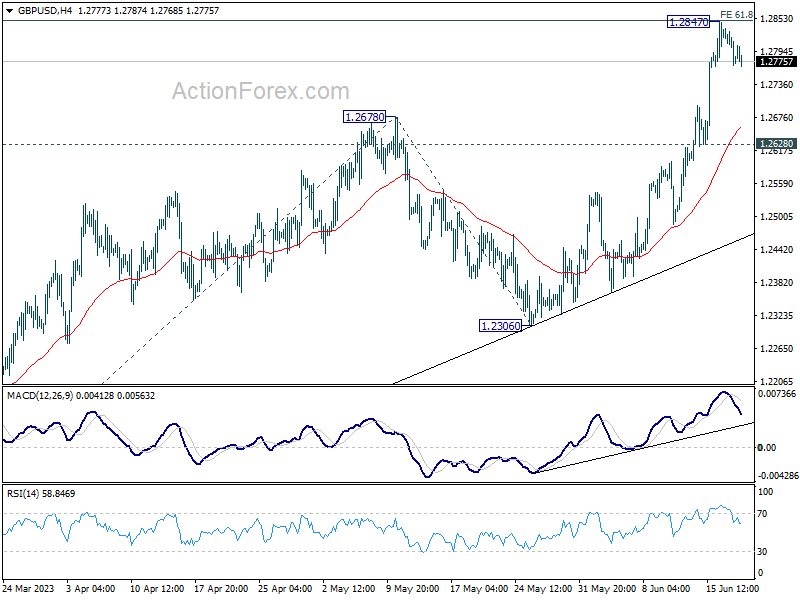
Daily Pivots: (S1) 1.2764; (P) 1.2801; (R1) 1.2830; More...
Intraday bias in GBP/USD stays neutral for consolidation below 1.2847 temporary top. Downside should be contained above 1.2628 support to bring rise resumption. On the upside, firm break of 1.2847 will resume larger up trend and target 100% projection of 1.1801 to 1.2678 from 1.2306 at 1.3183 next.
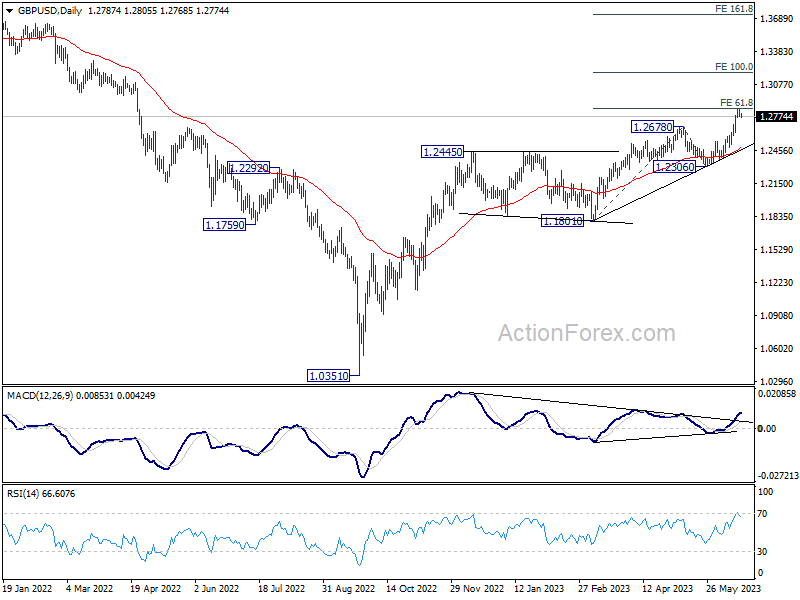
In the bigger picture, the strong support from 55 W EMA (now at 1.2345) is a medium term bullish sign. Outlook will stay bullish as long as 1.2306 support holds. Rise from 1.0351 medium term bottom (2022 low) is expected to extend further to retest 1.4248 key resistance (2021 high).
USD/CHF Daily Outlook
Daily Pivots: (S1) 0.8934; (P) 0.8954; (R1) 0.8978; More...
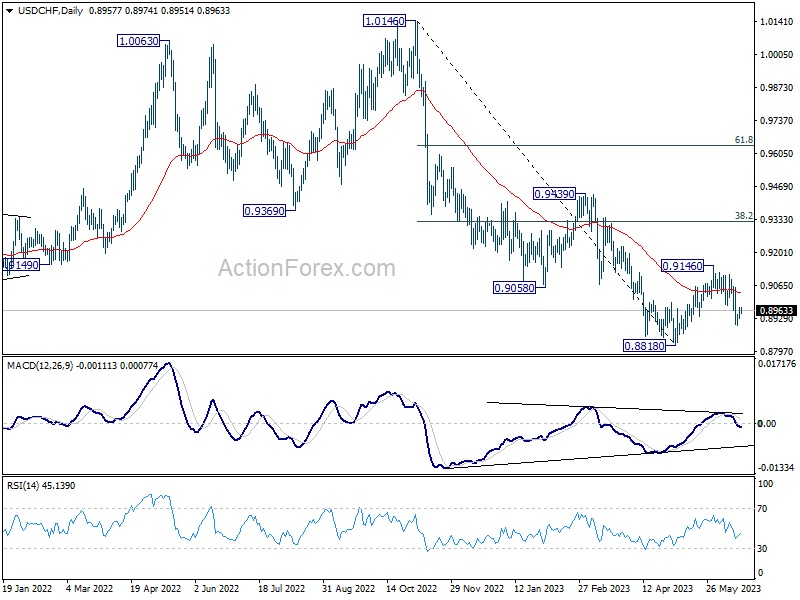
Intraday bias in USD/CHF remains neutral for consolidation above 0.8900 temporary low. Risk will stay on the downside as long as 0.9146 resistance holds. Below 0.8900 will target 0.8818 and possibly below. But strong support is still expected from 0.8756 to bring reversal.
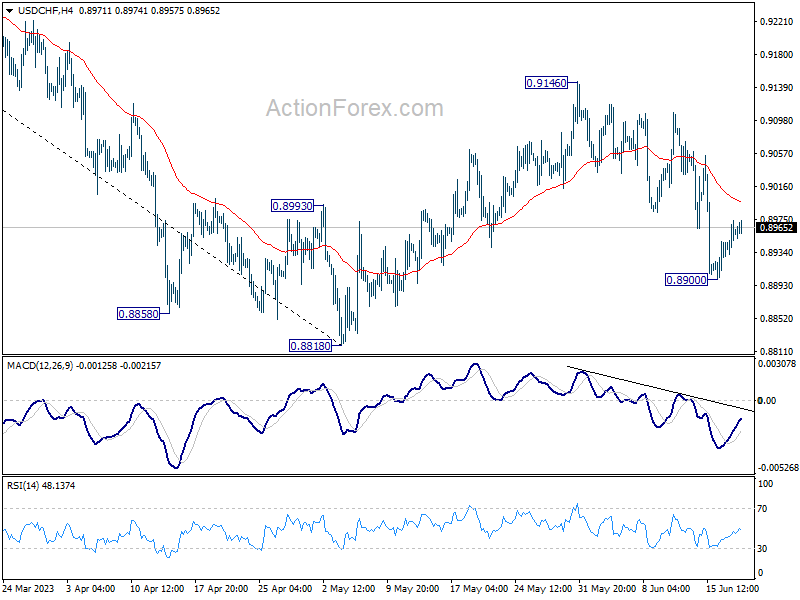
In the bigger picture, fall from 1.1046 (2022 high) is seen as a leg in the long term range pattern from 1.0342 (2016 high), which might have completed at 0.8818 already, just ahead of 0.8756 long term support. Sustained trading above 0.9058 support turned resistance should confirm medium term bottoming.