Sample Category Title
Bitcoin Price Rallies After Crucial Bullish Breakout
Key Highlights
- Bitcoin price is gaining pace above $27,500.
- BTC broke a major bearish trend line with resistance at $25,900 on the 4-hour chart.
- EUR/USD is consolidating gains above the 1.0880 support.
- The UK Consumer Price Index could decline from 8.7% to 8.4% in May 2023 (YoY).
Bitcoin Price Technical Analysis
Bitcoin price started a recovery wave from the $24,750 zone. BTC/USD climbed higher above the $26,500 and $27,000 resistance levels.
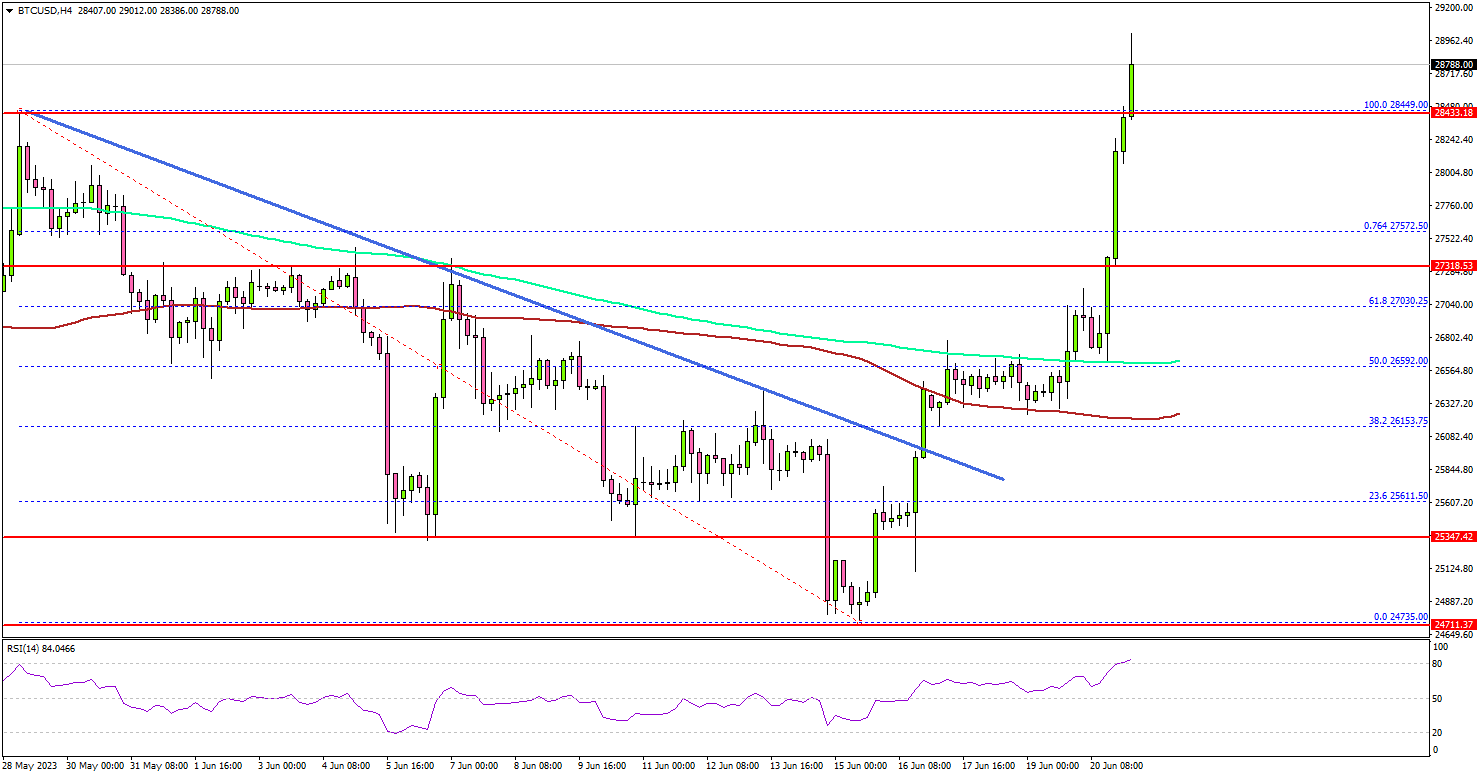
Looking at the 4-hour chart, the price was able to surpass the $26,500 resistance zone and a major bearish trend line with resistance at $25,900.
There was a clear move above the 61.8% Fib retracement level of the downward move from the $28,449 swing high to the $24,735 low. It is now trading above the 100 simple moving average (red, 4 hours) and the 200 simple moving average (green, 4 hours).
On the upside, the price is facing resistance near the $29,000 level. The first major resistance is near the $29,200 level (a multi-touch zone).
A successful close above the $29,200 level might spark another bullish wave. In the stated case, the price may perhaps rise toward the $30,000 level.
If not, Bitcoin might decline again and trade below the $27,500 support. The next major support is near the $27,200 level. If there is a downside break and a close below $27,200, Bitcoin might revisit the $26,000 zone in the coming days.
Economic Releases
- UK Consumer Price Index for May 2023 (YoY) – Forecast +8.4%, versus +8.7% previous.
- UK Core Consumer Price Index for May 2023 (YoY) – Forecast +6.8%, versus +6.8% previous.
- Federal Reserve Chair Jerome Powell testifies before Congress.
AUDJPY Wave Analysis
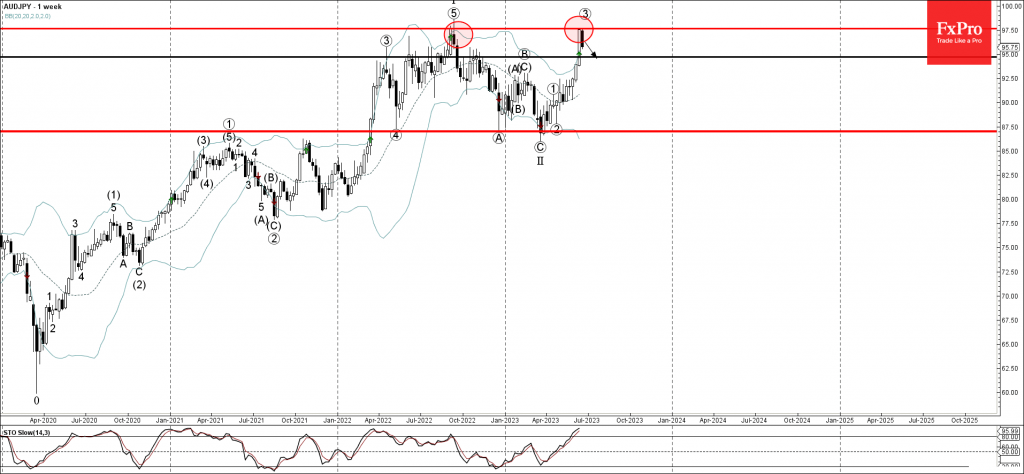
- AUDJPY reversed from resistance level 97.50
- Likely to fall to support level 95.00
AUDJPY currency pair recently reversed down from the resistance level 97.50, which stopped the weekly uptrend in the middle of last year.
The downward reversal from the resistance level 97.50 stopped the previous weekly upward impulse sequence from March .
Given the strength of the resistance level 97.50 and the overbought weekly Stochastic, AUDJPY can be expected to correct down further to the next string support level 95.00.
GBPAUD Wave Analysis
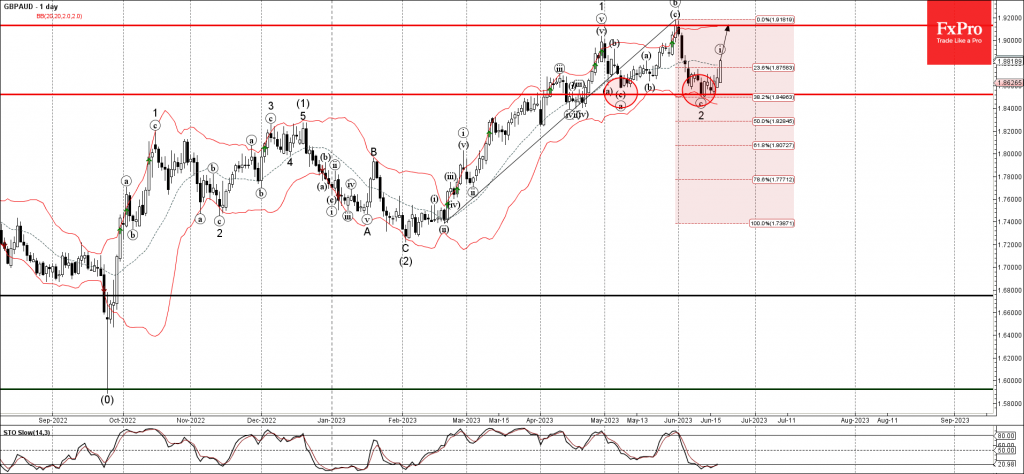
- GBPAUD rising inside impulse wave 3
- Likely to reach resistance level 1.9130
GBPAUD currency pair continues to rise inside the minor impulse wave 3, which started earlier with the daily Bullish Engulfing from the support level 1.8525.
The active minor impulse wave 3 belongs to the intermediate impulse sequence (3) from February.
Given the prevailing uptrend, GBPAUD can be expected to rise further toward the next resistance level 1.9130 (which stopped the previous impulse wave (c) at the end of last month).
SNB to Raise Rates, But Will It Be Enough to Lift the Franc?
The Swiss National Bank (SNB) is widely expected to raise interest rates at 07:30 GMT Thursday, although markets are divided about the size of the move. With inflation grinding lower, the risks seem tilted towards a smaller rate increase that could briefly hurt the Swiss franc, although its overall path will also depend on global risk appetite and FX interventions.
Inflation cools
Switzerland's economy has been flashing some encouraging signals lately. Economic growth was surprisingly strong in the first quarter of the year, the unemployment rate is near its lowest levels in two decades, and inflation has been falling steadily to reach just 2.2% in May.
The SNB aims to keep inflation positive but below 2%, so it would seem the mission has almost been accomplished. Nonetheless, the latest comments from SNB officials suggest otherwise. Speaking last week, Chairman Thomas Jordan stressed that more rate increases might be required to tackle 'stubborn' inflation.
One concern is that inflation could heat up again later this year, as rent prices play catch-up with previous increases in house prices. Another risk is that the longer inflation remains above 2%, the more likely that the inflationary mindset becomes entrenched in consumer and business decisions.
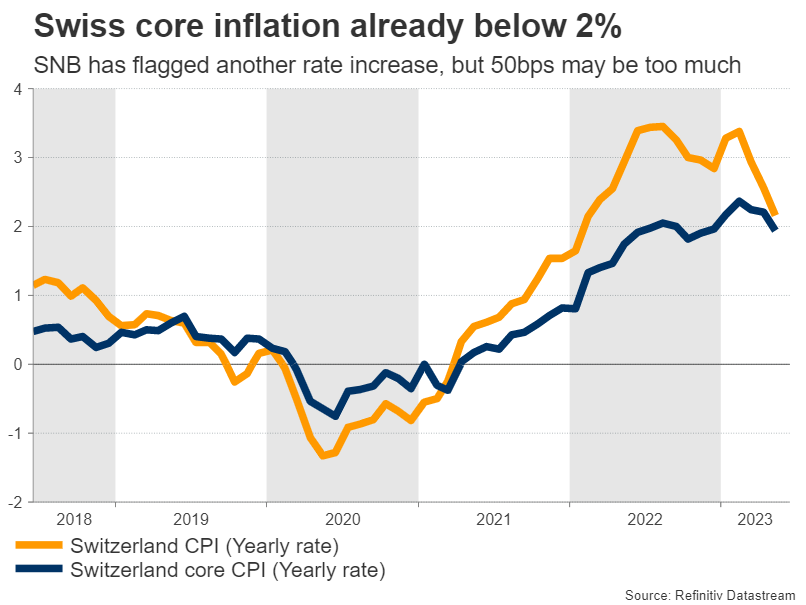
By raising rates further, the SNB can address these threats and equip itself with more 'ammunition' to fight the next downturn, as it would have more scope to cut rates and help the economy if it runs into trouble.
Single or double move?
The problem is that raising rates too much can also inflict damage on economic growth, making it a double-edged sword. There are already signs that economic momentum has started to slow as Switzerland's manufacturing sector is in contraction, and the Credit Suisse episode certainly did not help.
Hence, markets are split on the size of the upcoming rate hike, pricing in a 60% probability for a 50bps rate increase and a 40% chance for a smaller 25bps move. Since the SNB gathers only four times per year, there's a sense it might 'frontload' the rate increases and deliver a larger move.
It's a close call, but considering the progress on inflation lately, it seems more prudent from a risk-management perspective for the SNB to go for the smaller hike of 25bps, especially following a similar downshift from the European Central Bank last week.
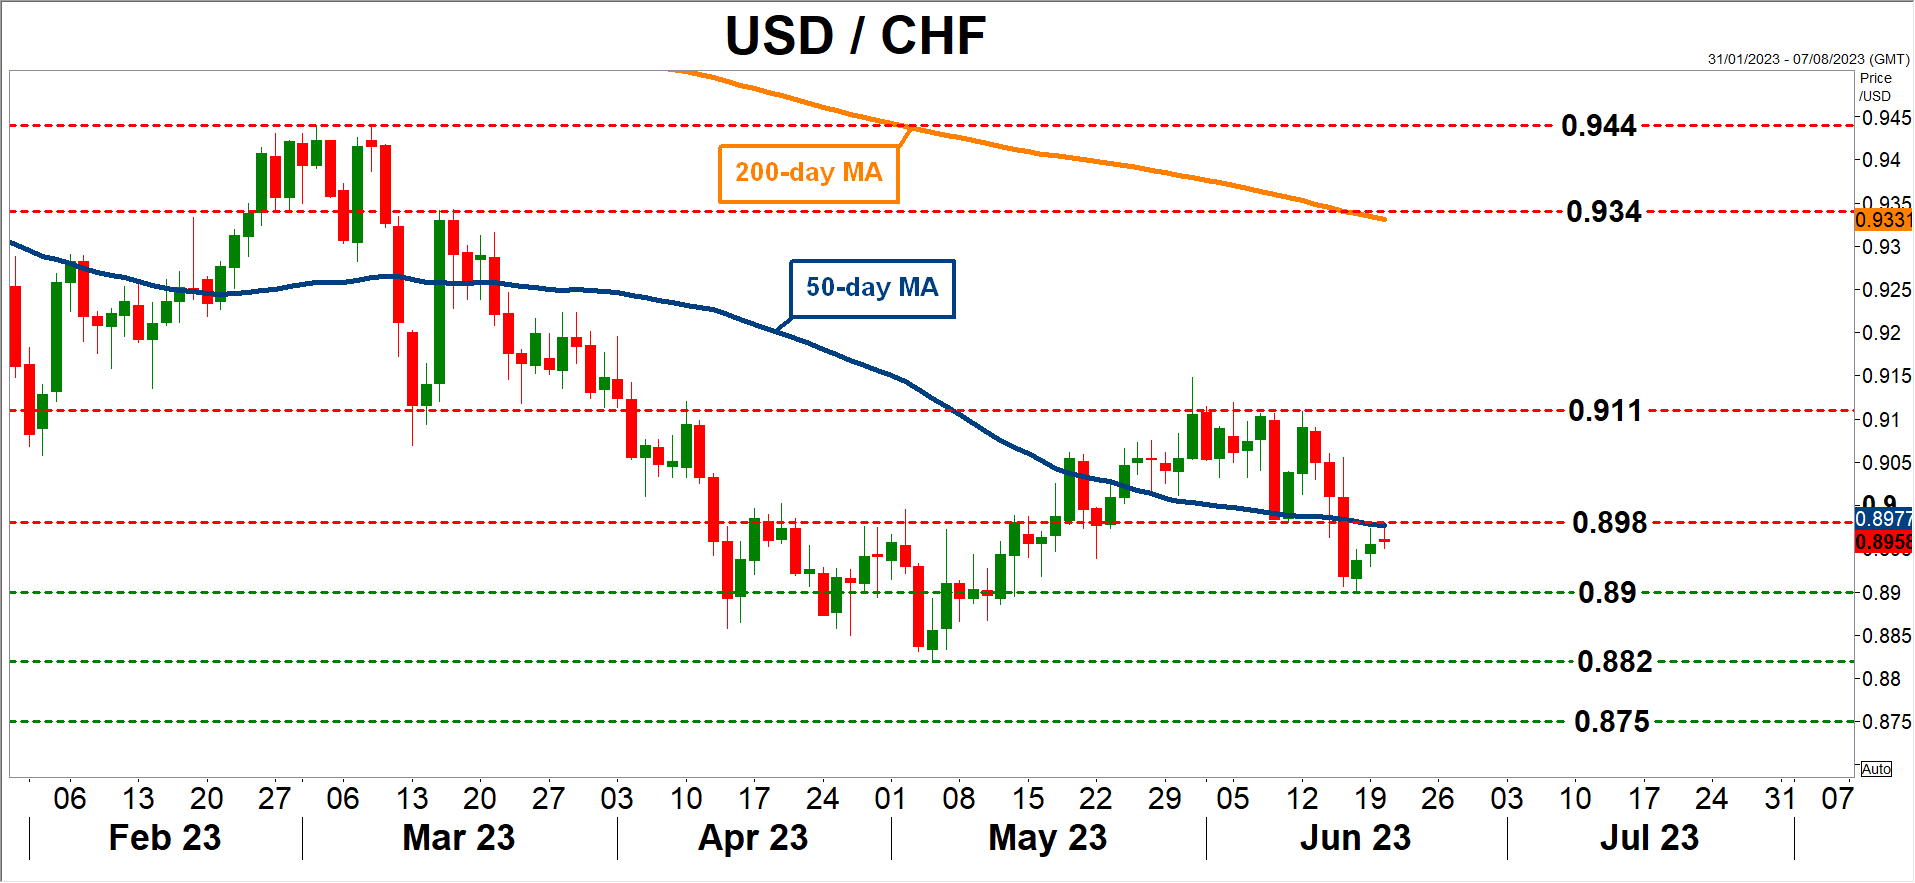
Such a decision could spell bad news for the Swiss franc, at least initially. Turning to the dollar/franc chart, a potential move higher might encounter immediate resistance near 0.8980, which is where the 50-day moving average has converged. A break higher would open the door towards the 0.9110 region.
On the flipside, a 50bps rate hike could trigger the opposite response, sending dollar/franc lower for another test of the 0.8900 zone. If violated, the spotlight would turn to the May low of 0.8820.
The big picture
Looking beyond this rate decision, the broader outlook for the Swiss franc seems rather bright. Even though the SNB has not raised rates as much as other central banks, at least the franc is not haunted by negative rates anymore.
Even more importantly, the SNB has flipped from a net-seller of the franc to a net-buyer. The latest data on sight deposits suggest the SNB still intervenes in the FX market, but it is now actively buying francs and selling foreign currencies. The goal is to keep the currency 'strong' and in the process, keep imported inflation under control.
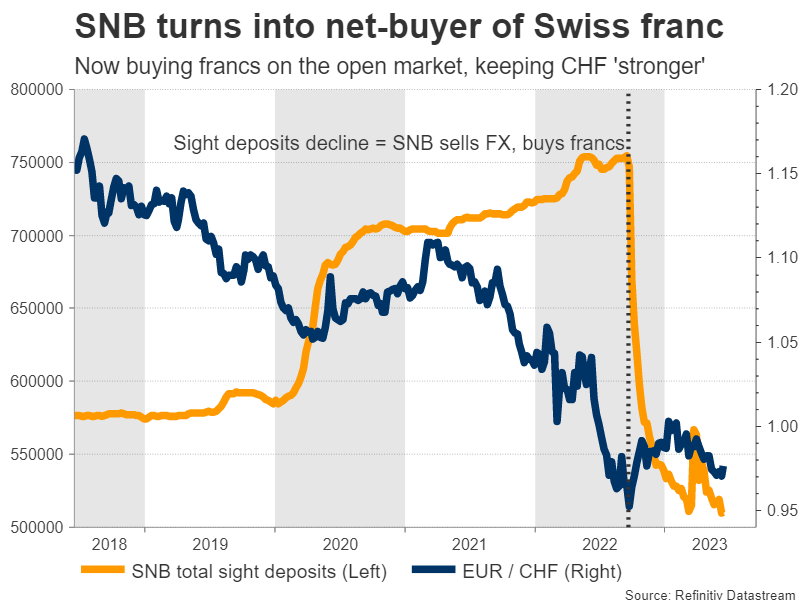
Finally, there's global risk sentiment to consider, as the franc is a safe haven instrument. If the recent euphoria in riskier assets calms down and concerns about a global economic slowdown resurface later this year, that could be another beneficial force for the defensive currency.
BoE Expected to Hike after CPI Figures
The consensus that the BoE will hike at the meeting on Thursday is pretty near unanimous. Where rates go after that is subject to intense debate, with the market and economists (and, potentially, the BoE) having different views. All of this could shake up the pound, especially if inflation is not in line with expectations tomorrow.
Where the disagreement lies
According to surveys by both Reuters and Bloomberg, the consensus among economists is that the BoE will reach a terminal rate of 5.0%. That means one hike at this meeting, and one more after that. The BoE would then hold rates steady for the rest of the year, according to this view.
The market, on the other hand, expects a terminal rate of 5.75%. It even got as high as 6.0% on Friday. This means 125bps of hiking over the course of the next few months. The BOE has been hesitant to do "double" hikes, so this could mean policy would continue to be tightened almost until the end of the year. Because the market is what rules the price of the pound, it's this view that's supporting the current strength in sterling. So, if something were to happen to bring the outlook more in line with what economists say, it could weaken the pound.
Why such disparate views?
The issue relates to inflation expectations, and in particular how the labor market is seen affecting prices. April saw the largest (nominal) increase in wages on record, at 7.2%. That means inflation has gone on to have "second-round" effects, something that BoE Governor Andrew Bailey warned about last May.
Second round of effects is when inflation causes employers to demand (and get) higher wages. Which means they have more cash to continue shopping, which in turn keeps prices higher. This is the incipient "wage price" spiral that worries many central bankers. The conventional wisdom is that it takes even higher rates to put an end to a wage-price spiral. It's likely that market participants are looking at the tightness in the labor market and betting that wages will keep rising. This will practically force the BoE to keep hiking, even if there is an economic downturn.
How the data could change things
Economists suggest that inflation in the summer could come down naturally, partially thanks to base effects. That's because inflation rose quickly last summer, driven by energy costs. If prices were to keep rising, but at a slower pace, it would bring inflation down. Other seasonal reasons for high inflation, such as the poor weather in Spain in spring, could also help bring grocer prices back to more normal levels.
A lot, therefore, hinges on the CPI figures that come out ahead of the BOE's meeting. If inflation shows that it's going strong, then it would imply the market is right, and boost the pound. The expectation is for a mere 3 decimal drop in inflation, so it wouldn't take much to even show inflation has actually increased. That would likely send shockwaves through the markets, and rase bets for rates even higher.
USD: When Will the Downtrend End?
The possibility of a US recession has ignited intense debates, especially as the labor market and consumer spending continue to demonstrate resilience despite aggressive interest rate hikes. However, hold on to your hats because Deutsche Bank is bringing a bold statement. They see a 100% probability of a US recession unfolding. The fed funds rate is currently at its highest level since 2006, but inflation still persists above the Fed's desired goal. Fed Chair Jerome Powell warned that more rate hikes may be necessary to tackle this stubborn inflation. However, here's where it gets interesting: David Folkerts-Landau, Deutsche Bank's chief economist, believes that while further rate increases may bring inflation down, the price we might have to pay is a full-blown recession. In fact, he suggests that the US is on the verge of experiencing its first policy-induced boom-bust cycle in decades, with the inflationary effects of expansive fiscal and monetary policies finally catching up. Buckle up, folks, because it would truly be a historical anomaly if we manage to avoid a hard landing. Stay vigilant, forex traders, as these dynamics unfold before our eyes.
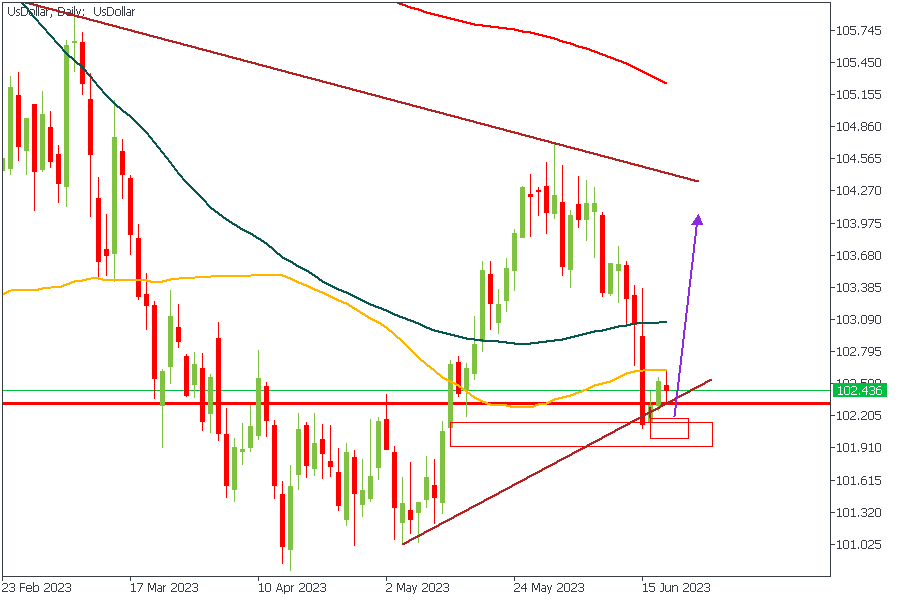
US DOLLAR - Daily Timeframe
At the moment, we’re seeing the likely onset of bullish price action from the US Dollar based on the candlestick formation within the demand zone. The confluences I have for this trade include;
Pivot zone from the weekly timeframe
Rally-base-rally demand zone, and
Trendline support
Analyst’s Expectations:
- Direction: Bullish
- Target: 102.218
- Invalidation: 103.0
EURUSD - Daily Timeframe
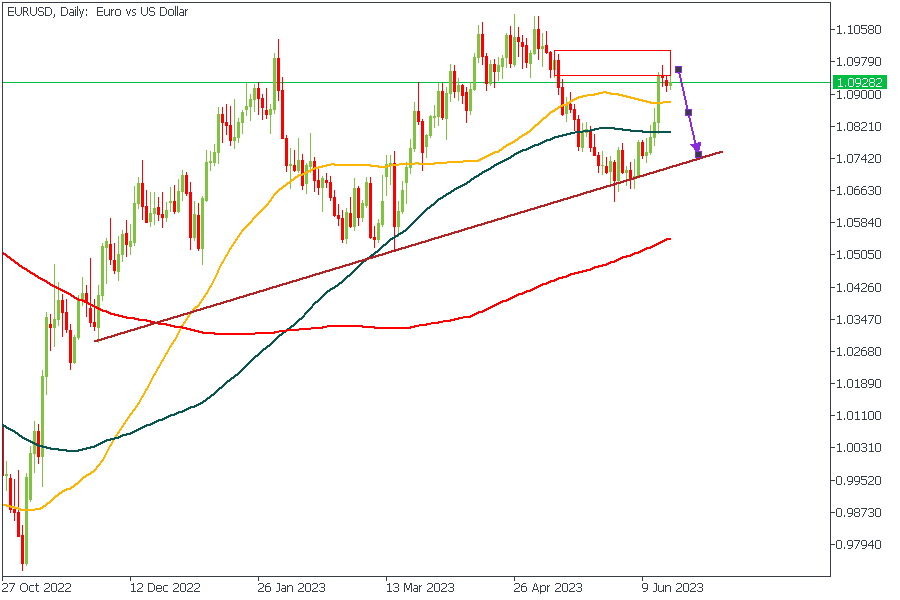
The bullish impulse is weakening, as we can see from the price action at the supply zone. Correlating this EURUSD price action with what we saw earlier on the US Dollar chart indicates, to a large degree, the likelihood of a bearish retracement. On this note, I expect to see the bearish movement slide toward the trendline support before we get to see a bullish continuation.
Analyst’s Expectations:
- Direction: Bearish
- Target: 1.08238
- Invalidation: 1.10092
GBPUSD - Daily Timeframe
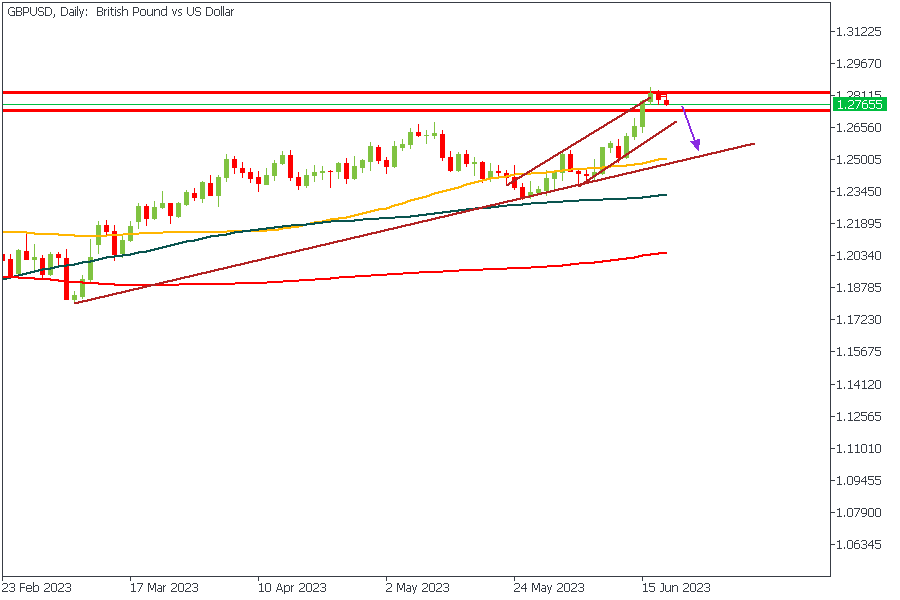
GBPUSD has reached a crucial resistance level after commencing a solid rally from the 100-Day moving average, which on a regular day would imply a possibility of a bearish movement. The current price action indicates an attenuation that often symbolizes a rejection from a support or resistance area. The correlation of this price action with that on the daily timeframe of the US Dollar chart reinforces my bias.
Analyst’s Expectations:
- Direction: Bearish
- Target: 1.26657
- Invalidation: 1.28523
AUDUSD - Daily Timeframe
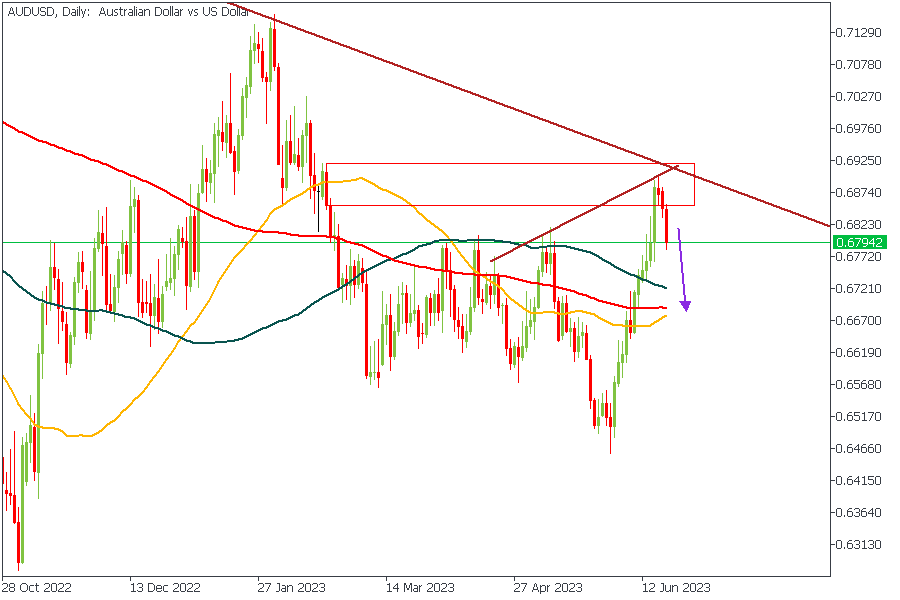
AUDUSD made a solid rejection from the convergence point of the two resistance trend lines and could be heading toward the 100-Day moving average for support.
The confluences for this position include;
The resistance trendline convergence
The rally-base-drop supply zone, and
The previous rejection from the supply zone
Analyst’s Expectations:
- Direction: Bearish
- Target: 0.67323
- Invalidation: 0.68483
CONCLUSION
The trading of CFDs comes at a risk. Thus, to succeed, you have to manage risks properly. To avoid costly mistakes while you look to trade these opportunities, be sure to do your due diligence and manage your risk appropriately.
BTCUSD Analysis: Positivity Has Returned to the Markets, But for How Long?
The price of bitcoin is rising to the highs of June after a sharp drop that happened due to SEC lawsuits against the Binance and Coinbase exchanges.
Fortunately for crypto investors, the situation did not go according to the worst-case scenario. The court did not freeze Binance.US funds, giving the regulator and exchanges the opportunity to find a compromise. But if it does, what kind of compromise will it find and when? It is not surprising that we will be able to witness the massive relocation of crypto companies from the US:
→ To the UK. This week, the House of Lords of England approved the FSMB cryptocurrency regulation project, which has been under consideration since June 2022. Now the document must be approved in Parliament and sent to the king for signature. This month, by the way, venture capital firm a16z announced plans to open its first office in London later this year, citing a more predictable business environment.
→ To the UAE. VARA, the world's first independent regulator of virtual assets, operates there. As of January 2023, there were over 500 cryptocurrency startups operating in Dubai.
→ To Hong Kong, where the Securities and Futures Commission (SFC) approved a loyal licensing regime for virtual asset trading platforms.
→ To Europe, where the principles of regulation of the cryptocurrency market are laid down in Markets in Crypto Assets (MiCA).
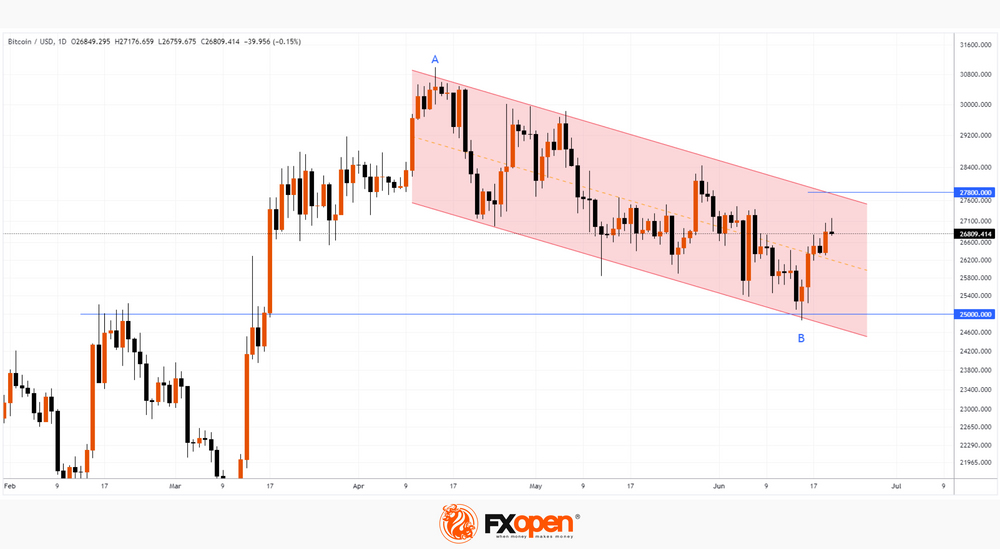
Meanwhile, the bitcoin chart shows that the market has formed a false breakout of the USD 25k psychological level. We wrote about this option on June 15th.
After the puncture, against the backdrop of a weakening dollar and news about crypto regulation, the price of bitcoin rose to USD 27k per coin. However, the upside momentum may fade as it approaches 27,800, where the 50% of the A→B decline lies. In addition, the activity of the bears can be facilitated by the upper border of the descending channel (shown in red).
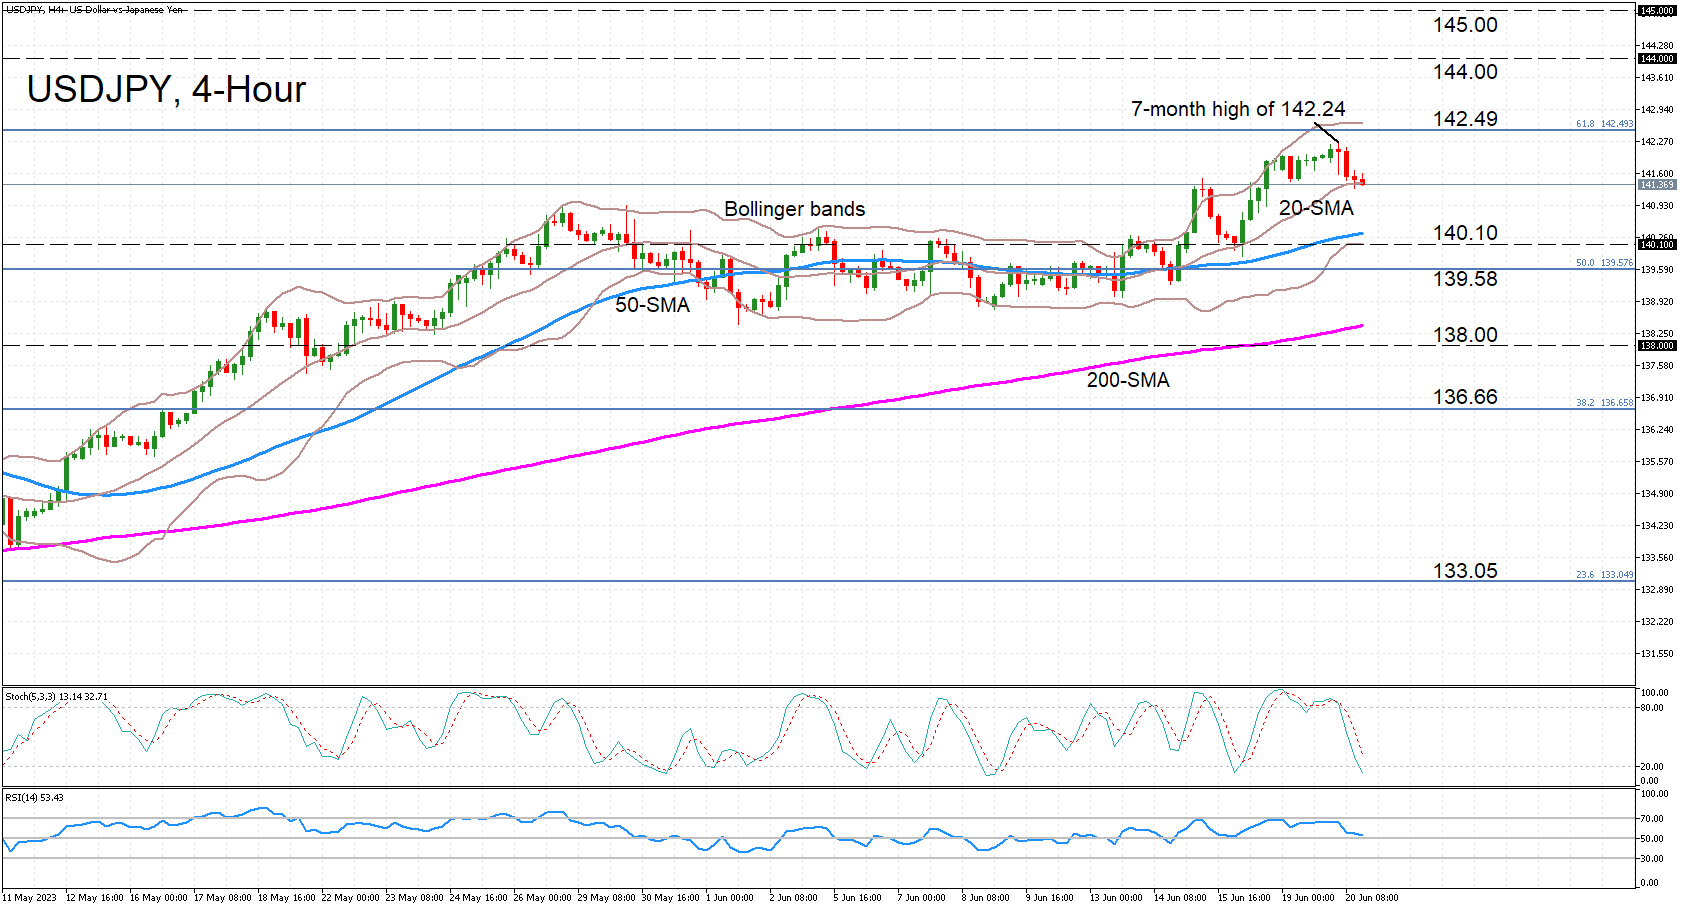
USDJPY Rally Stumbles But Finds Support at 20-Period SMA
USDJPY has come under selling pressure after hitting a seven-month high of 142.24 earlier today. Caution likely set in as the pair approached the 61.8% Fibonacci retracement level of the October 2022-January 2023 downtrend at 142.49.
But whilst the stochastic oscillator is indicating further losses in the short term as it has gone into a sharp downside reversal, heading for the oversold region below 20.0, the RSI is showing signs of stabilization just above the 50 neutral level.
The price action is underscoring the latter picture in the 4-hour chart as the 20-period simple moving average (SMA) has stepped in to defend the pair. Should it give way, the 50-period SMA is likely to be the next point of friction around 140.35. Slightly lower is an even more crucial support area around 140.10 where the lower Bollinger Band has flatlined and is where the upper Bollinger Band repeatedly capped prices during June. If the bears are able to penetrate this heavily fortified region, they will almost certainly aim for the 200-period SMA next.
However, if USDJPY manages to bounce off the 20-period SMA, it will probably have another attempt at cracking the 61.8% Fibo, which would then clear the way for the 144.00 and 145.00 levels.
Summing up, the negative bias in the very short term could be temporary if the 20-period SMA holds but breaching it would fuel the bearish forces, especially if the price also falls below 140.10. However, the bullish outlook in the medium term should stay intact as long as USDJPY trades above the 200-period SMA.
GBP/USD Lower Ahead of UK Inflation
- UK inflation expected to fall to 8.4% on Wednesday
- BoE likely to raise rates on Thursday
- Fed Chair Powell to testify before House committee on Wednesday
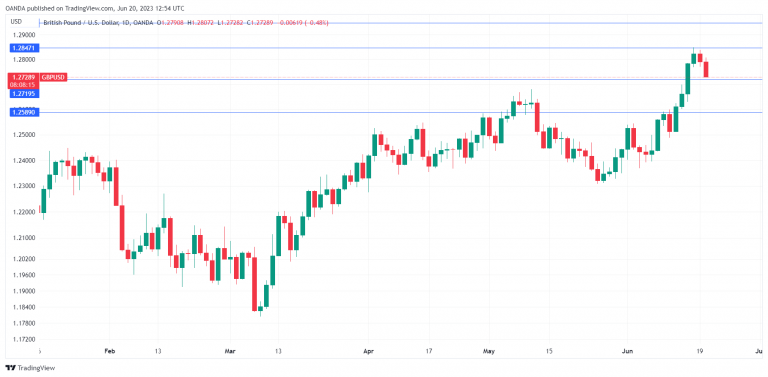
The British pound is lower on Tuesday. In the European session, GBP/USD is trading at 1.2739, down 0.41%.
UK inflation expected to ease
The UK releases the May inflation report on Wednesday and BoE policy makers will be hoping that inflation continues to trend lower. Inflation dropped in April to 8.7%, decelerating for a second straight month. The consensus stands at 8.4%, and the good news is that those awful readings above 10% appear to be over. On a monthly basis, inflation is expected to fall to 0.5% in May, down from 1.2% in April.
Inflation appears to have peaked and is heading lower, but nobody at the Bank of England is smiling. The UK is expected to have one of the highest inflation rates in the G-20 this year at 6.9% and the BoE’s 2% target is miles away. Finance Minister Sunak has set a goal of lowering inflation to 5% by the end of the year, which seems feasible if inflation continues to downtrend in the coming months.
The BoE will be in the spotlight on Thursday when it makes its rate announcement. The markets have priced in a 25-basis point hike at 70%, with a 30% chance of an oversize 50-bp increase. If inflation falls as expected to 8.4% or lower, the MPC should be able to proceed with the 25-bp hike, although central banks have a tendency of surprising the money markets.
In the US, it’s an unusually light data calendar this week. There are no tier-1 releases on Tuesday, and the markets are looking ahead to Wednesday, with Jerome Powell testifying before the House Financial Services Committee. Powell will have to clarify to lawmakers the Fed’s interest rate path, as the Fed paused last week after ten straight hikes but expects to renew hiking in July.
GBP/USD Technical
- 1.2719 is under pressure in support. Next, there is support at 1.2589
- There is resistance at 1.2848 and 1.2950