Sample Category Title
SPX 500: Bullish Trend Undeterred by US Government Shutdown, En Route to 6,800/850 Next
Key takeaways
- SPX 500 maintains bullish momentum, rallying to a fresh all-time high of 6,745 despite the ongoing US government shutdown.
- Fed rate cut expectations remain elevated, with markets pricing a 98% chance for October and 87% for December.
- Technical outlook stays positive, with key support at 6,690 and upside targets at 6,800–6,850 within the medium-term uptrend channel.
- Sector rotation favours risk assets, with Consumer Discretionary outperforming Consumer Staples, reinforcing bullish sentiment.
The price actions of the US SPX 500 CFD Index (a proxy of the S&P 500 E-mini futures) have staged the expected bullish reversal, rallied by 2% and hit the 6,730/6,745 resistance zone. It notched another fresh all-time high of 6,745 on Friday, 3 October 2025, during the start of the European session at the time of writing.
The US government entered its second day of shutdown with US President Trump ratcheting up pressure on the Democrats to end the shutdown by threatening to slash “thousands” of federal jobs.
Increased odds of Fed rate cuts fuelled the bullish optimism for US stocks
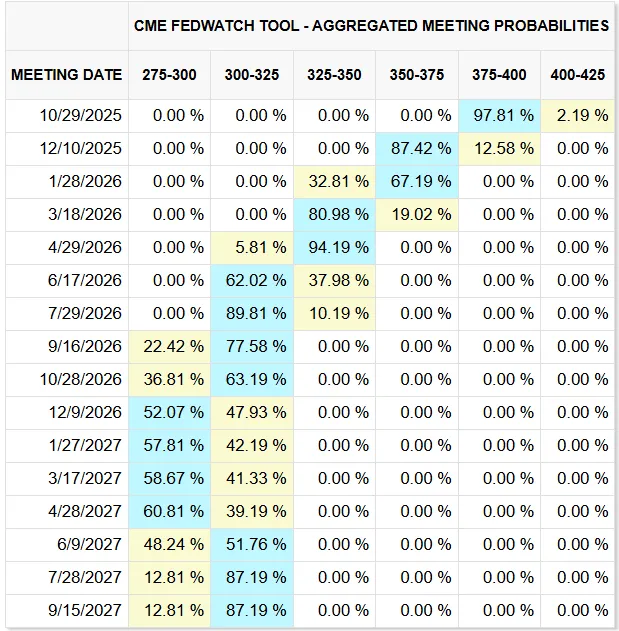
Fig. 1: FOMC outcome probabilities as of 3 Oct 2025 (Source: CME FedWatch tool)
The US stock market brushed aside potential economic headwinds, instead focusing on growing expectations of a more dovish Federal Reserve, which propelled the S&P 500 and Nasdaq 100 to fresh record highs on Thursday, 2 October 2025.
Based on the latest data from the CME FedWatch tool, the Fed funds futures market is pricing a 98% probability of a 25-basis-point Fed rate cut at the upcoming 29 October 2025 FOMC meeting. Expectations for a third 25-basis-point cut in 2025 have also strengthened, with odds rising to 87% for the 10 December meeting, which would lower the Fed funds rate to a range of 3.50%–3.75% (see Fig. 1).
All in all, a more dovish Fed is likely to increase liquidity, in turn, fuelling a positive feedback loop into risk assets such as US stocks.
Also, do take note that the Bureau of Labour Statistics’ non-farm payroll data for September is likely not to be released today due to the ongoing US government shutdown. The key focus later in today’s US session will be the private surveyor ISM Services PMI for September, with its employment sub-component.
Let’s now focus on the latest short-term trajectory (1 to 3 days), relevant key elements, and new key levels to watch on the US SPX 500 CFD Index.
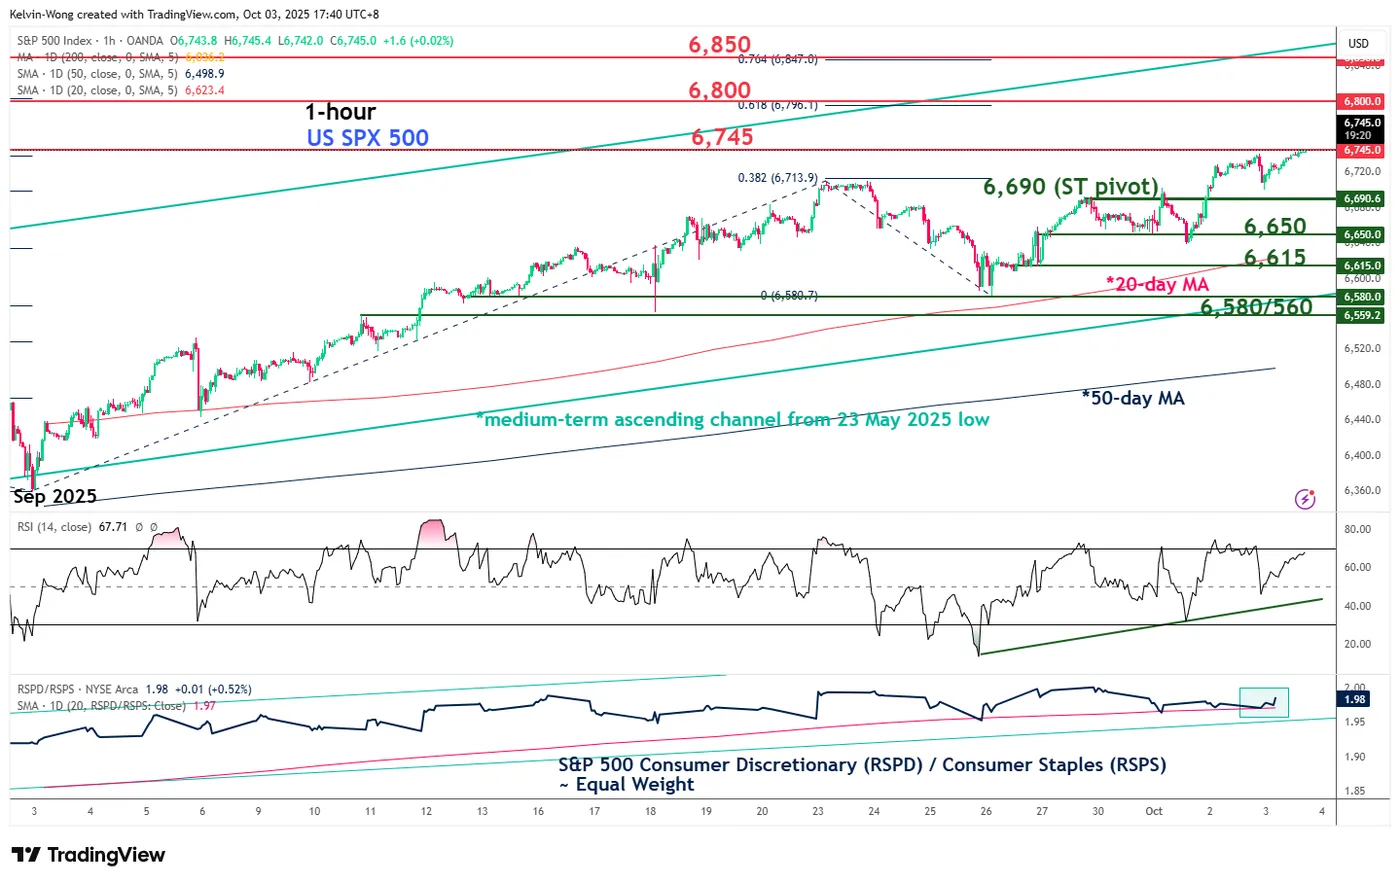
Fig. 2: US SPX 500 CFD Index minor trend as of 3 Oct 2025 (Source: TradingView)
Preferred trend bias (1-3 days)
Maintain bullish bias for the US SPX 500 CFD Index with an adjusted key short-term pivotal support at 6,690 as it continues to oscillate within its minor and medium-term uptrend phases.
It's minor bullish impulsive up move sequence remains intact, with next intermediate resistances coming in at 6,800 and 6,850 (Fibonacci extension) (see Fig. 2).
Key elements
- The US SPX 500 CFD Index has continued to evolve within a medium-term ascending channel in place since 23 May 2025. The upper boundary/resistance of the ascending channel is projected at 6,850.
- The hourly RSI momentum indicator of the US SPX 500 CFD Index remains in a bullish momentum condition as it is being supported by an ascending trendline, holding above the 50 level.
- The relative chart of the cyclical-oriented equal-weighted S&P 500 Consumer Discretionary sector ETF versus the defensive-oriented equal-weighted S&P 500 Consumer Staples sector ETF has just rebounded after a retest on its 20-day moving average on Thursday, 2 October 2025. This development signals continued outperformance in Consumer Discretionary over Consumer Staples, reinforcing the case for an ongoing bullish impulsive movement in the US SPX 500 CFD Index.
Alternative trend bias (1 to 3 days)
A break below the tightened 6,690 key short-term support negates the bullish tone for a minor corrective pull-back to expose the next intermediate supports at 6,650 and 6,615 (also the 20-day moving average).
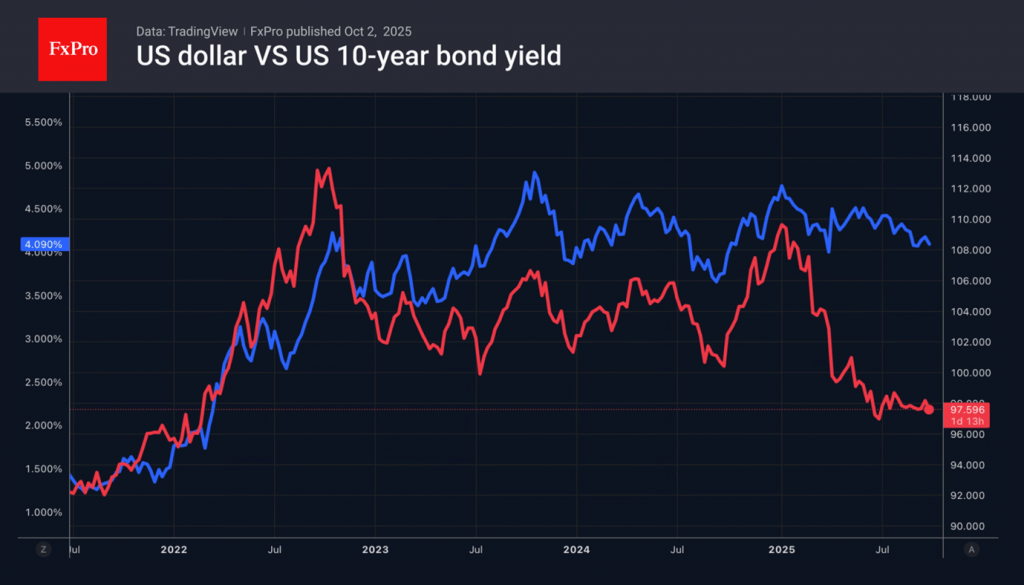
US Government Shutdown Pressing Dollar
The shutdown came as a bolt from the blue for the US dollar. The greenback was confident that Democrats and Republicans would reach a last-minute agreement. That did not happen. During previous government shutdowns, the dollar index typically fell on expectations of slowing GDP and mass layoffs. In 2025, the situation will worsen because the labour market is already cooling down.
Due to the shutdown, the publication of important data will be postponed. Therefore, the importance of the ADP report increases. Over the last two months, there has been a decline in private sector employment. This increased the chances of a federal funds rate cut in October to 99% and in December to 87%. Treasury bond yields and the US dollar fell.
There is increased demand for safe-haven assets in the markets. Gold continues to break records, Treasury yields are falling, and the yen has moved away from the political crisis in Japan and is growing steadily. In contrast, European currencies are not yet able to take full advantage of the weakness of the US dollar. The euro is hampered by geopolitics and events in France.
EUR/USD Holds Steady Amid Tense External Backdrop
The EUR/USD pair held its ground around 1.1726 on Friday. While volatility in the currency market has picked up significantly, the immediate economic impact of the US government shutdown remains limited. Nonetheless, the political deadlock is fuelling broader concerns over policy uncertainty, persistent inflation risks, and a weakening US labour market.
Adding to the tense atmosphere, Finance Minister Scott Bessent warned on Thursday that the funding suspension could negatively impact GDP growth. Simultaneously, President Donald Trump threatened deep cuts to federal agencies in a bid to pressure Democratic opponents.
On the monetary policy front, Dallas Fed President Lorie Logan characterised the September rate cut as a justified step to shield the labour market from a sharper slowdown. However, she noted that the economic deceleration is gradual and does not yet warrant urgent further action.
Despite this cautious tone, market pricing indicates a near-certain probability of a 25 bps rate cut this month, with a second cut fully priced in by December.
Technical Analysis: EUR/USD
H4 Chart:
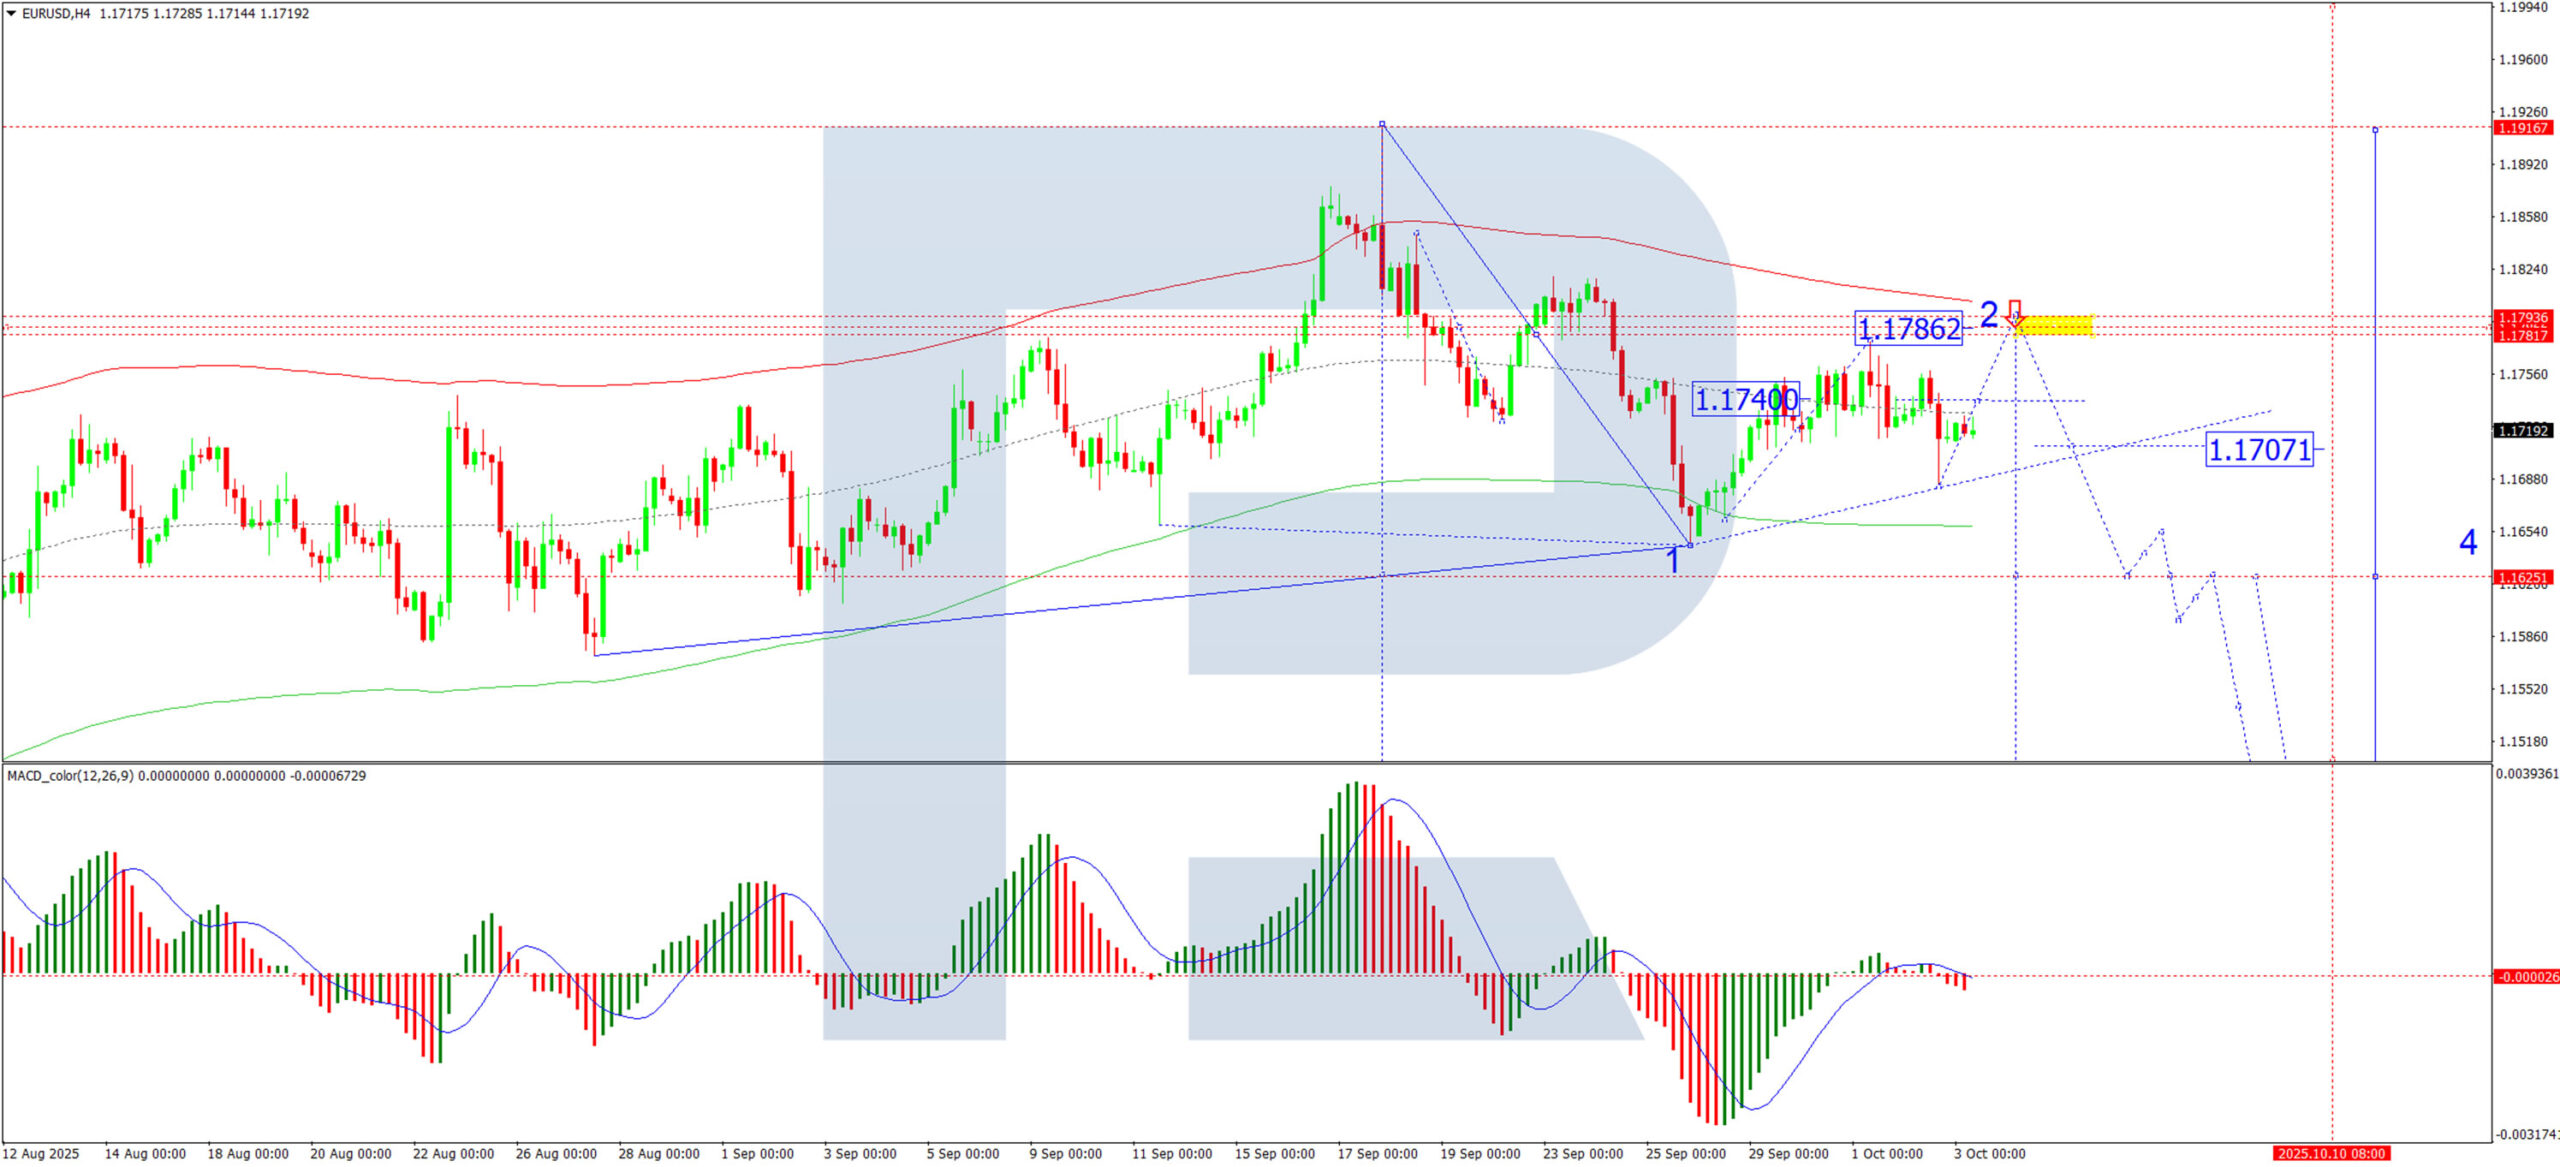
On the H4 chart, EUR/USD formed a consolidation range around 1.1740, which has since expanded downward to 1.1685. We now anticipate a move higher towards 1.1740, followed by a decline to 1.1707. A decisive upside breakout could propel the pair towards 1.1786, while a break below the current range would open the path for a continued downtrend towards 1.1625 and potentially lower. This bearish-leaning scenario is technically supported by the MACD indicator, with its signal line positioned below zero and pointing firmly downward.
H1 Chart:
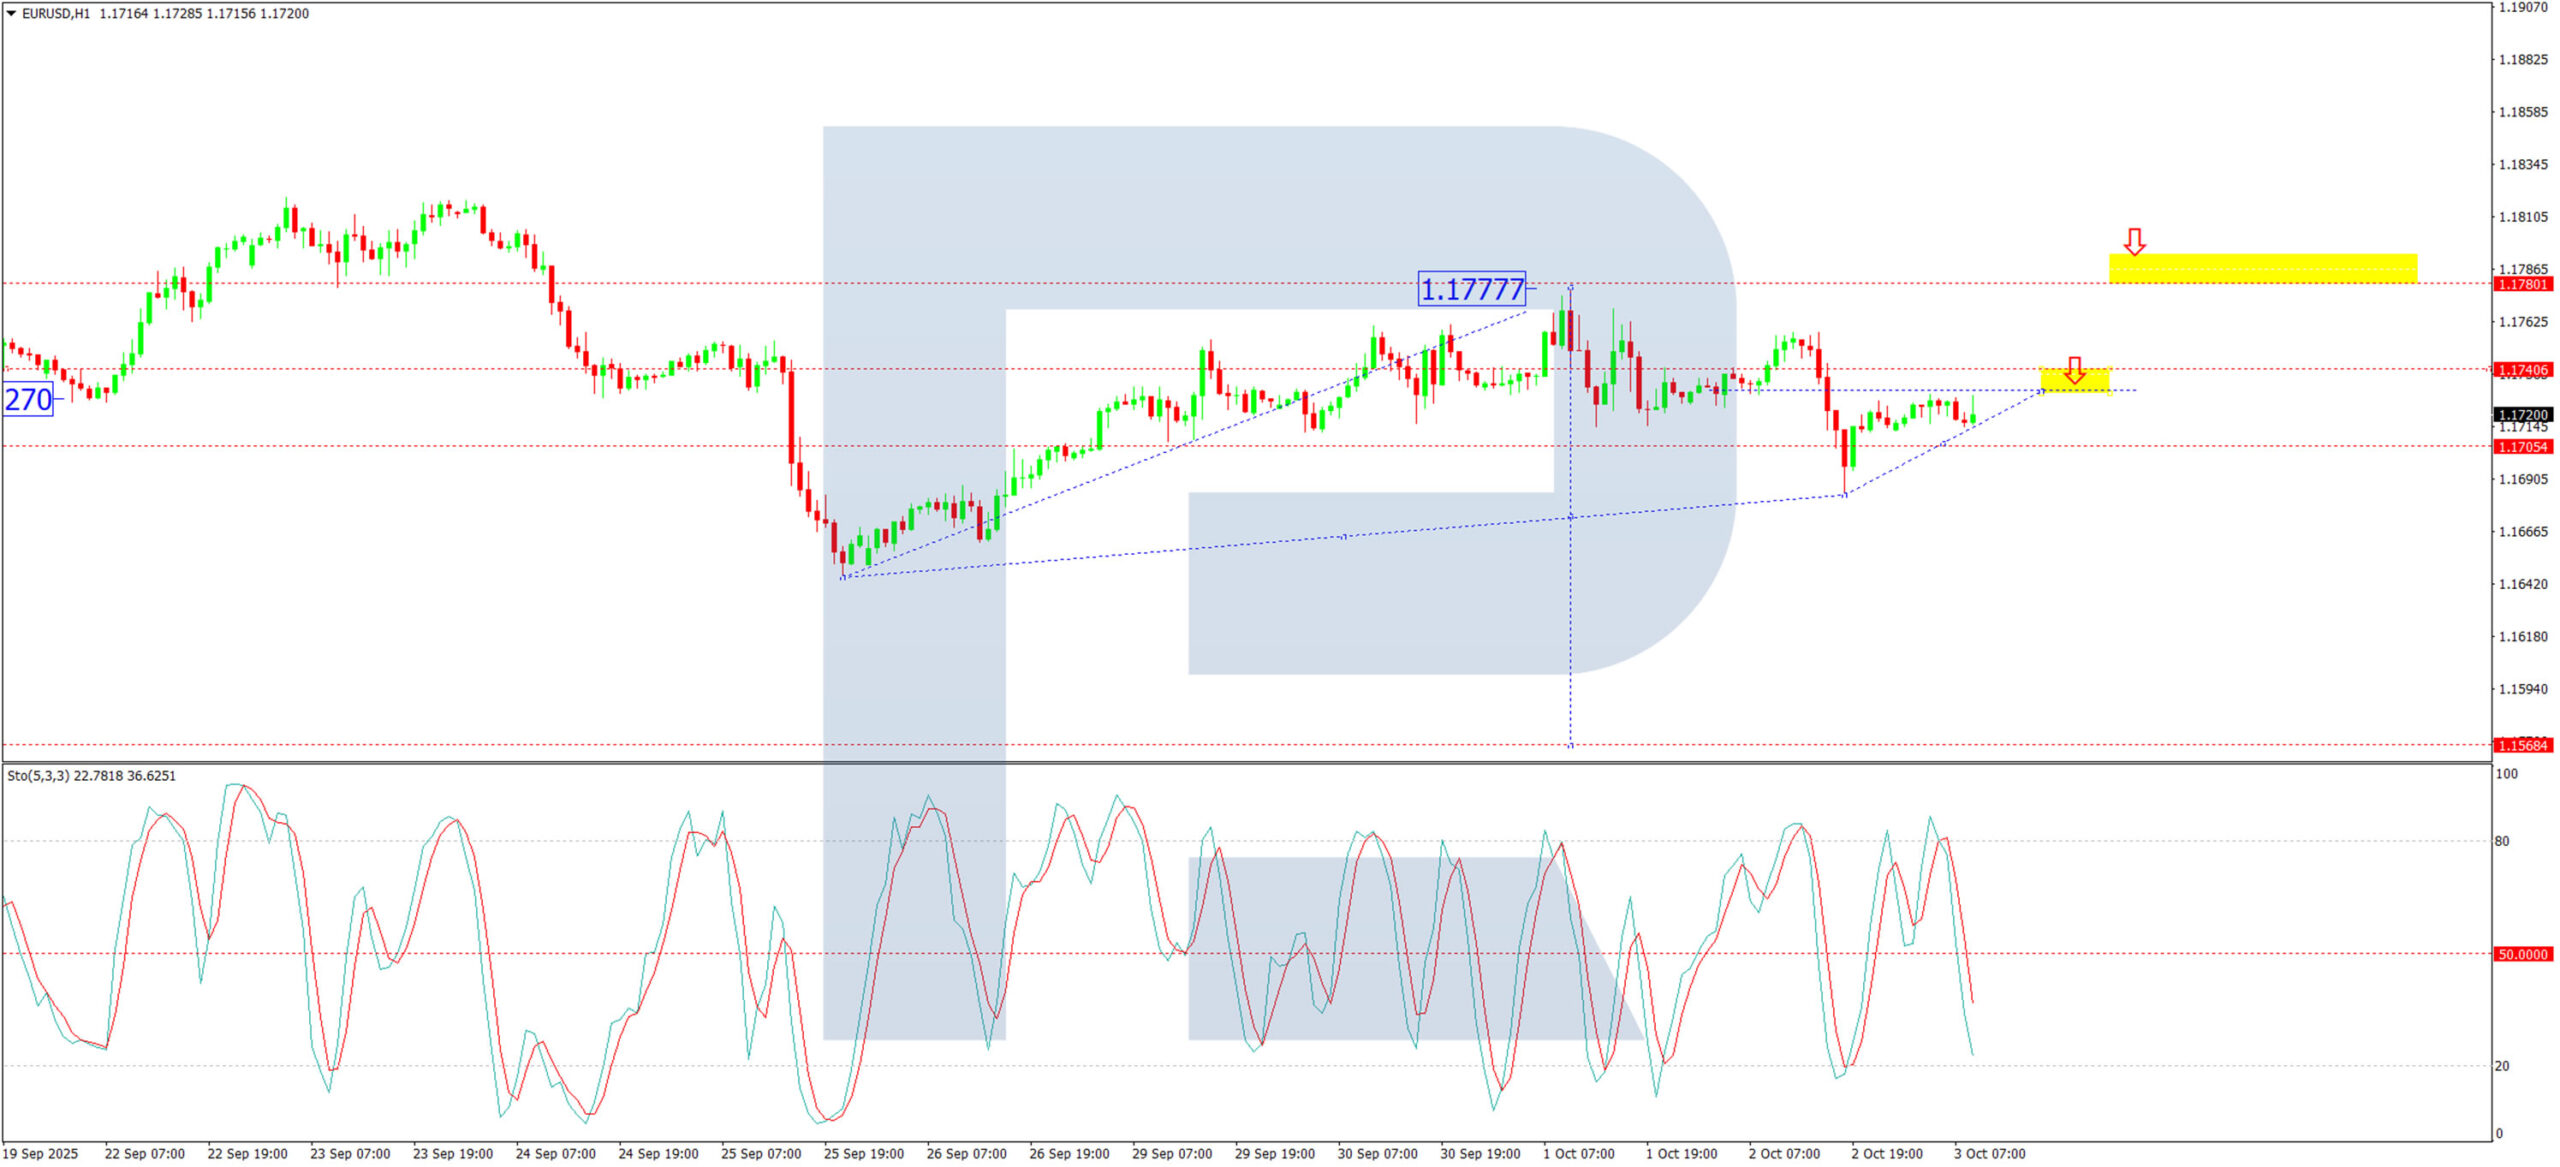
The H1 chart shows the pair completed a downward wave to 1.1683 and a subsequent correction to 1.1728. We now expect a further decline to 1.1670. A break below this level would activate the potential for a downward wave targeting 1.1625. A breach of this latter level could then initiate a third wave of selling towards 1.1470. The Stochastic oscillator aligns with this view, as its signal line is above 80 and turning sharply downward towards 20.
Conclusion
EUR/USD is currently stabilising, but remains highly sensitive to the twin forces of US political instability and shifting Fed policy expectations. The overall technical structure retains a bearish bias, suggesting that any near-term stability is fragile and likely to give way to further declines unless fundamental drivers shift significantly.
Eurozone PPI down -0.3% mom, -0.6% yoy, energy drag while regional divergence widens
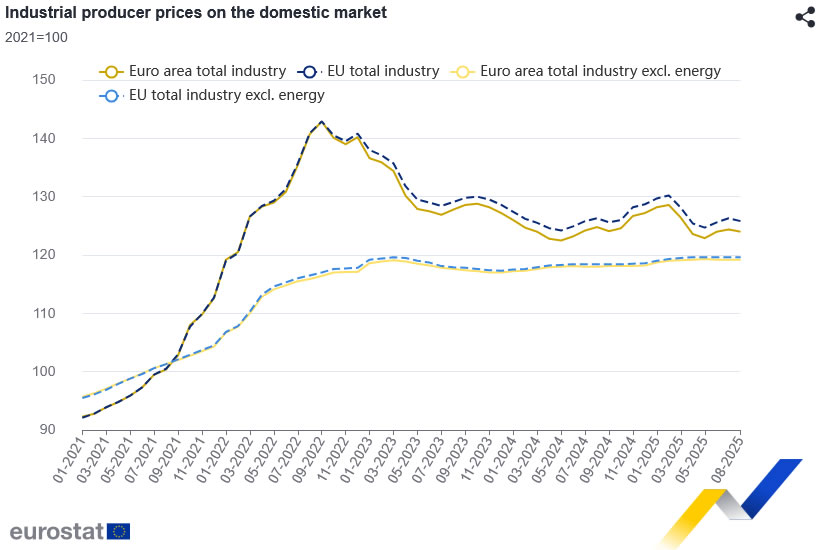
Eurozone producer prices fell by -0.3% mom and -0.6% yoy in August, weaker than expectations of flat monthly growth and a smaller -0.4% yoy decline. The drop underscores the continued disinflationary forces in the pipeline, particularly as energy prices remain soft.
Breaking down the Eurozone data, prices fell -1.3% mom for energy and -0.1% for both intermediate and durable consumer goods. In contrast, modest increases were seen in capital goods (+0.1%) and non-durable consumer goods (+0.1%).
Across the EU as a whole, PPI slipped -0.4% mom and -0.4% yoy. At the country level, the steepest monthly declines were recorded in Denmark (-1.3%), the Netherlands and Romania (both -1.0%), and Austria (-0.8%). Meanwhile, Estonia (+5.4%), Finland (+1.9%) and Slovakia (+1.3%) bucked the trend with notable gains.
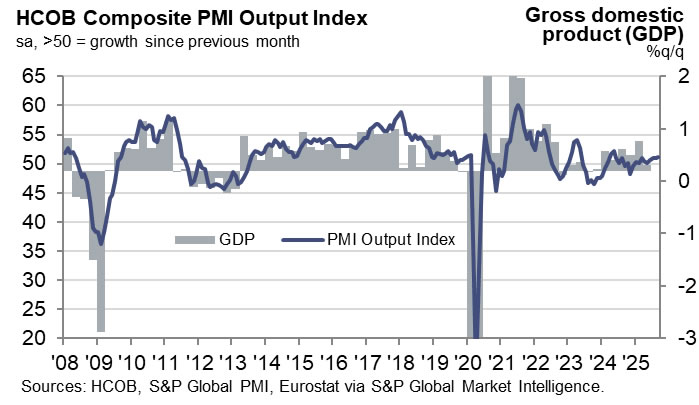
UK PMI suggests summer bounce a flash in the pan, supports BoE dovish shift
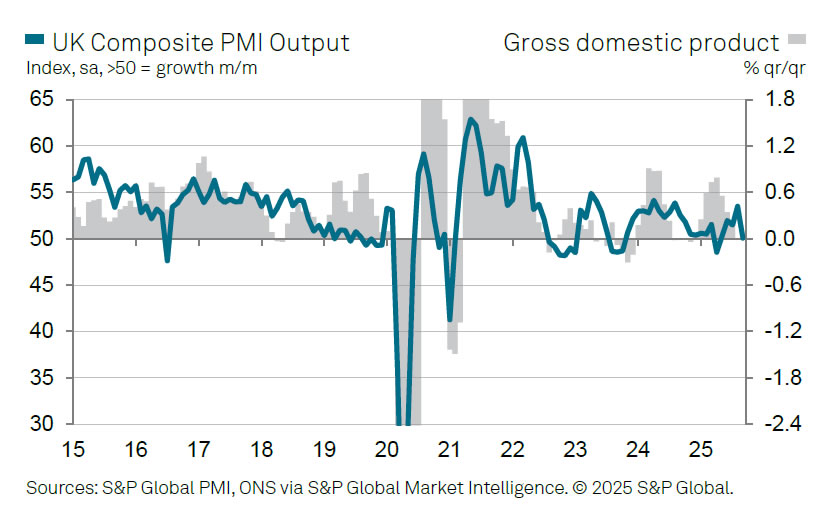
UK business activity slowed sharply in September, with the final Services PMI dropping to 50.8 from August’s 16-month high of 54.2, marking a five-month low. The Composite PMI mirrored the downturn, slipping to 50.1 from 53.5, also a five-month trough.
Tim Moore, Economics Director at S&P Global Market Intelligence, said service providers saw a “disappointing end” to Q3 as weak consumer confidence, postponed investment decisions, and falling exports weighed on demand. He warned that the summer’s output surge now looks like a “flash in the pan,” with political and economic uncertainty again restraining the sector. Export orders were particularly weak, as European demand remained subdued.
The report also flagged another month of job losses, extending a year-long trend, alongside weaker business confidence and softer cost pressures. These signs of slackening labor conditions and easing inflation are likely to reinforce the “more dovish shift” in the BoE’s policy debate, with calls growing for further rate cuts into 2025.
Eurozone PMI signals 0.4% Q3 GDP growth, backs ECB hold
Eurozone services activity strengthened in September, with PMI Services finalized at 51.3, up from 50.5 in August and marking an eight-month high. Composite PMI also edged higher to 51.2, the best in 16 months.
Country breakdowns in Composite highlighted broad-based improvement. Spain led with a 53.8 reading, while Germany and Ireland both came in at 52.0, representing multi-month highs. Italy held at 51.7, while France lagged with a decline to 48.1, its weakest in five months.
Cyrus de la Rubia, Chief Economist at Hamburg Commercial Bank, noted that business activity “picked up more strongly” in September, and that the rebound was “broad-based geographically.” The uptick in new business suggests expansion could continue into October, though backlogs have yet to recover.
Crucially, price pressures eased but remained slightly above average. De la Rubia said the data support policymakers who resist further cuts, as inflation in services is still sticky. With the composite PMI holding in expansionary territory throughout Q3, HCOB’s nowcast points to quarterly GDP growth of around 0.4%.
GBP/USD Snaps Four-Day Winning Streak, Hovers Around 1.34500 – Potential Targets and Price Forecast
Having rallied substantially from lows made last week, the GBP/USD broke a four-day winning streak in yesterday's trading, falling by 0.28%.
Today, and at the London open, GBP/USD currently trades at ~1.34521, up 0.10%.
GBP/USD: Key takeaways 03/10/2025
- The most significant catalyst of GBP/USD movement currently, the US government shutdown is weighing heavily on the dollar, as markets readjust confidence in American governance
- Otherwise, and following Wednesday’s worse-than-expected UK manufacturing PMIs, signifying five-month lows, the Bank of England is under increasing pressure to consider further rate cuts, although inflation remains somewhat sticky
- Recent GBP/USD upside is almost exclusively due to dollar weakness, as opposed to pound strength
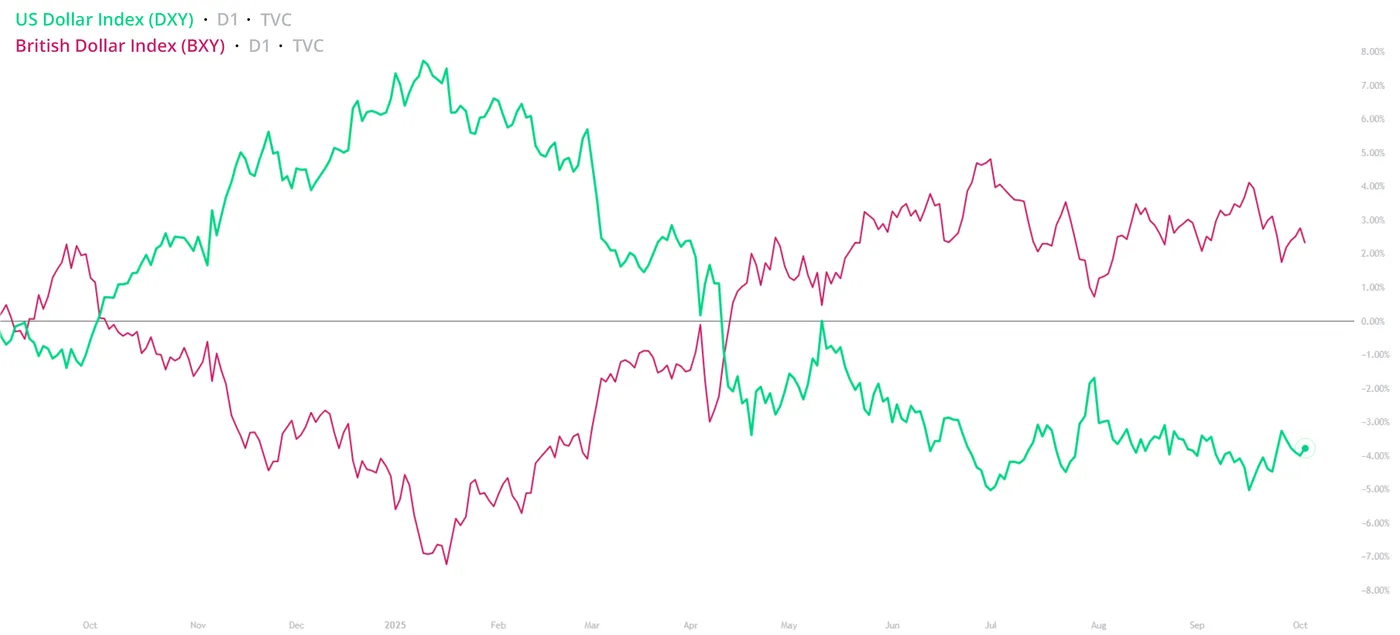
Dollar Strength Index (DXY) vs. British Strength Index (BXY). TVC, TradingView, 02/10/2025
GBP/USD: US government shutdown adds to cable upside
In a return to a word oh-so-familiar in this year’s trading, the latest wave of market uncertainty has come by way of the US government shutdown, announced on Tuesday evening, as the US Senate failed to reach an agreement on government funding.
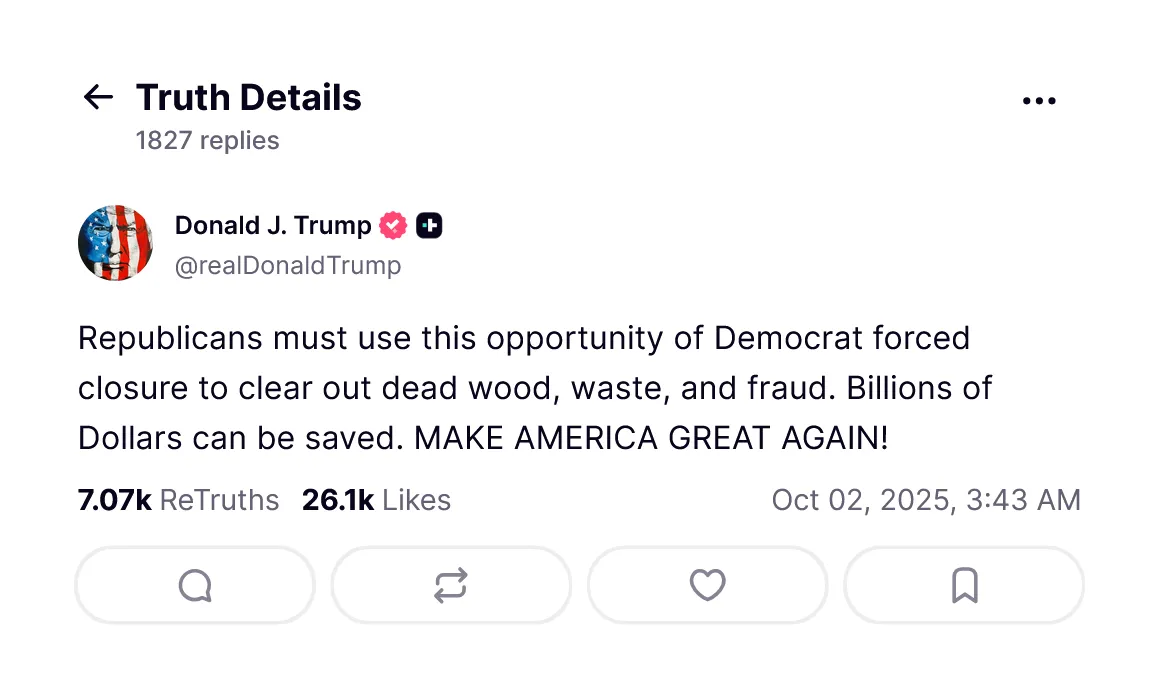
@realDonaldTrump, Truth Social, 02/10/2025
With the majority of US Democrats voting against a funding bill proposed by the Republican Party, the shutdown is the first in almost seven years, the last having occurred during Trump’s first presidency in 2018.
While at first glance, the notion of a governmental shutdown seems purely political, some knock-on effects are already being felt within currency markets, with the release of many key economic indicators expected to be delayed, since reporting agencies are considered ‘non-essential’ during times of government shutdown.
This is especially relevant considering that, under normal market conditions, nonfarm payrolls were scheduled to be released this week.
Considering the importance of these figures, especially their implications for upcoming monetary policy, the market understandably remains somewhat uneasy, which has introduced some short-term dollar weakness.
Should a resolution to the shutdown be found, either by a temporary bill or a Democrat concession in accepting the most recent Republican suggestion, we can expect dollar weakness to reverse course, at least in the short term.
GBP/USD: UK manufacturing PMIs fall short of market expectations
To touch quickly on recent data, Wednesday’s report revealed that manufacturing conditions in the UK not only continue to worsen but have fallen to five-month lows, at 46.2.
At least in part, these conditions are adding pressure to the Bank of England to consider further rate cuts, although this will prove difficult if inflation remains sticky.
As such, and considering not only a non-flattering reflection of the UK economy, but also implications for Bank of England monetary policy, we can expect some short-term pound downside as seen in yesterday’s session.
GBP/USD: Technical Analysis 03/10/2025
GBP/USD: Daily (D1) chart analysis
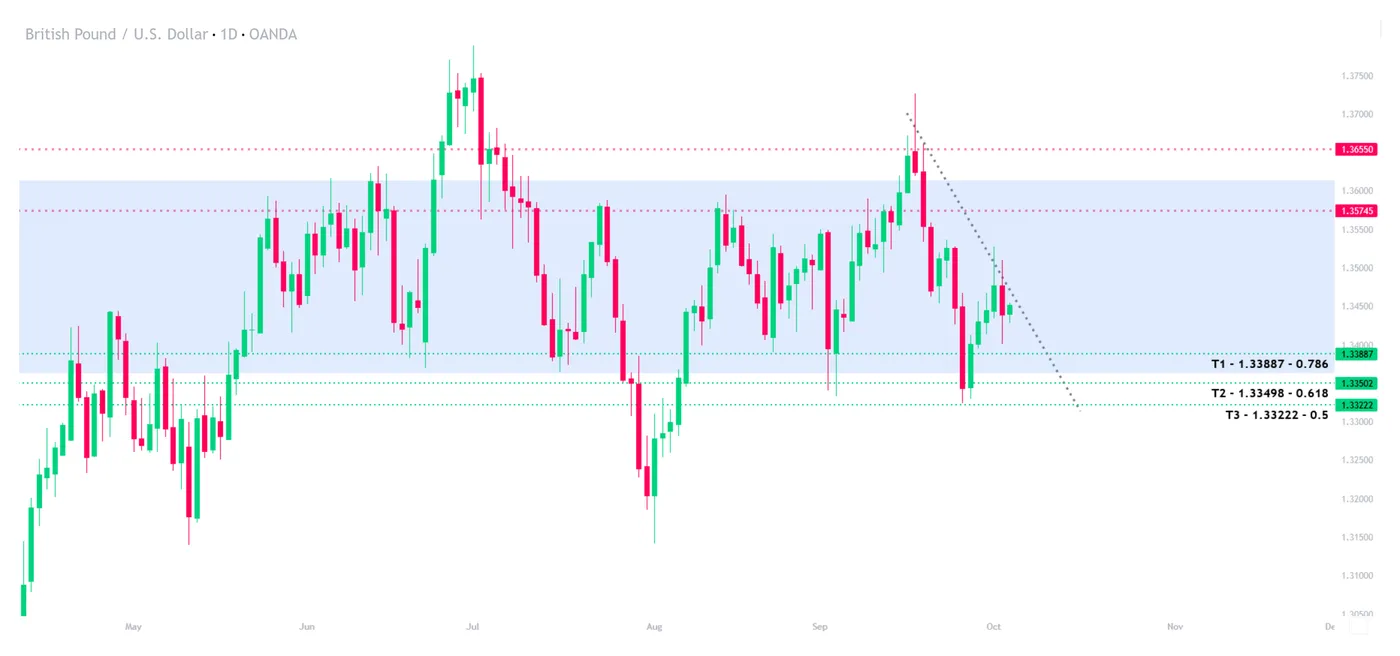
GBP/USD, D1, OANDA, TradingView, 03/10/2025
While cable performance in the first half of 2025 was remarkable, mainly owing to a downbeat dollar, since June, the tune has somewhat changed.
Of late, we’ve entered into a period of consolidation, best visible on the daily timeframe, with price moving sideways and yet to challenge the highs of 1.37710 made earlier this year.
Currently, price trades close to the trendline, with some short-term downside on the table unless the trendline can be broken.
Should this happen, here are some key levels to be watching:
- Price target 1 (T1): 78.6% Fib: $1.33887
- Price target 2 (T2): 61.8% Fib: $1.33498
- Price target 3 (T3): 50% Fib: $1.3322
- Resistance 1 (R1): $1.35745
- Resistance 2 (R2): $1.36550
It should be considered, however, that while some downside is possible in the immediate, price remains in a sideways channel, with longer-term direction unclear.
Until the fundamental analysis picture becomes clearer, traders are advised to approach with at least some caution.
Bitcoin Enters a Favourable Period
Statistically, September has a poor reputation for the cryptocurrency market, whereas October and November are the most favourable months, during which Bitcoin’s price has traditionally risen, as history shows. October has even earned the nickname “Uptober” within the crypto community.
The drop in BTC/USD at the end of September 2025 and the steady growth this week underline this established “tradition.”
Why is Bitcoin rising?
Fundamentally, demand for Bitcoin is strengthening:
→ due to growing uncertainty linked to the US government shutdown and increased appeal of safe-haven assets, as evidenced by capital inflows into Bitcoin‑related ETFs;
→ thanks to expectations of a Federal Reserve interest rate cut amid signs of a slowdown in the labour market.
At the same time:
→ JP Morgan analysts forecast that Bitcoin could rise to $165,000 by year‑end;
→ Cardano founder Charles Hoskinson suggested that by mid‑2026 BTC could reach $250,000, pointing to geopolitical shocks as a potential catalyst for growth.
Technical Analysis of the BTC/USD Chart
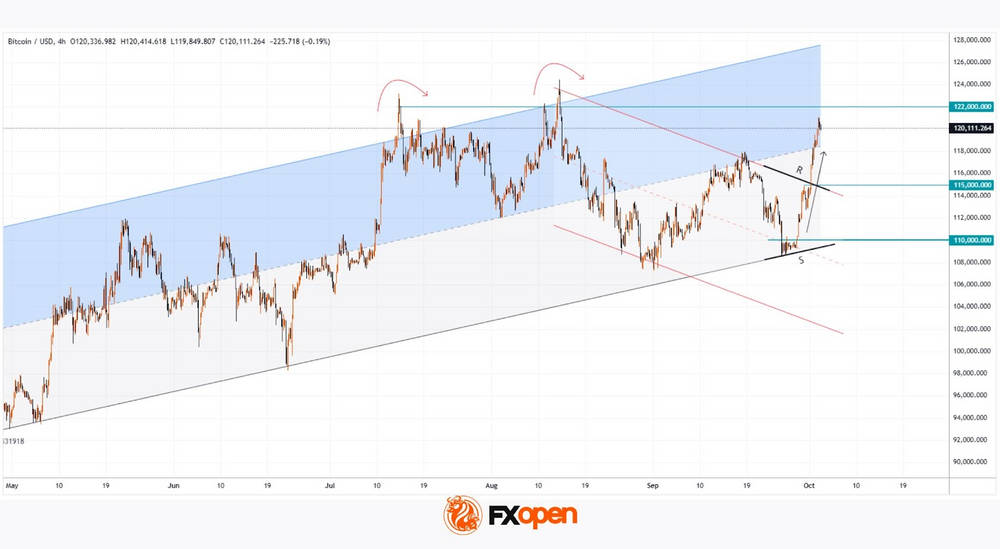
Analysing the drop in Bitcoin’s price on 22 September, we updated the long‑term ascending channel and suggested that:
→ bulls are retreating towards its lower boundary (on today’s Bitcoin chart, the channel is constructed using the regression method);
→ BTC/USD may consolidate within a broad zone forming an S–R triangle.
Indeed, between 25 and 28 September the lower boundary acted as support. Furthermore, note the price behaviour below the $110,000 level — there appeared to be few willing to sell the coin below this psychological threshold, creating initial momentum for a rally (highlighted by the black arrow). However, fluctuations within the S–R zone were not sustained.
Along the way, BTC/USD broke through:
→ the upper boundary of the red descending channel around $115,000 (which could act as support in the future). This marks a breakout of a corrective “bull flag” pattern and an attempt to resume the long‑term upward trend;
→ the psychological $120,000 level, reaching today a one‑and‑a‑half‑month high.
From a bearish perspective, selling pressure intensified around the $122,000 level, pushing the price down twice this summer (as shown by the red arrows). It is possible we could see a similar reversal for a third time. However, if October and November confirm their bullish reputation for the cryptocurrency market in 2025, this could drive Bitcoin’s price to the upper boundary of the channel, validating analysts’ positive forecasts.
FXOpen offers the world's most popular cryptocurrency CFDs*, including Bitcoin and Ethereum. Floating spreads, 1:2 leverage — at your service. Open your trading account now or learn more about crypto CFD trading with FXOpen.
*Important: At FXOpen UK, Cryptocurrency trading via CFDs is only available to our Professional clients. They are not available for trading by Retail clients. To find out more information about how this may affect you, please get in touch with our team.
This article represents the opinion of the Companies operating under the FXOpen brand only. It is not to be construed as an offer, solicitation, or recommendation with respect to products and services provided by the Companies operating under the FXOpen brand, nor is it to be considered financial advice.
GBP/JPY Daily Outlook
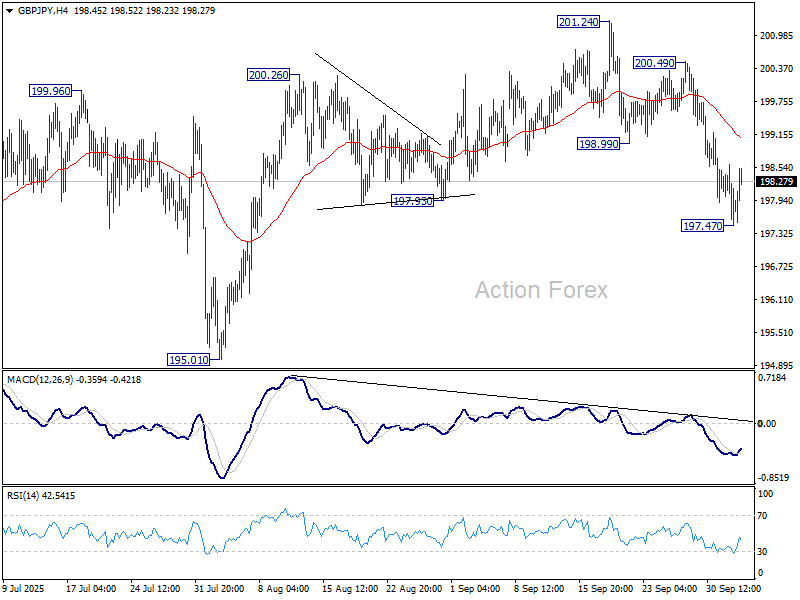
Daily Pivots: (S1) 197.39; (P) 198.01; (R1) 198.52; More...
Intraday bias in GBP/JPY is turned neutral first with current recovery. Some consolidations would be seen above 197.47 but further decline is expected as long as 200.49 resistance holds. Below 197.47 will resume the fall from 201.24 to 195.01 support next. Firm break there will confirm near term bearish reversal.
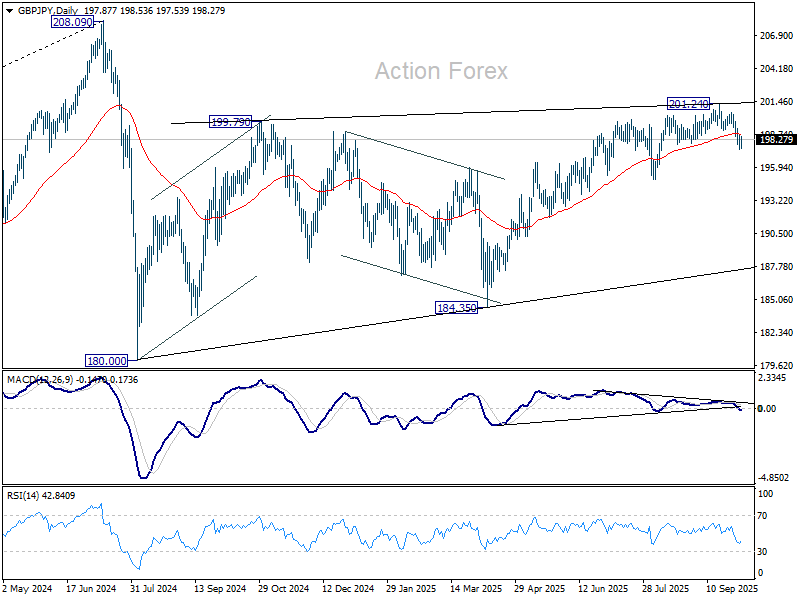
In the bigger picture, price actions from 208.09 (2024 high) are seen as a correction to rally from 123.94 (2020 low). The pattern might still extend with another falling leg. But in that case, strong support should be seen from 38.2% retracement of 123.94 to 208.09 at 175.94 to contain downside. Meanwhile, decisive break of 208.09 will confirm long term up trend resumption.
EUR/JPY Daily Outlook
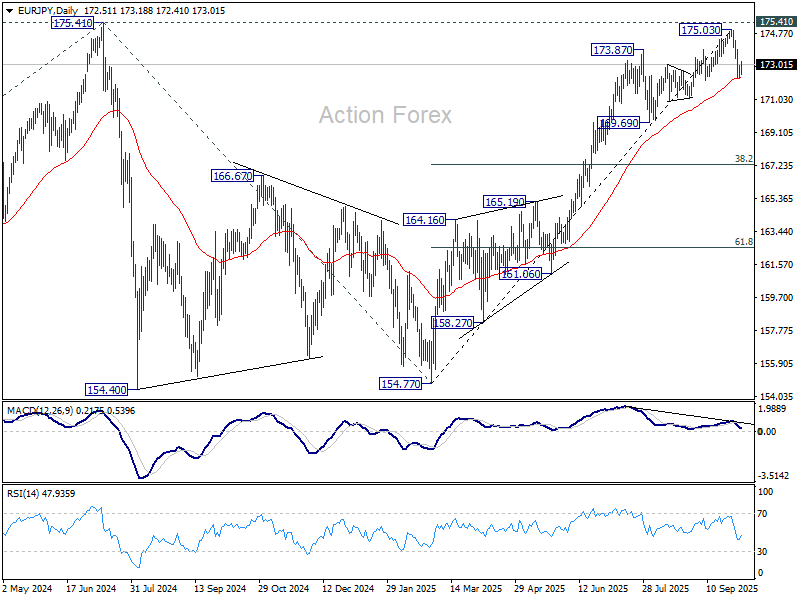
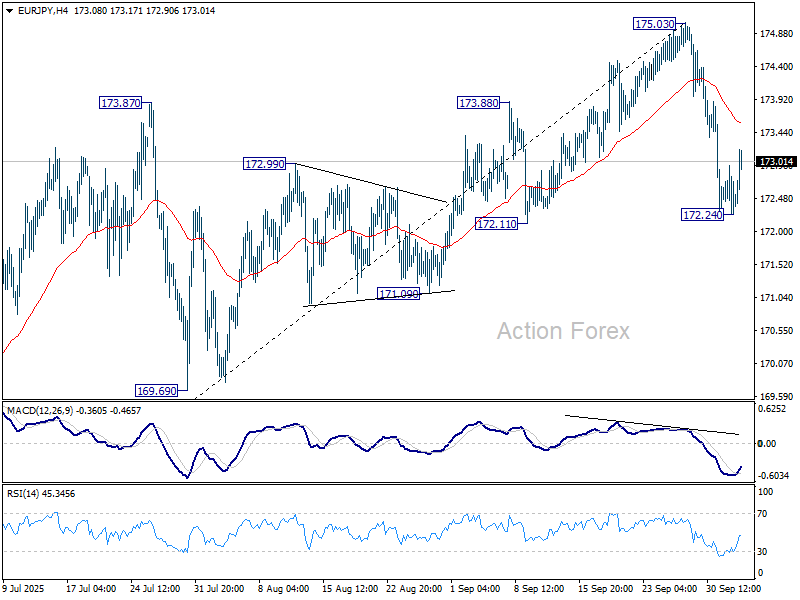
Daily Pivots: (S1) 171.92; (P) 172.92; (R1) 173.53; More...
EUR/JPY recovered after drawing support fro 55 D EMA (now at 172.25) and intraday bias is turned neutral first. Risk will stay on the downside as long as 175.03 resistance holds. On the downside, sustained trading below 55 D EMA will argue that whole five-wave rally from 154.77 has completed. Further fall should then be seen to 169.69 support next.
In the bigger picture, current rally from 154.77 is still tentatively seen as resuming the larger up trend. Firm break of 175.41 (2024 high) will confirm and target 61.8% projection of 124.37 (2022 low) to 175.41 from 154.77 (2025 low) at 186.31. However, sustained break of 55 D EMA will delay this bullish case, bring deeper pullback to 169.69 support first.