
Sample Category Title
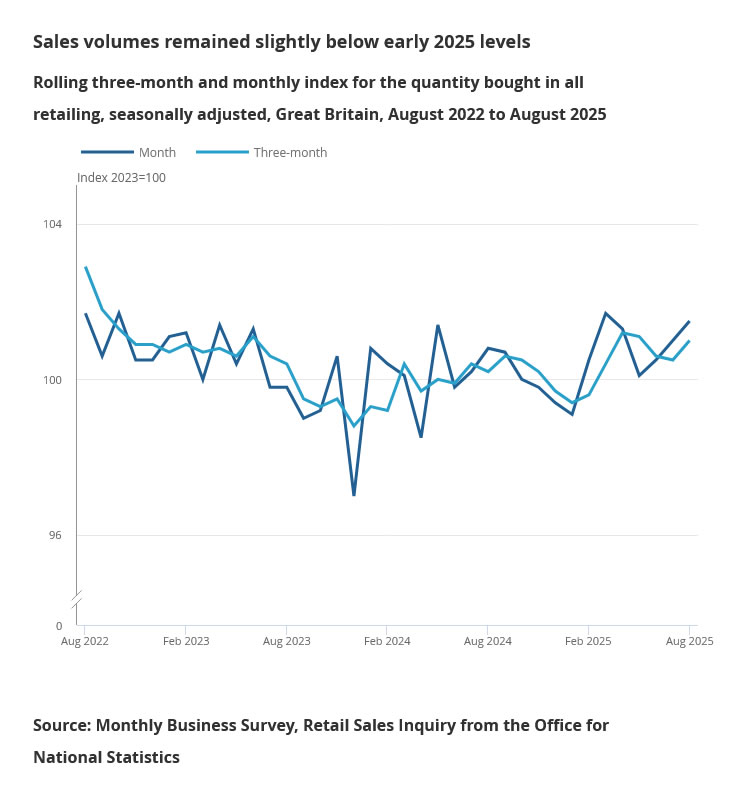
UK retail sales rise 0.5% mom in August, third monthly gain
UK retail sales rose 0.5% mom in August, slightly above expectations of 0.4%, marking a third consecutive month of growth. Still, volumes remain shy of their March 2025 peak, highlighting that the rebound is steady but incomplete.
The broader three-month trend still points to weakness, with sales down -0.1% compared to the three months to May. However, this marks an improvement from July’s -0.6% decline, indicating the downturn in spending is losing intensity.
BoJ Crashes the Party
The markets’ final verdict for US indices was clear: the S&P 500, Nasdaq and Dow Jones all hit all-time highs a day after the Federal Reserve (Fed) started cutting rates for an economy whose growth forecast it had just raised. The US small-cap index jumped 2.5%, while the Stoxx 600 and FTSE 100 rebounded as well, despite both the European Central Bank (ECB) and the Bank of England (BoE) delivering no rate cuts at their latest meetings and being expected to deliver none this year. I will come to yesterday’s BoE decision later, but first...
While US stock markets were hitting fresh records, a sharp slump in weekly jobless claims raised some eyebrows among bond traders about the health of the US jobs market. The US 2-year yield rebounded to 3.58%. But weekly figures tend to be volatile for multiple reasons, so I don’t think this changes the broader narrative of a weakening jobs market. I would be more concerned to see inflation pick up rather than a sudden return to strong US jobs numbers.
All in all, US and global assets popped the champagne yesterday—but Japanese equities are feeling hungover this morning. The Bank of Japan (BoJ) maintained its rates unchanged, which is positive because the next move is expected to be a rate hike, but it also announced it will start selling about ¥330bn worth of ETFs per year. Considering the BoJ has become a major holder of domestic assets, the announcement did little to support investor sentiment into the weekend. The Nikkei is down more than 2% at the time of writing.
The risk now is that this shift reverberates beyond Japan: tighter BoJ policy could counterbalance Fed-driven optimism, pressure richly valued US tech names and weigh on Europe’s luxury and cyclical exporters exposed to Asian demand. On the fixed income side, reduced Japanese demand for overseas bonds could push yields higher—especially long-term maturities in the DM markets—while FX moves could worsen matters if the yen strengthens and the BoJ continues its normalization, potentially triggering a reverse carry trade. In short, what looks like a step toward long-term normalization in Japan risks feeding near-term risk-off sentiment globally. The Japanese 10-year bond rose following the BoJ decision, while the US 10-year yield probably hit a bottom around 4%. Futures markets are mostly flat this morning, with FedEx up 6% in after-hours trading on strong results. We could see some profit-taking at the end of a central bank-heavy week: the Fed started cutting rates and indicated more cuts could come, but with wide divergence among members about next steps; the BoC cut its rates by 25bp, while the BoE and BoJ stayed on hold.
Speaking of the BoE: it maintained rates unchanged yesterday but took a dovish step by reducing QT. It will sell £70bn in assets over the next year instead of £100bn, focusing more on short-term gilts to ease pressure on long-term yields that affect pensions, insurers and government borrowing costs. Whether this will meaningfully boost UK fiscal headroom is yet to be seen. The 10-year gilt yield closed higher after starting the session elevated.
Broadly, long-maturity yields in developed markets remain under pressure. US tech valuations are still rich, and political and geopolitical tensions across the US, Europe, the UK and Japan remain front-page news. Today, Trump and Xi are scheduled to discuss trade, TikTok and other issues. While a further extension of the trade truce is possible, prolonged negotiations give China time to reduce technological dependence on the US—for instance, this week, Alibaba and ByteDance were instructed not to purchase Nvidia chips. And Huawei announced new AI chips and supercomputers rolling out from 2026 to 2028, aiming to compete directly with Nvidia through advanced memory and large-scale computing systems.
In the US, there is growing effort to broke large deals to bring manufacturing back home and reduce dependence on foreign suppliers, as well. Yesterday, Nvidia announced a $5bn investment in Intel for about a 4% stake and a collaboration to develop new chips for PCs and data centers, pairing Nvidia’s GPU and AI expertise with Intel’s CPU ecosystem. The deal could signal confidence in Intel’s turnaround—or a political win for the US administration aiming to revive a former national champion and boost domestic chip manufacturing. For Nvidia, it offers more control over CPU/GPU integration in AI infrastructure, as well as stronger political ties to the US government that also took a 10% stake in the company recently (!) Shares reacted accordingly: Nvidia rose 3.5%, Intel 23%, and both could continue benefiting from government-linked news. Notably, Huang said these discussions had been ongoing for a year, unrelated to recent developments, but the way Nvidia navigates political environments is both intriguing and high-stakes.
For other chipmakers, the Nvidia-Intel deal increases competitive pressure on AMD, which is not part of such politically strategic US alliances. Meanwhile, Chinese SMIC consolidated gains near all-time highs.
In summary, the week ends with a heating chip war, strong tech demand supported by softer Fed policy, but many looming questions regarding rich US valuations, ongoing political, geopolitical risks and multi-year high long-maturity yields.
GBP/JPY Daily Outlook
Daily Pivots: (S1) 200.00; (P) 200.64; (R1) 201.22; More...
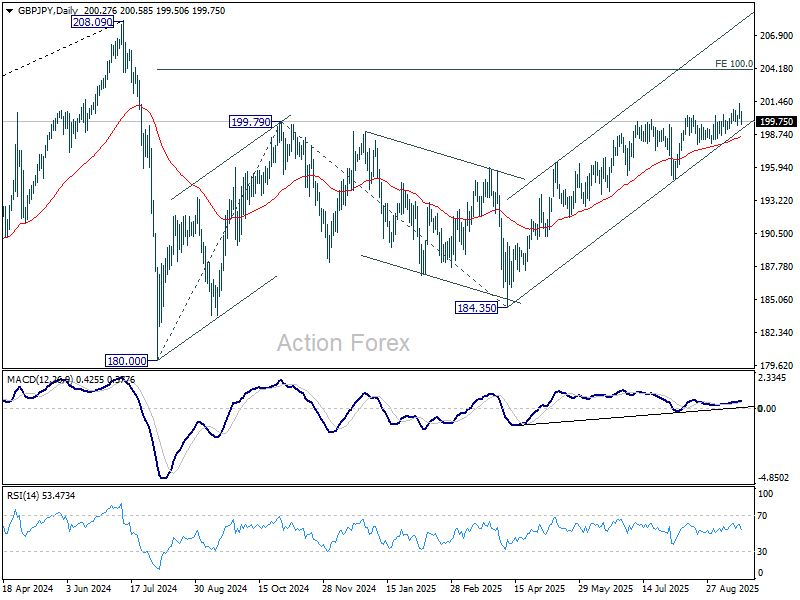
GBP/JPY spikes higher to 201.24 but quickly retreated. Intraday bias remains neutral first. Further rise is expected as long as 197.93 support holds. Firm break of 201.24 will target 100% projection of 180.00 to 199.79 from 184.35 at 204.14. However, considering bearish divergence condition in both D and 4H MACD, firm break of 197.93 will indicate bearish reversal and bring deeper fall back to 195.01 support first.
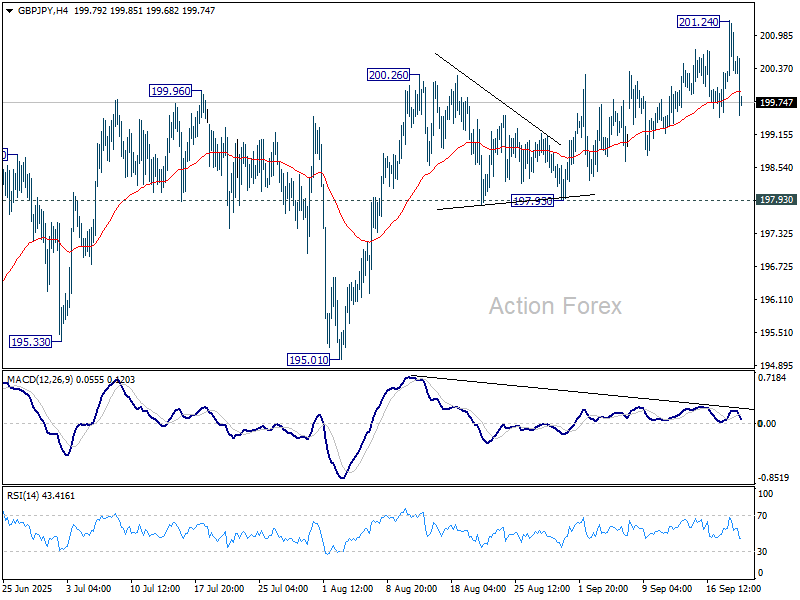
In the bigger picture, price actions from 208.09 (2024 high) are seen as a correction to rally from 123.94 (2020 low). The pattern might still extend with another falling leg. But in that case, strong support should be seen from 38.2% retracement of 123.94 to 208.09 at 175.94 to contain downside. Meanwhile, decisive break of 208.09 will confirm long term up trend resumption.
Yen Rebounds as BoJ Tilts Hawkish, Nikkei Retreats From Record
Yen staged a broad rebound today after the BoJ held rates steady at 0.50% but delivered a hawkish signal with two members dissenting in favor of a hike. The shift in the board underlined growing momentum toward policy normalization. At the same time, the Nikkei pulled back sharply from record highs reached earlier this week, reflecting investor caution around the prospect of tighter conditions.
The changing balance within the BoJ highlights a gradual move closer to resuming rate hikes, even as inflation pressures ease. Yet, political developments could complicate the path ahead. The departure of Prime Minister Shigeru Ishiba and uncertainty over his successor may encourage policymakers to tread carefully, waiting for a clearer political backdrop before committing to a move.
In currency markets, Kiwi remains the weakest performer of the week, weighed down by a shock contraction in Q2 GDP that fueled speculation of a deeper easing cycle by the RBNZ. The Aussie also lags following soft labor market data. Sterling is under pressure after the BoE left policy unchanged, with two members voting for a cut. By contrast, Swiss Franc leads the pack, followed by Loonie and Euro. Dollar and Yen are holding mid-table, though today’s rebound leaves the Yen better positioned than earlier in the week.
Looking ahead, focus will shift to upcoming data releases including Germany’s PPI, UK retail sales, and Canadian retail sales. While these could generate short-term volatility, they are unlikely to provide lasting direction heading into the weekend, with broader themes of central bank divergence still dominating market sentiment.
In Asia, at the time of writing, Nikkei is down -0.27%. Hong Kong HSI is down -0.02%. China Shanghai SSE is up 0.14%. Singapore Strait Times is down -0.17%. Japan 10-year JGB yield is up 0.04 at 1.641. Overnight, DOW rose 0.27%. S&P 500 rose 0.48%. NASDAQ rose 0.94%. 10-year yield rose 0.028 to 4.104.
BoJ holds with two members calling for hike, starts selling ETFs and J-REITs
The BoJ kept rates steady at 0.50% in September, but the 7–2 vote revealed a growing hawkish bias. Naoki Tamura and Hajime Takata broke ranks to support a rate increase, citing upside risks to inflation and progress toward achieving the 2% price stability target. Takata said that Japan has more or less achieved its inflation goal, while Tamura argued that the key rate should move closer to neutral given skewed risks to the upside.
Alongside the decision, the BoJ unveiled plans to shrink its massive balance sheet by selling assets. The Bank will sell ETFs at a pace of JPY 330B annually and J-REITs at JPY 5B, with the principle of minimizing market disruption. With its balance sheet at 125% of GDP—far larger than other major central banks—the BoJ’s move marks a notable shift toward normalization, even as rates remain unchanged for now.
Japan core CPI Slows to 2.7%, lowest since late 2024
Japan’s consumer inflation eased notably in August, with both headline CPI and core CPI (excluding fresh food) falling to 2.7% yoy from 3.1% in July, the lowest since November 2024. Despite the slowdown, inflation has remained above the BoJ’s 2% target for over three years.
Core-core CPI, which strips out both fresh food and energy and is seen as a key gauge of underlying price dynamics, ticked down to 3.3% yoy from 3.4%. The moderation suggests a gradual cooling in inflationary pressures, though price growth remains elevated relative to historical norms.
Food prices continued to drive the cost-of-living squeeze, with processed food up 8.0% yoy, though slower than July’s 8.3%. Rice inflation also eased to 69.7% yoy from an eye-watering 90.7%. Energy prices provided some relief, falling -3.3% yoy after a -0.3% drop in July.
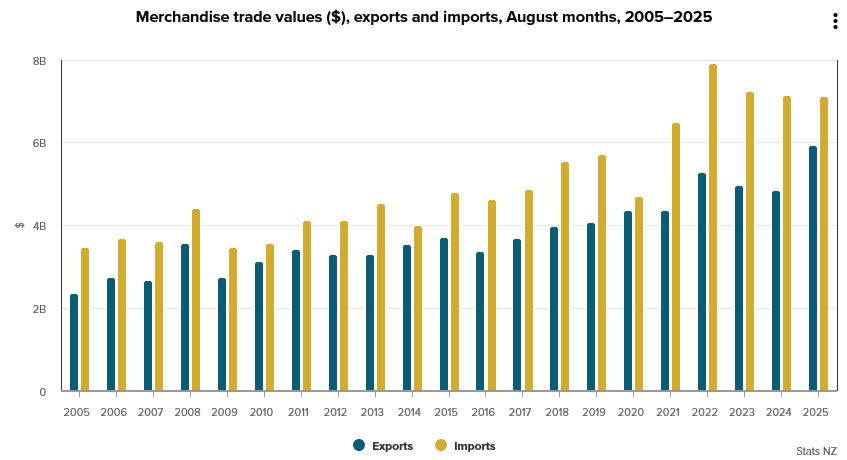
NZ exports jump 23% in August, imports flat, deficit at NZD -1.2B
New Zealand recorded a goods trade deficit of NZD 1.2B in August as imports outpaced a sharp rise in exports. Goods exports climbed NZD 1.1B, or 23% yoy, to NZD 5.9B, supported by strong shipments to major partners. Imports slipped slightly, falling NZD 30m (-0.4% yoy) to NZD 7.1B, but remained elevated enough to keep the monthly balance in deficit.
Export growth was broad-based, with China (+35% yoy, the EU (+52%), Australia (+17%), and the U.S. (+14%) all showing strong gains. Japan was the notable exception, where exports fell -11% yoy, driven by a NZD 28m decline in milk powder, butter, and cheese.
On the import side, flows from China rose 6.2% yoy, while purchases from the EU fell -6.0% and from the U.S. declined -1.3%. The largest pullback came from South Korea, where imports dropped -32% yoy.
GBP/JPY Daily Outlook
Daily Pivots: (S1) 200.00; (P) 200.64; (R1) 201.22; More...
GBP/JPY spikes higher to 201.24 but quickly retreated. Intraday bias remains neutral first. Further rise is expected as long as 197.93 support holds. Firm break of 201.24 will target 100% projection of 180.00 to 199.79 from 184.35 at 204.14. However, considering bearish divergence condition in both D and 4H MACD, firm break of 197.93 will indicate bearish reversal and bring deeper fall back to 195.01 support first.
In the bigger picture, price actions from 208.09 (2024 high) are seen as a correction to rally from 123.94 (2020 low). The pattern might still extend with another falling leg. But in that case, strong support should be seen from 38.2% retracement of 123.94 to 208.09 at 175.94 to contain downside. Meanwhile, decisive break of 208.09 will confirm long term up trend resumption.
BoJ holds with two members calling for hike, starts selling ETFs and J-REITs
The BoJ kept rates steady at 0.50% in September, but the 7–2 vote revealed a growing hawkish bias. Naoki Tamura and Hajime Takata broke ranks to support a rate increase, citing upside risks to inflation and progress toward achieving the 2% price stability target. Takata said that Japan has more or less achieved its inflation goal, while Tamura argued that the key rate should move closer to neutral given skewed risks to the upside.
Alongside the decision, the BoJ unveiled plans to shrink its massive balance sheet by selling assets. The Bank will sell ETFs at a pace of JPY 330B annually and J-REITs at JPY 5B, with the principle of minimizing market disruption. With its balance sheet at 125% of GDP—far larger than other major central banks—the BoJ’s move marks a notable shift toward normalization, even as rates remain unchanged for now.
Post-Fed Twist: USD/JPY Bullish Reversal – Don’t Miss Out
Key Highlights
- USD/JPY started a fresh increase after a sharp drop to 145.50.
- It cleared a major bearish trend line with resistance at 147.50 on the 4-hour chart.
- The Fed’s interest rate cut sparked swing moves, but ultimately the bulls had the upper hand.
- EUR/USD and GBP/USD started a downside correction.
USD/JPY Technical Analysis
The US Dollar declined sharply against the Japanese Yen during the Fed rate decision. USD/JPY spiked to 145.50 before there was a sharp recovery.
Looking at the 4-hour chart, the pair climbed above the 146.50 and 147.00 resistance levels. More importantly, the pair cleared a major bearish trend line with resistance at 147.50. It opened the doors for more gains above the 50% Fib retracement level of the downward move from the 149.13 swing high to the 145.48 low.
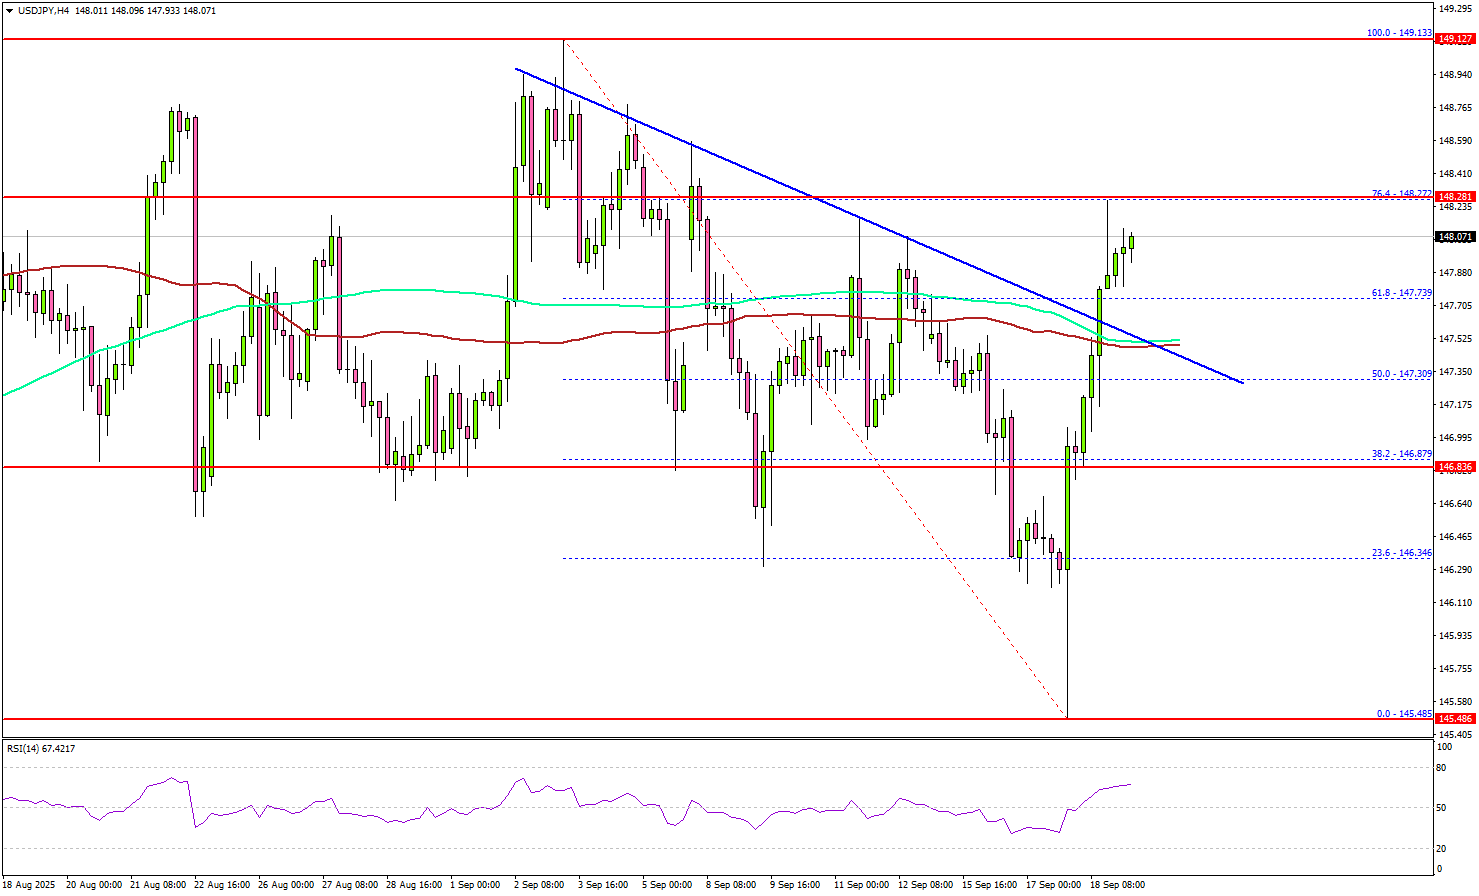
The pair settled above the 147.50 level, the 100 simple moving average (red, 4-hour), and the 200 simple moving average (green, 4-hour).
On the upside, the pair could face resistance near the 148.25 level or the 76.4% Fib retracement level of the downward move from the 149.13 swing high to the 145.48 low. The first major hurdle for the bulls could be 148.50.
A close above 148.50 could set the pace for a steady recovery wave. In the stated case, the pair could rise toward 149.20, above which the bulls could aim for a move toward 148.65. Any more upsides could send the pair toward 150.00.
On the downside, immediate support is 147.50. The next key area of interest might be near the 147.20 zone. The main support could be 146.50. Any more losses might increase selling pressure and send USD/JPY toward 146.00.
Looking at EUR/USD, the pair failed to continue higher above 1.1920 and recently started a downside correction.
Upcoming Key Economic Events:
- BoJ Press Conference.
- ECB's Sleijpen speech.
- EcoFin Meeting.
- Eurogroup Meeting.
Japan core CPI Slows to 2.7%, lowest since late 2024
Japan’s consumer inflation eased notably in August, with both headline CPI and core CPI (excluding fresh food) falling to 2.7% yoy from 3.1% in July, the lowest since November 2024. Despite the slowdown, inflation has remained above the BoJ’s 2% target for over three years.
Core-core CPI, which strips out both fresh food and energy and is seen as a key gauge of underlying price dynamics, ticked down to 3.3% yoy from 3.4%. The moderation suggests a gradual cooling in inflationary pressures, though price growth remains elevated relative to historical norms.
Food prices continued to drive the cost-of-living squeeze, with processed food up 8.0% yoy, though slower than July’s 8.3%. Rice inflation also eased to 69.7% yoy from an eye-watering 90.7%. Energy prices provided some relief, falling -3.3% yoy after a -0.3% drop in July.
NZ exports jump 23% in August, imports flat, deficit at NZD -1.2B
New Zealand recorded a goods trade deficit of NZD 1.2B in August as imports outpaced a sharp rise in exports. Goods exports climbed NZD 1.1B, or 23% yoy, to NZD 5.9B, supported by strong shipments to major partners. Imports slipped slightly, falling NZD 30m (-0.4% yoy) to NZD 7.1B, but remained elevated enough to keep the monthly balance in deficit.
Export growth was broad-based, with China (+35% yoy, the EU (+52%), Australia (+17%), and the U.S. (+14%) all showing strong gains. Japan was the notable exception, where exports fell -11% yoy, driven by a NZD 28m decline in milk powder, butter, and cheese.
On the import side, flows from China rose 6.2% yoy, while purchases from the EU fell -6.0% and from the U.S. declined -1.3%. The largest pullback came from South Korea, where imports dropped -32% yoy.
Cliff Notes: Countering Labour Market Risks
Key insights from the week that was.
In Australia, the August labour force survey validated the judgement that the labour market is softening once again. The three-month average pace of employment growth has decelerated to 1.8%yr, down from 2.5%yr in February. Underlying the headline trend, growth in ‘care economy’ employment has throttled back from its rollicking pace, while the market sector is slowly recuperating. A fall in participation allowed the unemployment rate to hold steady at 4.2% in August, but an upward drift is likely in coming months. While the downtrend in underemployment is seemingly at odds with the broader trend, this appears to be tied to a shrinking part-time share of total employment growth not an increase in labour utilisation by employers.
The August report is unlikely to shift the calculus for the RBA, with the Bank having already acknowledged that labour market conditions have “eased slightly” in its August decision communications. Westpac continues to expect the next RBA rate cut to be delivered in November, followed by two additional 25bp cuts in the first half of 2026.
Before moving offshore, a final note on the domestic manufacturing sector. The Q3 Westpac-ACCI Survey of Industrial Trends revealed conditions in the sector deteriorated into the second half of the year, the Actual Composite slipping from 51.5 in Q2 to a contractionary read of 48.8 in Q3. This is consistent with private sector demand tracking a gradual but patchy recovery – with falling orders and weak output. Despite this, manufacturers’ optimism over the outlook is unwavering – the Expected Composite currently sits at an elevated 58.1. There is a risk these strong expectations are not met, especially if the economic recovery remains sluggish and uneven.
Over in New Zealand, GDP surprised materially to the downside in Q2, declining 0.9% in the quarter to be 0.6% lower over the year (WBC f/c -0.4%, -0.1%yr). Our New Zealand Economics team believe the RBNZ are likely to assess there is too much excess capacity in the economy and consequently accelerate the final stage of the easing cycle to counter the trend. The RBNZ is now forecast to cut by 50bps at their October meeting and a further 25bp in November to 2.25% (previously we expected two 25bp cuts to a low of 2.50%). The trough rate for policy is expansionary, and so momentum should pick up into 2026. Monetary policy will likely need to be rebalanced from late-2026, but the precise timing will depend on the pulse of the economy over the coming 6-12 months.
Further afield, the focus was on major central banks.
The FOMC cut the fed funds rate by 25bps to a mid-point of 4.125% as expected at the September meeting. The guidance in the statement and press conference made clear that risk management is the Committee’s priority, while the revised forecasts highlighted the degree of uncertainty that remains over the outlook. On a median basis, the updated forecasts are sanguine and consistent with monetary policy being effective in managing inflation and demand. GDP growth has been revised up. It is now only expected to be below trend in 2025 at 1.6% then at trend through 2026-2028, circa 1.8%. The unemployment rate is consequently forecast to peak at just 4.5% in late-2025 before edging lower through 2026-2028 to the ‘longer run’ full employment rate of 4.2%. Inflation is not expected to hinder the FOMC’s ability to manage demand risks, with PCE inflation forecast to abate from around 3.0% at end-2025 to 2.6% by late-2026 then 2.1% at the close of 2027. While the return of inflation to the medium-term target over the forecast period is ‘by design’, taken together the activity and inflation forecasts signal the consensus view of the Committee is that tariff’s effect on inflation is a one-off and that services inflation will continue to abate. This would allow the fed funds rate to be cut to 3.4% at end-2026 and 3.1% by end-2027 – a broadly neutral rate – on the FOMC’s expectation.
We see conflicting risks to the FOMC’s forecasts, believing that economic growth and the labour market are likely to come in weaker than the Committee are forecasting for 2025-2027, but also that inflation will show greater persistence. In the absence of recession, this mix is arguably most likely to result in a need to hold to a modestly restrictive stance through the forecast horizon. Whether our current 3.875% low for the cycle or a rate closer to neutral is seen over the coming 12 to 18 months will depend on the trajectory of the respective labour market / inflation trends away / to the FOMC’s mandate. Only the data flow will be able to adjudicate on progress and guide on the evolving risk outlook.
North of the border, the Bank of Canada also cut rates by 25bps to 2.50% as tariffs continue to affect activity while inflation pressures abate. The Governing Council assess that "shifts in trade continue to add costs"; how this dynamic impacts activity and inflation will determine future policy steps.
Across the pond, the Bank of England deliberated on the latest labour market and inflation data and decided to hold the bank rate at 4.0% in a 7-2 split decision. The statement suggests the MPC remain attuned to upside inflation risks – both "existing or emerging". The August CPI gave support for this approach, price growth accelerating to 0.3% in the month while the annual figure remained at 3.8%. Services inflation remains stubbornly near 5.0%yr, printing at 4.7%yr in August.
The MPC will continue to take a 'gradual and careful' approach to further easing, with the timing to depend on progress with disinflation and downside risks to activity. We view a one cut per quarter pace as a fair expectation; though, if inflation remains sticky, there is a risk of the November cut being delayed. The MPC also decided to slow the pace of quantitative tightening in their annual review; members now expect to reduce the balance sheet by GBP70bn a year from GBP100bn previously. Of the GBP70bn, around GBP21bn will be through active sales and the rest through bonds maturing. The decision follows volatility in Gilt markets and a similar decision by the Bank of Japan earlier this year.
A final point on China. This week’s August data round highlights that, while continuing to experience success with trade and despite burgeoning equity market momentum, consumer-related sub-sectors of China’s economy remain weak and susceptible to downside risks. Most notably, new home prices declined again, continuing a 27-month long trend, and property investment’s contraction accelerated, now down 12.9%ytd. The year-to-date gain for total fixed asset investment also deteriorated to just 0.5%, well down on 2024’s 3.3%. Note, this outcome is only partly due to the moribund state of housing construction; key high-tech manufacturing sectors have pulled back on current investment following rapid expansion over recent years, their focus now turning to the effective and profitable implementation of new capacity. At this stage in China’s economic development, continued rapid growth in new manufacturing capacity is unsustainable; equally, the contribution from trade must moderate. As such, it is important October’s Plenum deliver a consumer centric five-year plan for 2026-2031, with an immediate focus on ending property price and investment declines and means to fuel confidence over future income growth. Without such steps, GDP growth in the mid 4%’s from 2026 will likely prove unsustainable, as discussed in our September Market Outlook.
Gold (XAU) and Silver (XAG) Find Selling Pressure from Post-FOMC Stronger US Dollar
Gold and Silver are subject to immediate pressure as the US Dollar regains strength and reputation after yesterday's FOMC meeting.
The challenged independence of the Fed was a major driver behind the immense rally metals enjoyed from late August into early September, as Powell’s shift in tone from the Jackson Hole conference cast doubt on the Fed’s consistency amid still high inflation.
Yet the dovish stance advocated by Bowman and Waller, seen as President Trump's protege-appointees ahead of the Sep FOMC—was vindicated by subsequent NFP misses and the downward revisions in BLS data.
This is leading to the Federal Reserve regaining back some of its lost confidence throughout the past few months.
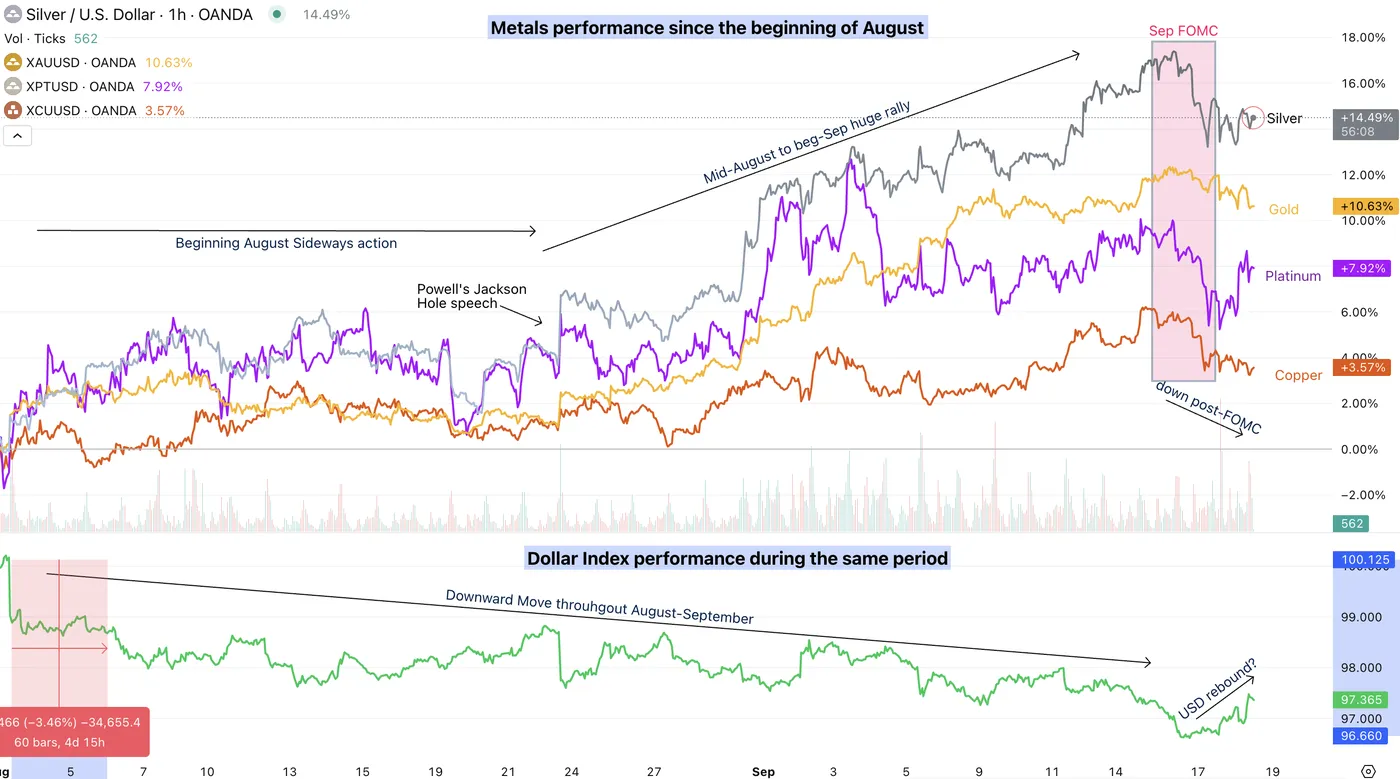
Dollar Index and Metals comparative Performance since beginning August, September 18, 2025 – Source: TradingView
Silver rallied 18.67% from its July 31st trough to its Tuesday peak, while Gold surged from $3,268 on July 30th to fresh all-time highs at $3,707.
Despite the ongoing pullback, prices remain near their highs.
Still, the balance is tilting towards a more neutral trend: With Powell delivering a less dovish message than markets had priced in, the renewed resilience of the US Dollar could set the stage for tighter price action ahead.
Let's dive into two timeframe charts for both Gold (XAU/USD) and Silver (XAG/USD) to see where the current trading takes us and where to look going forward.
Gold and Silver two-timeframe picture
Gold (XAUUSD) Daily Chart
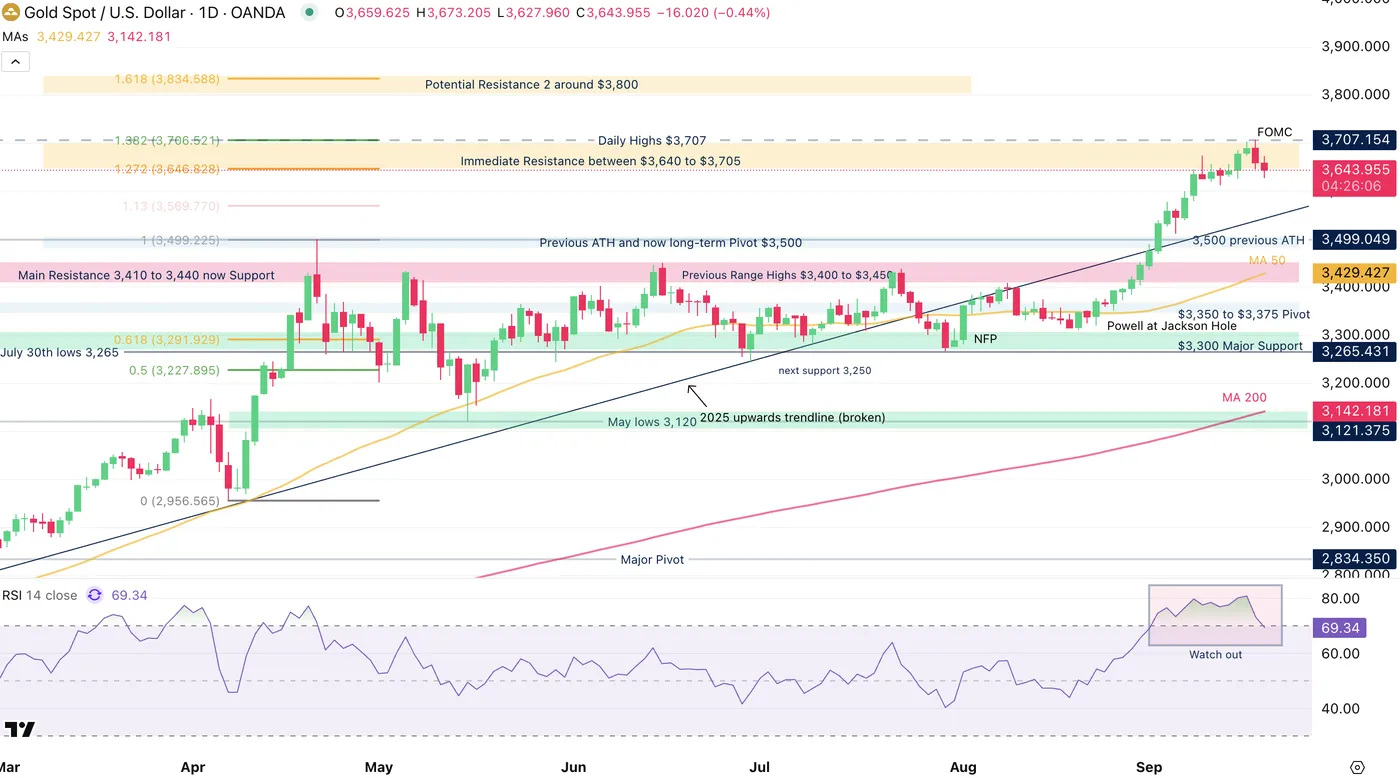
Gold (XAUUSD) Daily Chart, September 18, 2025 – Source: TradingView
Gold responded remarkably to the technical-Fibonacci induced resistance mentioned in our most recent Gold analysis.
We precedently expressed how overbought levels don't imply tops, particularly amid strong performance and momentum.
However, Daily RSI is starting to shape downwards and may not help to sustain the current levels.
There is still an ongoing consolidation that is happening from the intermediate lows, which demands a closer look.
Gold (XAUUSD) 2H Chart and levels
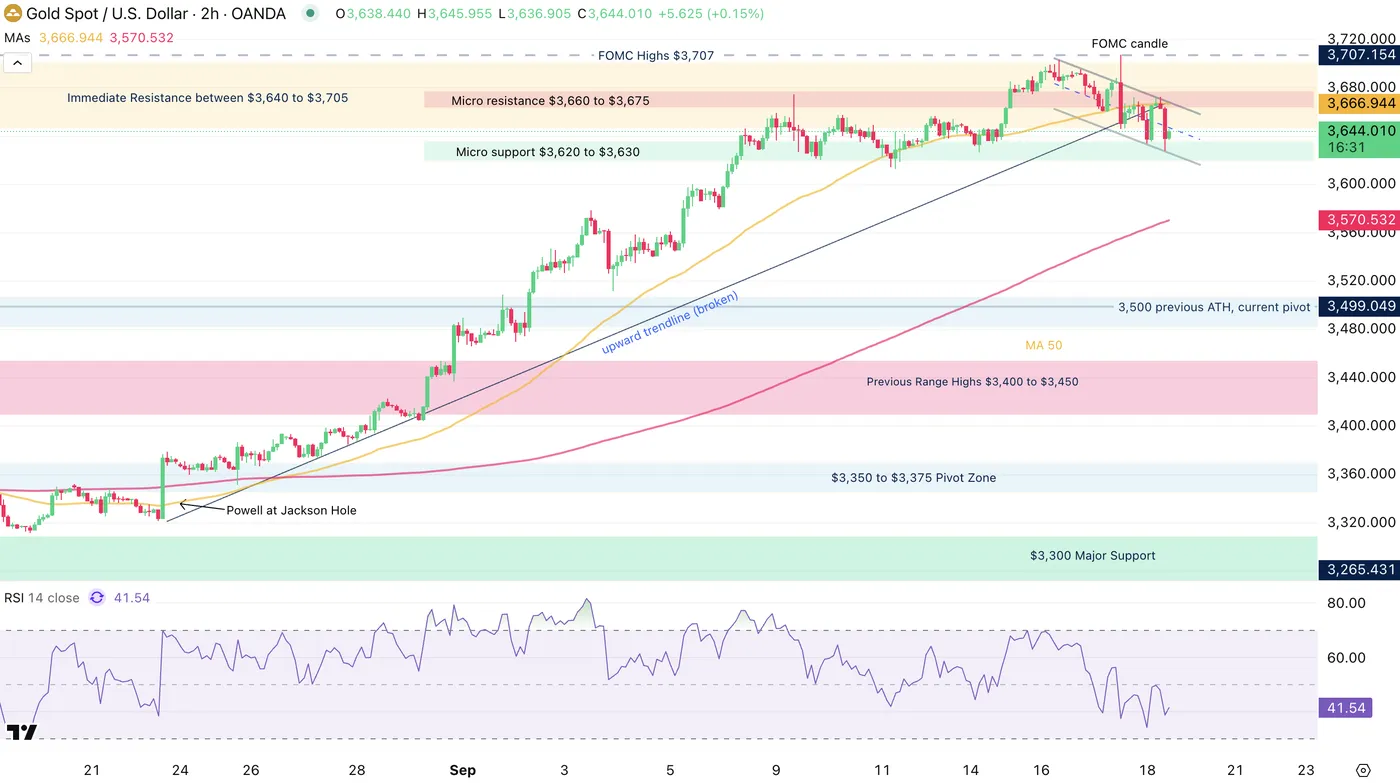
Gold (XAUUSD) 2H Chart, September 18, 2025 – Source: TradingView
Selling momentum is currently stalling but the bigger timeframe outlook is showing signs of slowdown within the current trend, particularly when seeing the broken upward trendline that led to the new $3,707 All-time Highs.
Look for breakouts either above or below the Micro support and resistance zones, with their levels detailed just below.
Levels of interest for Gold trading:
Support:
- Micro support $3,620 to $3,630
- Previous ATH and now long-term Pivot around $3,500 (+/- $15)
- Previous Range Highs $3,400 to $3,450 (minor support)
- $3,300 Major Support
- $3,000 Main psychological level
Resistance and potential technical targets (due to all-time highs, can only use potential targets):
- Micro resistance $3,660 to $3,675
- FOMC and All-time highs Highs $3,707
- Fibonacci-Extension 1 from April Lows to April highs ($3,640 to $3,705) (Immediate resistance)
- Potential, Fibonacci-Extension 2 from 2018 to Oct 2024 induced target: $3,750 to $3,815 (Purple square on Weekly)
Silver (XAGUSD) Daily Chart
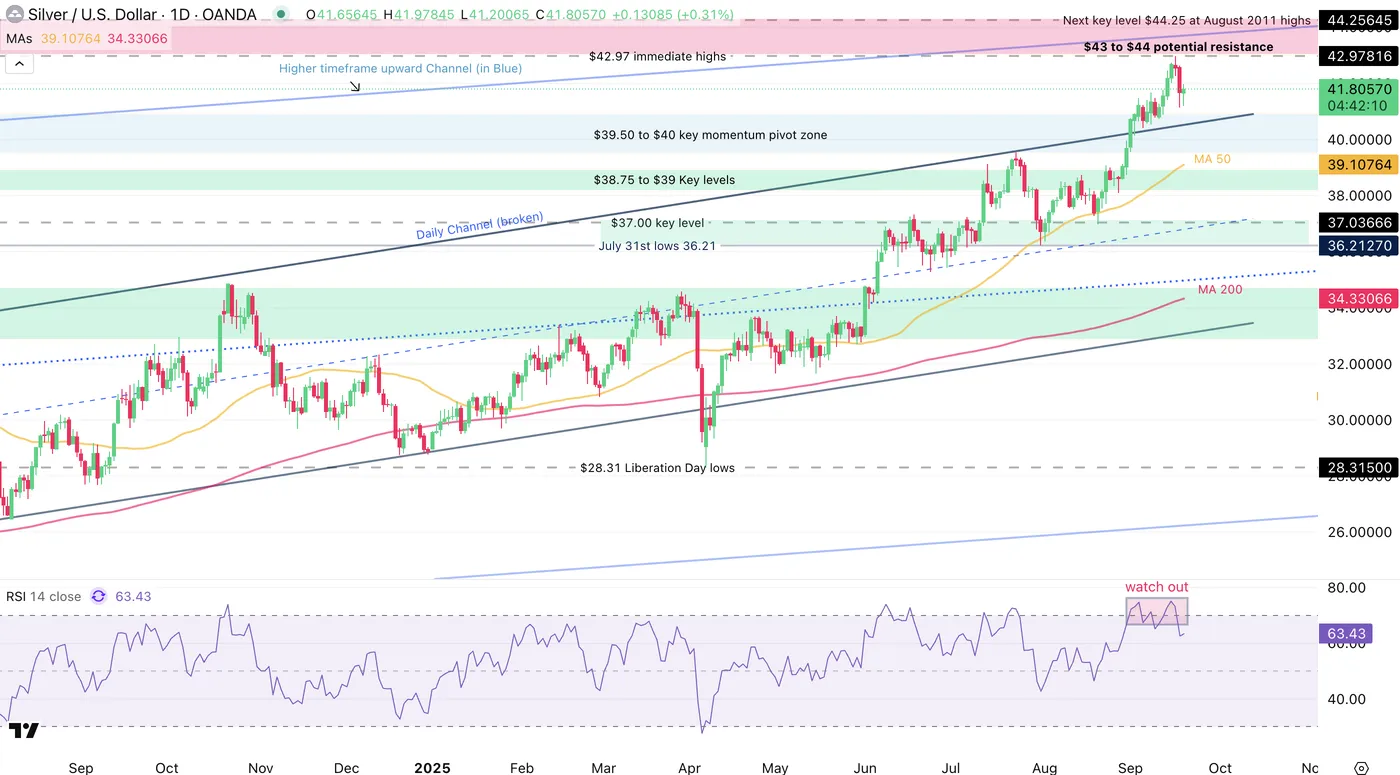
Silver (XAGUSD) Daily Chart, September 18, 2025 – Source: TradingView
Since our most recent Silver Analysis, prices did effectively break out of its daily upward channel but found technical resistance (to complement the fundamental resistance) at the higher bound of the Higher timeframe channel (in Blue).
Look at the Daily RSI also showing some type of divergence – Overall, despite the action still hanging at the highs, it looks like some intermediate correction might come into play.
Let's have a closer look.
Silver (XAGUSD) 2H Chart and levels
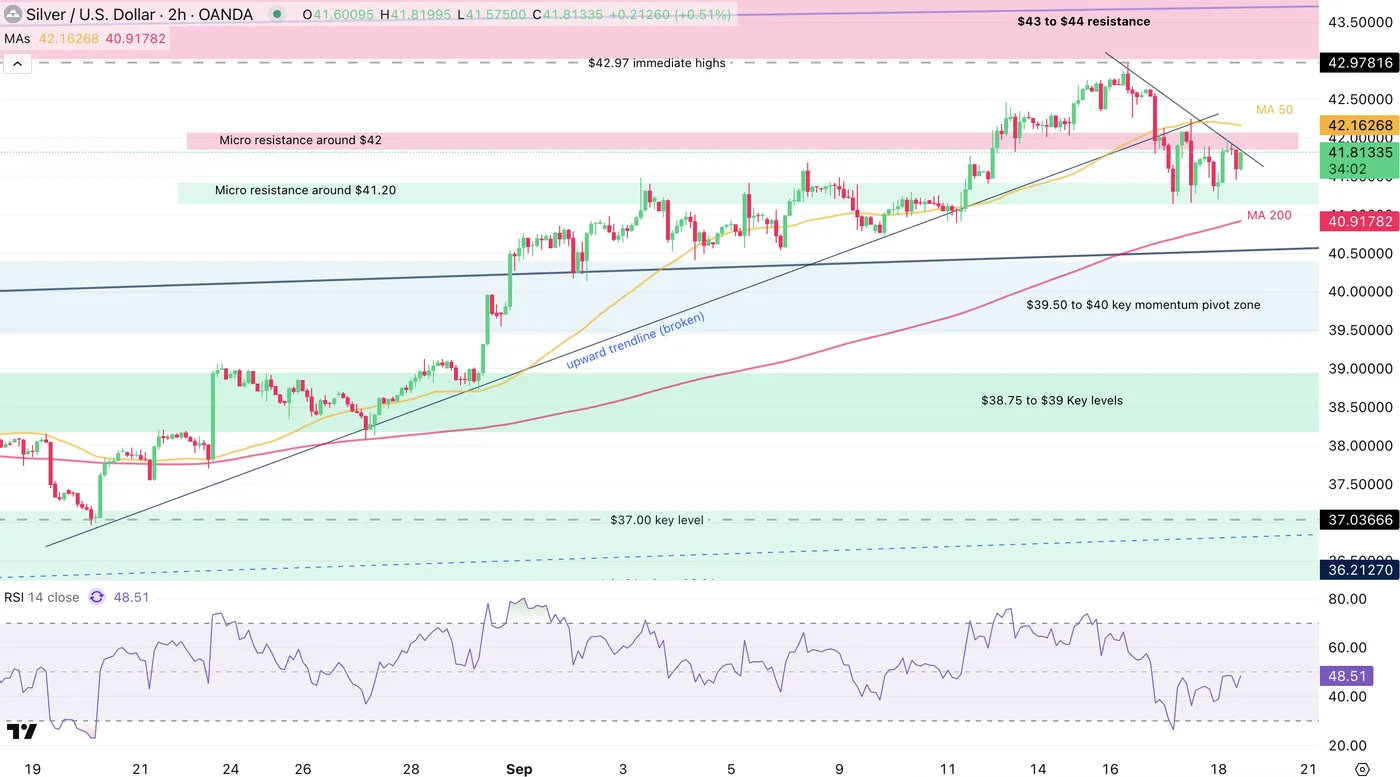
Silver (XAGUSD) 2H Chart, September 18, 2025 – Source: TradingView
The selling from this yesterday to this morning's session has stalled a bit and short-term momentum is back to neutral.
Prices are now contained between an short-term resistance and support zone, in the ongoing $41.20 to $42 range.
Levels to watch for Silver (XAG) trading:
Resistance Levels:
- $42 psychological level and micro-resistance
- 50-Period MA 50 42.17
- $43 to $44 resistance (Most recent peak $42.97)
- August 2011 $44.25 top
Support Levels:
- Micro resistance around $41.20
- $39.50 to $40 key pivot zone
- $38.75 to $39 Key levels
- 2012 Highs Support around 37.50
Safe Trades!